

Key Insights
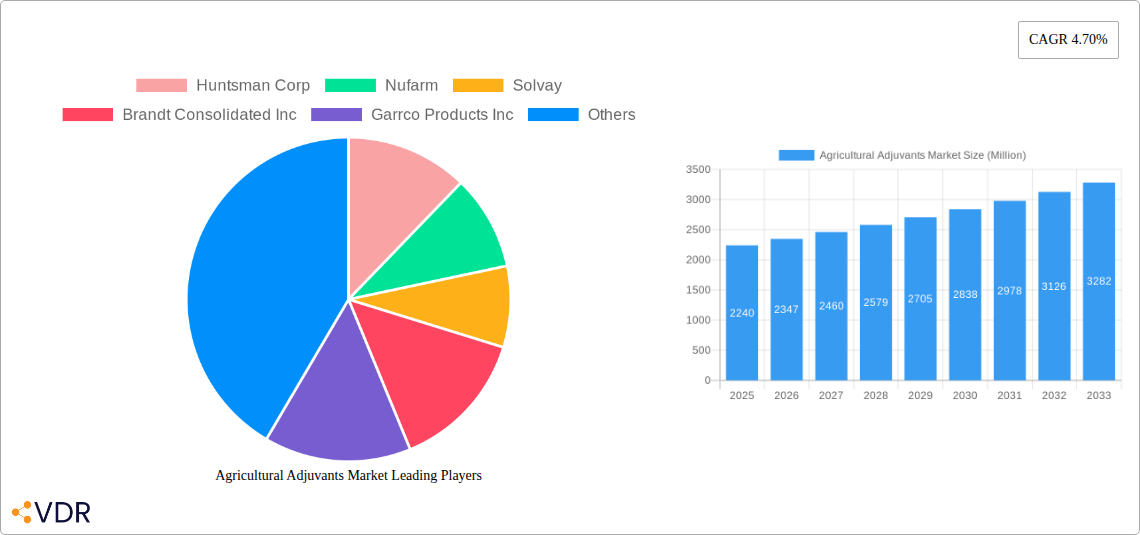
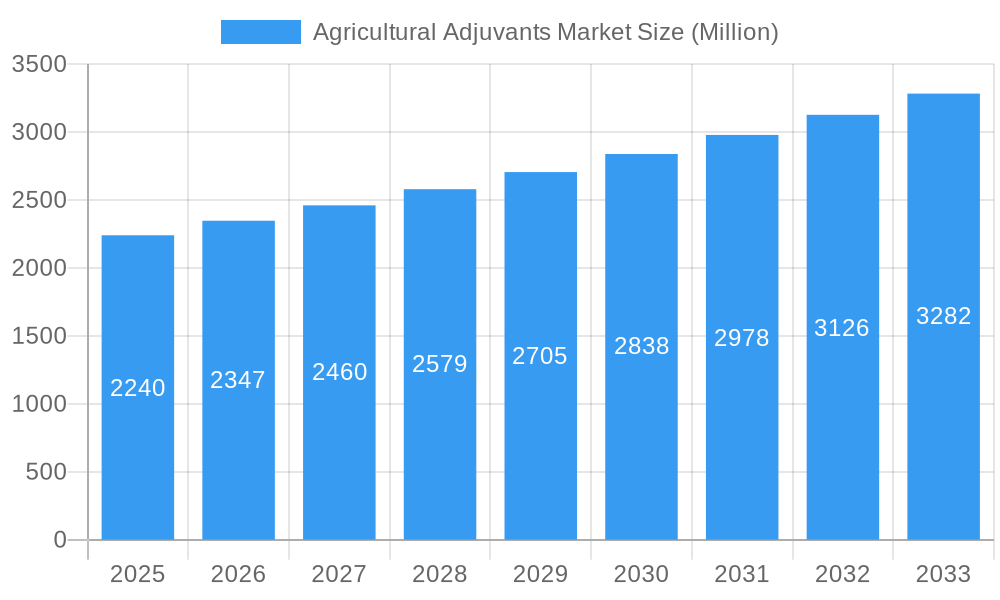
The global agricultural adjuvants market, valued at $2.24 billion in 2025, is projected to experience robust growth, driven by the increasing demand for high-yielding crops and the rising adoption of precision agriculture techniques. A Compound Annual Growth Rate (CAGR) of 4.70% is anticipated from 2025 to 2033, indicating a significant market expansion. This growth is fueled by several factors, including the growing awareness among farmers about the benefits of adjuvants in enhancing crop protection product efficacy, improving spray coverage, and reducing application costs. The rising prevalence of crop diseases and insect infestations, coupled with the increasing need for sustainable agricultural practices, further bolsters market demand. Significant growth is expected in segments such as oil-based adjuvants, which offer superior performance compared to other types, and herbicide adjuvants, driven by the widespread use of herbicides in modern farming. Regions like North America and Asia-Pacific, with their large agricultural sectors and substantial investments in agricultural technology, are expected to dominate the market, exhibiting significant growth throughout the forecast period. However, factors such as stringent regulatory approvals and the potential environmental concerns associated with certain adjuvant types could act as restraints.
Agricultural Adjuvants Market Market Size (In Billion)
The competitive landscape is characterized by a mix of established multinational corporations and regional players. Key players like Huntsman Corp, Nufarm, Solvay, and others are continuously investing in research and development to introduce innovative products and expand their market share. Strategic partnerships, mergers and acquisitions, and product diversification are key strategies adopted by these companies to enhance their competitiveness and gain a foothold in different geographical regions. The market is segmented by type (activator adjuvants and oil adjuvants) and application (herbicide, insecticide, and fungicide adjuvants). The forecast suggests a continued shift towards more specialized and effective adjuvants tailored to specific crop needs and pest management strategies, further driving market segmentation and specialization. The continued growth of the market is largely dependent on factors such as favourable government policies promoting sustainable agriculture, technological advancements, and increasing farmer awareness.
Agricultural Adjuvants Market Company Market Share
This comprehensive report provides a detailed analysis of the global Agricultural Adjuvants Market, encompassing market dynamics, growth trends, regional segmentation, product landscape, key players, and future outlook. The study period covers 2019-2033, with 2025 as the base year and a forecast period of 2025-2033. The report delves into the parent market of agricultural chemicals and the child market of crop protection adjuvants, offering a granular view of this vital sector. The market size is valued in million units.
Agricultural Adjuvants Market Dynamics & Structure
This section analyzes the competitive landscape, technological advancements, regulatory influences, and market trends within the agricultural adjuvants industry. The market is moderately concentrated, with key players such as Huntsman Corp, Nufarm, Solvay, and others holding significant market share. The report quantifies market concentration using the Herfindahl-Hirschman Index (HHI) and identifies the top five players' aggregate market share (estimated at xx%).
Market Structure:
- High barriers to entry: Significant R&D investment and stringent regulatory approvals present considerable hurdles for new entrants.
- Technological innovation: Ongoing research focuses on developing bio-based adjuvants and improving adjuvant efficacy for specific crops and pesticides.
- Regulatory framework: Varying regulations across different geographies influence product development and market access. Compliance with environmental and safety standards is crucial.
- Competitive substitutes: Alternative methods of crop protection, including biological control agents and genetically modified crops, exert competitive pressure.
- M&A activity: Consolidation through mergers and acquisitions is expected to continue, driven by the need for scale and expansion into new markets. The report estimates xx M&A deals in the historical period (2019-2024).
- End-user demographics: The market is primarily driven by large-scale commercial farms, followed by smaller-scale farms and horticultural operations. Growth is influenced by factors such as farm size distribution, technological adoption rates, and farmer income levels.
Agricultural Adjuvants Market Growth Trends & Insights
The global agricultural adjuvants market experienced significant growth during the historical period (2019-2024), driven by factors such as increasing crop production, rising demand for high-yielding crops, and the growing adoption of precision agriculture techniques. The market size in 2024 is estimated at xx million units, with a CAGR of xx% during 2019-2024. This growth is projected to continue during the forecast period (2025-2033), albeit at a slightly moderated pace. The report projects a CAGR of xx% during 2025-2033, reaching a market size of xx million units by 2033. Market penetration is highest in developed regions, with significant growth potential in emerging economies as agricultural practices modernize. Technological advancements, such as the development of more efficient and environmentally friendly adjuvants, are fueling market expansion. Consumer behavior shifts toward sustainable and environmentally responsible agricultural practices are also shaping market demand.
Dominant Regions, Countries, or Segments in Agricultural Adjuvants Market
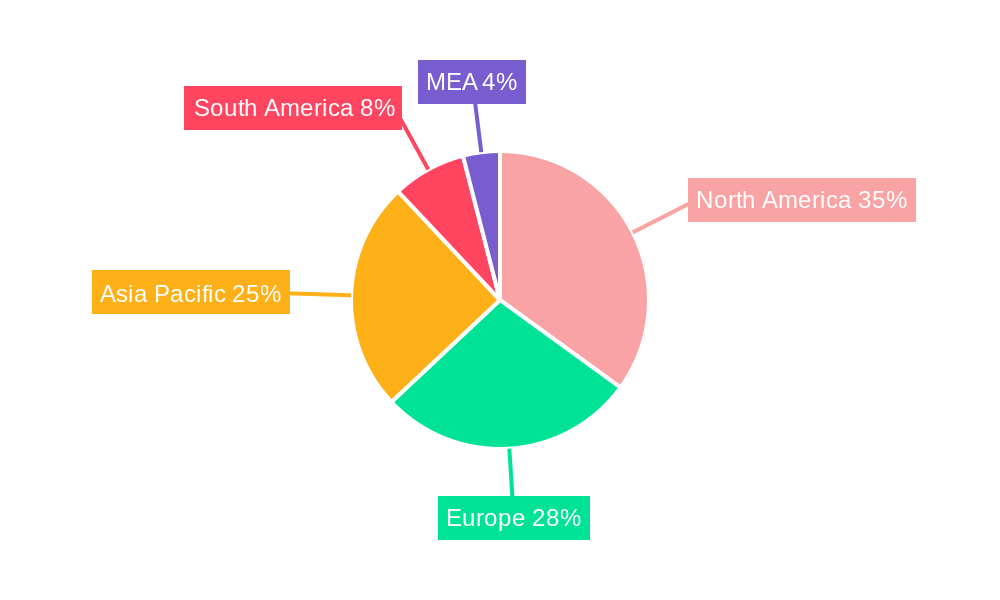
North America and Europe currently dominate the agricultural adjuvants market, driven by high agricultural output, advanced farming techniques, and stringent regulatory frameworks. However, the Asia-Pacific region is projected to witness significant growth during the forecast period, fueled by rising agricultural production, increasing disposable incomes, and government initiatives promoting agricultural modernization.
Leading Segments:
- By Type: Oil-based adjuvants currently hold the largest market share, due to their established efficacy and cost-effectiveness. However, activator adjuvants are witnessing strong growth, driven by their superior performance in specific applications. Utility adjuvants are also exhibiting a steady growth trajectory.
- By Application: Herbicide adjuvants constitute the largest segment, followed by insecticide and fungicide adjuvants. The "Other Applications" segment comprises adjuvants used with other crop protection products and soil amendments, exhibiting modest but consistent growth.
Key Regional Drivers:
- North America: High adoption of precision agriculture and a well-established agricultural sector.
- Europe: Stringent regulatory frameworks promoting the use of environmentally friendly adjuvants.
- Asia-Pacific: Rapid growth in agricultural production and increasing demand for high-yielding crops.
Agricultural Adjuvants Market Product Landscape
The agricultural adjuvant market features a diverse range of products tailored to specific crop protection needs. Innovations focus on improving adjuvant efficacy, reducing environmental impact, and enhancing compatibility with various pesticides. Unique selling propositions include enhanced spray coverage, improved penetration into plant tissues, reduced pesticide drift, and environmentally friendly formulations (e.g., bio-based adjuvants). Technological advancements such as nanotechnology and advanced polymer chemistry are driving the development of next-generation adjuvants with superior performance and reduced environmental footprint.
Key Drivers, Barriers & Challenges in Agricultural Adjuvants Market
Key Drivers:
- Increasing demand for high-yielding crops and efficient crop protection strategies.
- Growing adoption of precision agriculture technologies.
- Government initiatives promoting sustainable agricultural practices.
Key Challenges:
- Stringent regulatory requirements and compliance costs.
- Price fluctuations in raw materials impacting profitability.
- Competition from alternative crop protection methods. The market faces xx% pressure from competition from biological control agents in the forecast period.
Emerging Opportunities in Agricultural Adjuvants Market
- Bio-based adjuvants: Growing consumer preference for environmentally friendly products presents a significant opportunity.
- Smart adjuvants: Integration of sensors and data analytics for optimized adjuvant application.
- Specialized adjuvants: Development of customized adjuvants for specific crops and pesticides.
- Untapped markets: Expansion into emerging economies with growing agricultural sectors.
Growth Accelerators in the Agricultural Adjuvants Market Industry
Technological breakthroughs, strategic partnerships, and market expansion strategies are key growth catalysts. The development of novel adjuvant formulations, such as those incorporating nanotechnology or advanced polymer chemistry, offers substantial potential for market expansion. Strategic alliances between adjuvant manufacturers and pesticide producers enhance market penetration and product development. Geographical expansion into high-growth regions, such as the Asia-Pacific region, offers significant growth prospects.
Key Players Shaping the Agricultural Adjuvants Market Market
- Huntsman Corp
- Nufarm
- Solvay
- Brandt Consolidated Inc
- Garrco Products Inc
- Lamberti SPA
- Helena Chemical Company
- Evonik Industries AG
- Akzonobel NV
- Momentive Performance Materials Inc
- Adjuvant Plus Inc
- Interagro (UK) Ltd
- Wilbur-Ellis Compan
- Croda International PLC
Notable Milestones in Agricultural Adjuvants Market Sector
- 2020: Launch of a new bio-based adjuvant by Croda International PLC.
- 2022: Merger between two leading adjuvant manufacturers resulting in increased market share.
- 2023: Introduction of a new technology enhancing adjuvant efficacy by Huntsman Corp. (Further milestones will be added as data becomes available).
In-Depth Agricultural Adjuvants Market Market Outlook
The agricultural adjuvants market is poised for sustained growth, driven by ongoing technological innovation and increasing demand for high-yielding crops. Strategic opportunities exist in developing environmentally friendly adjuvants, expanding into emerging markets, and leveraging data analytics to optimize adjuvant application. The market's future potential is substantial, particularly in regions experiencing rapid agricultural expansion and modernization. The continued focus on sustainability and precision agriculture will further drive market growth.
Agricultural Adjuvants Market Segmentation
-
1. Type
-
1.1. Activator Adjuvants
- 1.1.1. Surfactants
- 1.1.2. Oil Adjuvants
- 1.2. Utility Adjuvants
-
1.1. Activator Adjuvants
-
2. Application
- 2.1. Herbicide Adjuvants
- 2.2. Insecticide Adjuvants
- 2.3. Fungicide Adjuvants
- 2.4. Other Applications
-
3. Type
-
3.1. Activator Adjuvants
- 3.1.1. Surfactants
- 3.1.2. Oil Adjuvants
- 3.2. Utility Adjuvants
-
3.1. Activator Adjuvants
-
4. Application
- 4.1. Herbicide Adjuvants
- 4.2. Insecticide Adjuvants
- 4.3. Fungicide Adjuvants
- 4.4. Other Applications
Agricultural Adjuvants Market Segmentation By Geography
-
1. North America
- 1.1. United States
- 1.2. Canada
- 1.3. Mexico
- 1.4. Rest of North America
-
2. Europe
- 2.1. Germany
- 2.2. United Kingdom
- 2.3. France
- 2.4. Italy
- 2.5. Russia
- 2.6. Rest of Europe
-
3. Asia Pacific
- 3.1. China
- 3.2. Japan
- 3.3. India
- 3.4. Australia
- 3.5. Rest of Asia Pacific
-
4. South America
- 4.1. Argentina
- 4.2. Brazil
- 4.3. Rest of South America
-
5. Africa
- 5.1. South Africa
- 5.2. Rest of Africa
Agricultural Adjuvants Market Regional Market Share
Geographic Coverage of Agricultural Adjuvants Market
Agricultural Adjuvants Market REPORT HIGHLIGHTS
| Aspects | Details |
|---|---|
| Study Period | 2020-2034 |
| Base Year | 2025 |
| Estimated Year | 2026 |
| Forecast Period | 2026-2034 |
| Historical Period | 2020-2025 |
| Growth Rate | CAGR of 4.70% from 2020-2034 |
| Segmentation |
|
Table of Contents
- 1. Introduction
- 1.1. Research Scope
- 1.2. Market Segmentation
- 1.3. Research Objective
- 1.4. Definitions and Assumptions
- 2. Executive Summary
- 2.1. Market Snapshot
- 3. Market Dynamics
- 3.1. Market Drivers
- 3.2. Market Restrains
- 3.3. Market Trends
- 3.4. Market Opportunities
- 4. Market Factor Analysis
- 4.1. Porters Five Forces
- 4.1.1. Bargaining Power of Suppliers
- 4.1.2. Bargaining Power of Buyers
- 4.1.3. Threat of New Entrants
- 4.1.4. Threat of Substitutes
- 4.1.5. Competitive Rivalry
- 4.2. PESTEL analysis
- 4.3. BCG Analysis
- 4.3.1. Stars (High Growth, High Market Share)
- 4.3.2. Cash Cows (Low Growth, High Market Share)
- 4.3.3. Question Mark (High Growth, Low Market Share)
- 4.3.4. Dogs (Low Growth, Low Market Share)
- 4.4. Ansoff Matrix Analysis
- 4.5. Supply Chain Analysis
- 4.6. Regulatory Landscape
- 4.7. Current Market Potential and Opportunity Assessment (TAM–SAM–SOM Framework)
- 4.8. VDR Analyst Note
- 4.1. Porters Five Forces
- 5. Market Analysis, Insights and Forecast 2021-2033
- 5.1. Market Analysis, Insights and Forecast - by Type
- 5.1.1. Activator Adjuvants
- 5.1.1.1. Surfactants
- 5.1.1.2. Oil Adjuvants
- 5.1.2. Utility Adjuvants
- 5.1.1. Activator Adjuvants
- 5.2. Market Analysis, Insights and Forecast - by Application
- 5.2.1. Herbicide Adjuvants
- 5.2.2. Insecticide Adjuvants
- 5.2.3. Fungicide Adjuvants
- 5.2.4. Other Applications
- 5.3. Market Analysis, Insights and Forecast - by Type
- 5.3.1. Activator Adjuvants
- 5.3.1.1. Surfactants
- 5.3.1.2. Oil Adjuvants
- 5.3.2. Utility Adjuvants
- 5.3.1. Activator Adjuvants
- 5.4. Market Analysis, Insights and Forecast - by Application
- 5.4.1. Herbicide Adjuvants
- 5.4.2. Insecticide Adjuvants
- 5.4.3. Fungicide Adjuvants
- 5.4.4. Other Applications
- 5.5. Market Analysis, Insights and Forecast - by Region
- 5.5.1. North America
- 5.5.2. Europe
- 5.5.3. Asia Pacific
- 5.5.4. South America
- 5.5.5. Africa
- 5.1. Market Analysis, Insights and Forecast - by Type
- 6. Global Agricultural Adjuvants Market Analysis, Insights and Forecast, 2021-2033
- 6.1. Market Analysis, Insights and Forecast - by Type
- 6.1.1. Activator Adjuvants
- 6.1.1.1. Surfactants
- 6.1.1.2. Oil Adjuvants
- 6.1.2. Utility Adjuvants
- 6.1.1. Activator Adjuvants
- 6.2. Market Analysis, Insights and Forecast - by Application
- 6.2.1. Herbicide Adjuvants
- 6.2.2. Insecticide Adjuvants
- 6.2.3. Fungicide Adjuvants
- 6.2.4. Other Applications
- 6.3. Market Analysis, Insights and Forecast - by Type
- 6.3.1. Activator Adjuvants
- 6.3.1.1. Surfactants
- 6.3.1.2. Oil Adjuvants
- 6.3.2. Utility Adjuvants
- 6.3.1. Activator Adjuvants
- 6.4. Market Analysis, Insights and Forecast - by Application
- 6.4.1. Herbicide Adjuvants
- 6.4.2. Insecticide Adjuvants
- 6.4.3. Fungicide Adjuvants
- 6.4.4. Other Applications
- 6.1. Market Analysis, Insights and Forecast - by Type
- 7. North America Agricultural Adjuvants Market Analysis, Insights and Forecast, 2021-2033
- 7.1. Market Analysis, Insights and Forecast - by Type
- 7.1.1. Activator Adjuvants
- 7.1.1.1. Surfactants
- 7.1.1.2. Oil Adjuvants
- 7.1.2. Utility Adjuvants
- 7.1.1. Activator Adjuvants
- 7.2. Market Analysis, Insights and Forecast - by Application
- 7.2.1. Herbicide Adjuvants
- 7.2.2. Insecticide Adjuvants
- 7.2.3. Fungicide Adjuvants
- 7.2.4. Other Applications
- 7.3. Market Analysis, Insights and Forecast - by Type
- 7.3.1. Activator Adjuvants
- 7.3.1.1. Surfactants
- 7.3.1.2. Oil Adjuvants
- 7.3.2. Utility Adjuvants
- 7.3.1. Activator Adjuvants
- 7.4. Market Analysis, Insights and Forecast - by Application
- 7.4.1. Herbicide Adjuvants
- 7.4.2. Insecticide Adjuvants
- 7.4.3. Fungicide Adjuvants
- 7.4.4. Other Applications
- 7.1. Market Analysis, Insights and Forecast - by Type
- 8. Europe Agricultural Adjuvants Market Analysis, Insights and Forecast, 2021-2033
- 8.1. Market Analysis, Insights and Forecast - by Type
- 8.1.1. Activator Adjuvants
- 8.1.1.1. Surfactants
- 8.1.1.2. Oil Adjuvants
- 8.1.2. Utility Adjuvants
- 8.1.1. Activator Adjuvants
- 8.2. Market Analysis, Insights and Forecast - by Application
- 8.2.1. Herbicide Adjuvants
- 8.2.2. Insecticide Adjuvants
- 8.2.3. Fungicide Adjuvants
- 8.2.4. Other Applications
- 8.3. Market Analysis, Insights and Forecast - by Type
- 8.3.1. Activator Adjuvants
- 8.3.1.1. Surfactants
- 8.3.1.2. Oil Adjuvants
- 8.3.2. Utility Adjuvants
- 8.3.1. Activator Adjuvants
- 8.4. Market Analysis, Insights and Forecast - by Application
- 8.4.1. Herbicide Adjuvants
- 8.4.2. Insecticide Adjuvants
- 8.4.3. Fungicide Adjuvants
- 8.4.4. Other Applications
- 8.1. Market Analysis, Insights and Forecast - by Type
- 9. Asia Pacific Agricultural Adjuvants Market Analysis, Insights and Forecast, 2021-2033
- 9.1. Market Analysis, Insights and Forecast - by Type
- 9.1.1. Activator Adjuvants
- 9.1.1.1. Surfactants
- 9.1.1.2. Oil Adjuvants
- 9.1.2. Utility Adjuvants
- 9.1.1. Activator Adjuvants
- 9.2. Market Analysis, Insights and Forecast - by Application
- 9.2.1. Herbicide Adjuvants
- 9.2.2. Insecticide Adjuvants
- 9.2.3. Fungicide Adjuvants
- 9.2.4. Other Applications
- 9.3. Market Analysis, Insights and Forecast - by Type
- 9.3.1. Activator Adjuvants
- 9.3.1.1. Surfactants
- 9.3.1.2. Oil Adjuvants
- 9.3.2. Utility Adjuvants
- 9.3.1. Activator Adjuvants
- 9.4. Market Analysis, Insights and Forecast - by Application
- 9.4.1. Herbicide Adjuvants
- 9.4.2. Insecticide Adjuvants
- 9.4.3. Fungicide Adjuvants
- 9.4.4. Other Applications
- 9.1. Market Analysis, Insights and Forecast - by Type
- 10. South America Agricultural Adjuvants Market Analysis, Insights and Forecast, 2021-2033
- 10.1. Market Analysis, Insights and Forecast - by Type
- 10.1.1. Activator Adjuvants
- 10.1.1.1. Surfactants
- 10.1.1.2. Oil Adjuvants
- 10.1.2. Utility Adjuvants
- 10.1.1. Activator Adjuvants
- 10.2. Market Analysis, Insights and Forecast - by Application
- 10.2.1. Herbicide Adjuvants
- 10.2.2. Insecticide Adjuvants
- 10.2.3. Fungicide Adjuvants
- 10.2.4. Other Applications
- 10.3. Market Analysis, Insights and Forecast - by Type
- 10.3.1. Activator Adjuvants
- 10.3.1.1. Surfactants
- 10.3.1.2. Oil Adjuvants
- 10.3.2. Utility Adjuvants
- 10.3.1. Activator Adjuvants
- 10.4. Market Analysis, Insights and Forecast - by Application
- 10.4.1. Herbicide Adjuvants
- 10.4.2. Insecticide Adjuvants
- 10.4.3. Fungicide Adjuvants
- 10.4.4. Other Applications
- 10.1. Market Analysis, Insights and Forecast - by Type
- 11. Africa Agricultural Adjuvants Market Analysis, Insights and Forecast, 2021-2033
- 11.1. Market Analysis, Insights and Forecast - by Type
- 11.1.1. Activator Adjuvants
- 11.1.1.1. Surfactants
- 11.1.1.2. Oil Adjuvants
- 11.1.2. Utility Adjuvants
- 11.1.1. Activator Adjuvants
- 11.2. Market Analysis, Insights and Forecast - by Application
- 11.2.1. Herbicide Adjuvants
- 11.2.2. Insecticide Adjuvants
- 11.2.3. Fungicide Adjuvants
- 11.2.4. Other Applications
- 11.3. Market Analysis, Insights and Forecast - by Type
- 11.3.1. Activator Adjuvants
- 11.3.1.1. Surfactants
- 11.3.1.2. Oil Adjuvants
- 11.3.2. Utility Adjuvants
- 11.3.1. Activator Adjuvants
- 11.4. Market Analysis, Insights and Forecast - by Application
- 11.4.1. Herbicide Adjuvants
- 11.4.2. Insecticide Adjuvants
- 11.4.3. Fungicide Adjuvants
- 11.4.4. Other Applications
- 11.1. Market Analysis, Insights and Forecast - by Type
- 12. Competitive Analysis
- 12.1. Company Profiles
- 12.1.1 Huntsman Corp
- 12.1.1.1. Company Overview
- 12.1.1.2. Products
- 12.1.1.3. Company Financials
- 12.1.1.4. SWOT Analysis
- 12.1.2 Nufarm
- 12.1.2.1. Company Overview
- 12.1.2.2. Products
- 12.1.2.3. Company Financials
- 12.1.2.4. SWOT Analysis
- 12.1.3 Solvay
- 12.1.3.1. Company Overview
- 12.1.3.2. Products
- 12.1.3.3. Company Financials
- 12.1.3.4. SWOT Analysis
- 12.1.4 Brandt Consolidated Inc
- 12.1.4.1. Company Overview
- 12.1.4.2. Products
- 12.1.4.3. Company Financials
- 12.1.4.4. SWOT Analysis
- 12.1.5 Garrco Products Inc
- 12.1.5.1. Company Overview
- 12.1.5.2. Products
- 12.1.5.3. Company Financials
- 12.1.5.4. SWOT Analysis
- 12.1.6 Lamberti SPA
- 12.1.6.1. Company Overview
- 12.1.6.2. Products
- 12.1.6.3. Company Financials
- 12.1.6.4. SWOT Analysis
- 12.1.7 Helena Chemical Company
- 12.1.7.1. Company Overview
- 12.1.7.2. Products
- 12.1.7.3. Company Financials
- 12.1.7.4. SWOT Analysis
- 12.1.8 Evonik Industries AG
- 12.1.8.1. Company Overview
- 12.1.8.2. Products
- 12.1.8.3. Company Financials
- 12.1.8.4. SWOT Analysis
- 12.1.9 Akzonobel NV
- 12.1.9.1. Company Overview
- 12.1.9.2. Products
- 12.1.9.3. Company Financials
- 12.1.9.4. SWOT Analysis
- 12.1.10 Momentive Performance Materials Inc
- 12.1.10.1. Company Overview
- 12.1.10.2. Products
- 12.1.10.3. Company Financials
- 12.1.10.4. SWOT Analysis
- 12.1.11 Adjuvant Plus Inc
- 12.1.11.1. Company Overview
- 12.1.11.2. Products
- 12.1.11.3. Company Financials
- 12.1.11.4. SWOT Analysis
- 12.1.12 Interagro (UK) Ltd
- 12.1.12.1. Company Overview
- 12.1.12.2. Products
- 12.1.12.3. Company Financials
- 12.1.12.4. SWOT Analysis
- 12.1.13 Wilbur-Ellis Compan
- 12.1.13.1. Company Overview
- 12.1.13.2. Products
- 12.1.13.3. Company Financials
- 12.1.13.4. SWOT Analysis
- 12.1.14 Croda International PLC
- 12.1.14.1. Company Overview
- 12.1.14.2. Products
- 12.1.14.3. Company Financials
- 12.1.14.4. SWOT Analysis
- 12.1.1 Huntsman Corp
- 12.2. Market Entropy
- 12.2.1 Company's Key Areas Served
- 12.2.2 Recent Developments
- 12.3. Company Market Share Analysis 2025
- 12.3.1 Top 5 Companies Market Share Analysis
- 12.3.2 Top 3 Companies Market Share Analysis
- 12.4. List of Potential Customers
- 13. Research Methodology
List of Figures
- Figure 1: Global Agricultural Adjuvants Market Revenue Breakdown (Million, %) by Region 2025 & 2033
- Figure 2: North America Agricultural Adjuvants Market Revenue (Million), by Type 2025 & 2033
- Figure 3: North America Agricultural Adjuvants Market Revenue Share (%), by Type 2025 & 2033
- Figure 4: North America Agricultural Adjuvants Market Revenue (Million), by Application 2025 & 2033
- Figure 5: North America Agricultural Adjuvants Market Revenue Share (%), by Application 2025 & 2033
- Figure 6: North America Agricultural Adjuvants Market Revenue (Million), by Type 2025 & 2033
- Figure 7: North America Agricultural Adjuvants Market Revenue Share (%), by Type 2025 & 2033
- Figure 8: North America Agricultural Adjuvants Market Revenue (Million), by Application 2025 & 2033
- Figure 9: North America Agricultural Adjuvants Market Revenue Share (%), by Application 2025 & 2033
- Figure 10: North America Agricultural Adjuvants Market Revenue (Million), by Country 2025 & 2033
- Figure 11: North America Agricultural Adjuvants Market Revenue Share (%), by Country 2025 & 2033
- Figure 12: Europe Agricultural Adjuvants Market Revenue (Million), by Type 2025 & 2033
- Figure 13: Europe Agricultural Adjuvants Market Revenue Share (%), by Type 2025 & 2033
- Figure 14: Europe Agricultural Adjuvants Market Revenue (Million), by Application 2025 & 2033
- Figure 15: Europe Agricultural Adjuvants Market Revenue Share (%), by Application 2025 & 2033
- Figure 16: Europe Agricultural Adjuvants Market Revenue (Million), by Type 2025 & 2033
- Figure 17: Europe Agricultural Adjuvants Market Revenue Share (%), by Type 2025 & 2033
- Figure 18: Europe Agricultural Adjuvants Market Revenue (Million), by Application 2025 & 2033
- Figure 19: Europe Agricultural Adjuvants Market Revenue Share (%), by Application 2025 & 2033
- Figure 20: Europe Agricultural Adjuvants Market Revenue (Million), by Country 2025 & 2033
- Figure 21: Europe Agricultural Adjuvants Market Revenue Share (%), by Country 2025 & 2033
- Figure 22: Asia Pacific Agricultural Adjuvants Market Revenue (Million), by Type 2025 & 2033
- Figure 23: Asia Pacific Agricultural Adjuvants Market Revenue Share (%), by Type 2025 & 2033
- Figure 24: Asia Pacific Agricultural Adjuvants Market Revenue (Million), by Application 2025 & 2033
- Figure 25: Asia Pacific Agricultural Adjuvants Market Revenue Share (%), by Application 2025 & 2033
- Figure 26: Asia Pacific Agricultural Adjuvants Market Revenue (Million), by Type 2025 & 2033
- Figure 27: Asia Pacific Agricultural Adjuvants Market Revenue Share (%), by Type 2025 & 2033
- Figure 28: Asia Pacific Agricultural Adjuvants Market Revenue (Million), by Application 2025 & 2033
- Figure 29: Asia Pacific Agricultural Adjuvants Market Revenue Share (%), by Application 2025 & 2033
- Figure 30: Asia Pacific Agricultural Adjuvants Market Revenue (Million), by Country 2025 & 2033
- Figure 31: Asia Pacific Agricultural Adjuvants Market Revenue Share (%), by Country 2025 & 2033
- Figure 32: South America Agricultural Adjuvants Market Revenue (Million), by Type 2025 & 2033
- Figure 33: South America Agricultural Adjuvants Market Revenue Share (%), by Type 2025 & 2033
- Figure 34: South America Agricultural Adjuvants Market Revenue (Million), by Application 2025 & 2033
- Figure 35: South America Agricultural Adjuvants Market Revenue Share (%), by Application 2025 & 2033
- Figure 36: South America Agricultural Adjuvants Market Revenue (Million), by Type 2025 & 2033
- Figure 37: South America Agricultural Adjuvants Market Revenue Share (%), by Type 2025 & 2033
- Figure 38: South America Agricultural Adjuvants Market Revenue (Million), by Application 2025 & 2033
- Figure 39: South America Agricultural Adjuvants Market Revenue Share (%), by Application 2025 & 2033
- Figure 40: South America Agricultural Adjuvants Market Revenue (Million), by Country 2025 & 2033
- Figure 41: South America Agricultural Adjuvants Market Revenue Share (%), by Country 2025 & 2033
- Figure 42: Africa Agricultural Adjuvants Market Revenue (Million), by Type 2025 & 2033
- Figure 43: Africa Agricultural Adjuvants Market Revenue Share (%), by Type 2025 & 2033
- Figure 44: Africa Agricultural Adjuvants Market Revenue (Million), by Application 2025 & 2033
- Figure 45: Africa Agricultural Adjuvants Market Revenue Share (%), by Application 2025 & 2033
- Figure 46: Africa Agricultural Adjuvants Market Revenue (Million), by Type 2025 & 2033
- Figure 47: Africa Agricultural Adjuvants Market Revenue Share (%), by Type 2025 & 2033
- Figure 48: Africa Agricultural Adjuvants Market Revenue (Million), by Application 2025 & 2033
- Figure 49: Africa Agricultural Adjuvants Market Revenue Share (%), by Application 2025 & 2033
- Figure 50: Africa Agricultural Adjuvants Market Revenue (Million), by Country 2025 & 2033
- Figure 51: Africa Agricultural Adjuvants Market Revenue Share (%), by Country 2025 & 2033
List of Tables
- Table 1: Global Agricultural Adjuvants Market Revenue Million Forecast, by Type 2020 & 2033
- Table 2: Global Agricultural Adjuvants Market Revenue Million Forecast, by Application 2020 & 2033
- Table 3: Global Agricultural Adjuvants Market Revenue Million Forecast, by Type 2020 & 2033
- Table 4: Global Agricultural Adjuvants Market Revenue Million Forecast, by Application 2020 & 2033
- Table 5: Global Agricultural Adjuvants Market Revenue Million Forecast, by Region 2020 & 2033
- Table 6: Global Agricultural Adjuvants Market Revenue Million Forecast, by Type 2020 & 2033
- Table 7: Global Agricultural Adjuvants Market Revenue Million Forecast, by Application 2020 & 2033
- Table 8: Global Agricultural Adjuvants Market Revenue Million Forecast, by Type 2020 & 2033
- Table 9: Global Agricultural Adjuvants Market Revenue Million Forecast, by Application 2020 & 2033
- Table 10: Global Agricultural Adjuvants Market Revenue Million Forecast, by Country 2020 & 2033
- Table 11: United States Agricultural Adjuvants Market Revenue (Million) Forecast, by Application 2020 & 2033
- Table 12: Canada Agricultural Adjuvants Market Revenue (Million) Forecast, by Application 2020 & 2033
- Table 13: Mexico Agricultural Adjuvants Market Revenue (Million) Forecast, by Application 2020 & 2033
- Table 14: Rest of North America Agricultural Adjuvants Market Revenue (Million) Forecast, by Application 2020 & 2033
- Table 15: Global Agricultural Adjuvants Market Revenue Million Forecast, by Type 2020 & 2033
- Table 16: Global Agricultural Adjuvants Market Revenue Million Forecast, by Application 2020 & 2033
- Table 17: Global Agricultural Adjuvants Market Revenue Million Forecast, by Type 2020 & 2033
- Table 18: Global Agricultural Adjuvants Market Revenue Million Forecast, by Application 2020 & 2033
- Table 19: Global Agricultural Adjuvants Market Revenue Million Forecast, by Country 2020 & 2033
- Table 20: Germany Agricultural Adjuvants Market Revenue (Million) Forecast, by Application 2020 & 2033
- Table 21: United Kingdom Agricultural Adjuvants Market Revenue (Million) Forecast, by Application 2020 & 2033
- Table 22: France Agricultural Adjuvants Market Revenue (Million) Forecast, by Application 2020 & 2033
- Table 23: Italy Agricultural Adjuvants Market Revenue (Million) Forecast, by Application 2020 & 2033
- Table 24: Russia Agricultural Adjuvants Market Revenue (Million) Forecast, by Application 2020 & 2033
- Table 25: Rest of Europe Agricultural Adjuvants Market Revenue (Million) Forecast, by Application 2020 & 2033
- Table 26: Global Agricultural Adjuvants Market Revenue Million Forecast, by Type 2020 & 2033
- Table 27: Global Agricultural Adjuvants Market Revenue Million Forecast, by Application 2020 & 2033
- Table 28: Global Agricultural Adjuvants Market Revenue Million Forecast, by Type 2020 & 2033
- Table 29: Global Agricultural Adjuvants Market Revenue Million Forecast, by Application 2020 & 2033
- Table 30: Global Agricultural Adjuvants Market Revenue Million Forecast, by Country 2020 & 2033
- Table 31: China Agricultural Adjuvants Market Revenue (Million) Forecast, by Application 2020 & 2033
- Table 32: Japan Agricultural Adjuvants Market Revenue (Million) Forecast, by Application 2020 & 2033
- Table 33: India Agricultural Adjuvants Market Revenue (Million) Forecast, by Application 2020 & 2033
- Table 34: Australia Agricultural Adjuvants Market Revenue (Million) Forecast, by Application 2020 & 2033
- Table 35: Rest of Asia Pacific Agricultural Adjuvants Market Revenue (Million) Forecast, by Application 2020 & 2033
- Table 36: Global Agricultural Adjuvants Market Revenue Million Forecast, by Type 2020 & 2033
- Table 37: Global Agricultural Adjuvants Market Revenue Million Forecast, by Application 2020 & 2033
- Table 38: Global Agricultural Adjuvants Market Revenue Million Forecast, by Type 2020 & 2033
- Table 39: Global Agricultural Adjuvants Market Revenue Million Forecast, by Application 2020 & 2033
- Table 40: Global Agricultural Adjuvants Market Revenue Million Forecast, by Country 2020 & 2033
- Table 41: Argentina Agricultural Adjuvants Market Revenue (Million) Forecast, by Application 2020 & 2033
- Table 42: Brazil Agricultural Adjuvants Market Revenue (Million) Forecast, by Application 2020 & 2033
- Table 43: Rest of South America Agricultural Adjuvants Market Revenue (Million) Forecast, by Application 2020 & 2033
- Table 44: Global Agricultural Adjuvants Market Revenue Million Forecast, by Type 2020 & 2033
- Table 45: Global Agricultural Adjuvants Market Revenue Million Forecast, by Application 2020 & 2033
- Table 46: Global Agricultural Adjuvants Market Revenue Million Forecast, by Type 2020 & 2033
- Table 47: Global Agricultural Adjuvants Market Revenue Million Forecast, by Application 2020 & 2033
- Table 48: Global Agricultural Adjuvants Market Revenue Million Forecast, by Country 2020 & 2033
- Table 49: South Africa Agricultural Adjuvants Market Revenue (Million) Forecast, by Application 2020 & 2033
- Table 50: Rest of Africa Agricultural Adjuvants Market Revenue (Million) Forecast, by Application 2020 & 2033
Frequently Asked Questions
1. What is the projected Compound Annual Growth Rate (CAGR) of the Agricultural Adjuvants Market?
The projected CAGR is approximately 4.70%.
2. Which companies are prominent players in the Agricultural Adjuvants Market?
Key companies in the market include Huntsman Corp, Nufarm, Solvay, Brandt Consolidated Inc, Garrco Products Inc, Lamberti SPA, Helena Chemical Company, Evonik Industries AG, Akzonobel NV, Momentive Performance Materials Inc, Adjuvant Plus Inc, Interagro (UK) Ltd, Wilbur-Ellis Compan, Croda International PLC.
3. What are the main segments of the Agricultural Adjuvants Market?
The market segments include Type, Application, Type, Application.
4. Can you provide details about the market size?
The market size is estimated to be USD 2.24 Million as of 2022.
5. What are some drivers contributing to market growth?
Seed Treatment As A Solution To Enhance Yield; Growing Awareness For Seed Treatment Among The Farmers; Rising Trend Of Organic Farming.
6. What are the notable trends driving market growth?
Growing Food Demand and Decrease in Arable Land Driving the Market.
7. Are there any restraints impacting market growth?
Limitations Across Farm-Level Seed Treatment; Rising Environmental Concerns.
8. Can you provide examples of recent developments in the market?
N/A
9. What pricing options are available for accessing the report?
Pricing options include single-user, multi-user, and enterprise licenses priced at USD 4750, USD 5250, and USD 8750 respectively.
10. Is the market size provided in terms of value or volume?
The market size is provided in terms of value, measured in Million.
11. Are there any specific market keywords associated with the report?
Yes, the market keyword associated with the report is "Agricultural Adjuvants Market," which aids in identifying and referencing the specific market segment covered.
12. How do I determine which pricing option suits my needs best?
The pricing options vary based on user requirements and access needs. Individual users may opt for single-user licenses, while businesses requiring broader access may choose multi-user or enterprise licenses for cost-effective access to the report.
13. Are there any additional resources or data provided in the Agricultural Adjuvants Market report?
While the report offers comprehensive insights, it's advisable to review the specific contents or supplementary materials provided to ascertain if additional resources or data are available.
14. How can I stay updated on further developments or reports in the Agricultural Adjuvants Market?
To stay informed about further developments, trends, and reports in the Agricultural Adjuvants Market, consider subscribing to industry newsletters, following relevant companies and organizations, or regularly checking reputable industry news sources and publications.
Methodology
Step 1 - Identification of Relevant Samples Size from Population Database


Step 2 - Approaches for Defining Global Market Size (Value, Volume* & Price*)

Note*: In applicable scenarios
Step 3 - Data Sources
Primary Research
- Web Analytics
- Survey Reports
- Research Institute
- Latest Research Reports
- Opinion Leaders
Secondary Research
- Annual Reports
- White Paper
- Latest Press Release
- Industry Association
- Paid Database
- Investor Presentations

Step 4 - Data Triangulation
Involves using different sources of information in order to increase the validity of a study
These sources are likely to be stakeholders in a program - participants, other researchers, program staff, other community members, and so on.
Then we put all data in single framework & apply various statistical tools to find out the dynamic on the market.
During the analysis stage, feedback from the stakeholder groups would be compared to determine areas of agreement as well as areas of divergence