

Key Insights
The African natural gas market is experiencing robust growth, projected to maintain a Compound Annual Growth Rate (CAGR) exceeding 4.50% from 2025 to 2033. This expansion is driven by several key factors. Firstly, increasing power generation demands across the continent are fueling significant investment in gas-fired power plants, particularly in regions with limited access to reliable electricity. Secondly, the industrial sector's growing energy needs, coupled with the relative affordability and cleaner-burning nature of natural gas compared to traditional fuels like coal, are driving adoption. Finally, government initiatives promoting energy diversification and energy access initiatives are creating a favorable regulatory environment for natural gas development. South Africa, Sudan, Uganda, Tanzania, and Kenya are key regional players, while Nigeria, Algeria (through Sonatrach), and Egypt are major producers significantly impacting overall market dynamics. The market is segmented by geography (North, West, Central, East, and Southern Africa), end-user (power generation, industrial, residential), and company size (large, medium, small), allowing for a granular understanding of market opportunities. Major players like Shell, TotalEnergies, Eni, and several national oil companies are actively shaping the landscape through exploration, production, and infrastructure development.
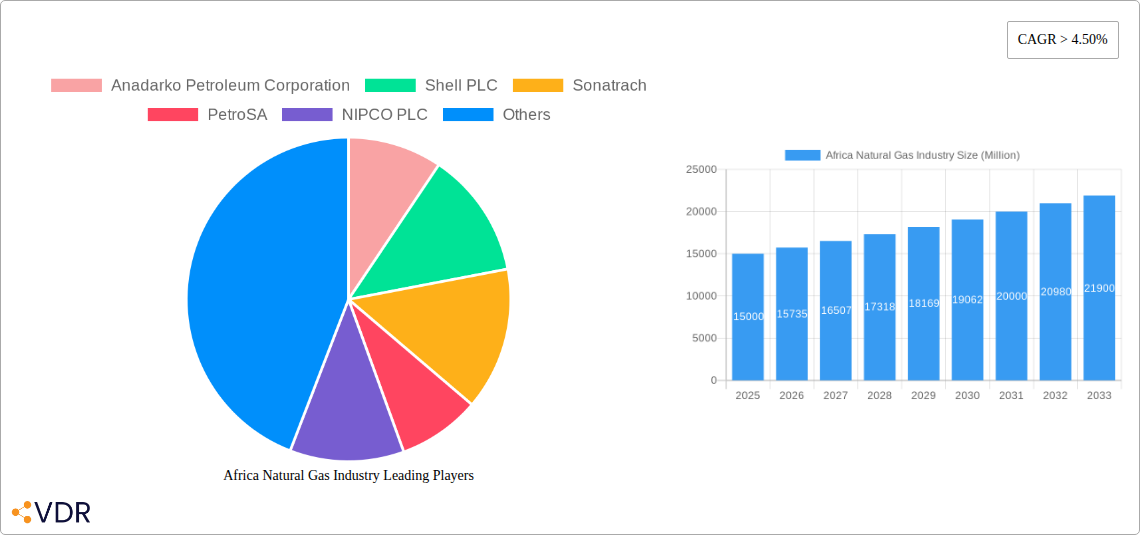
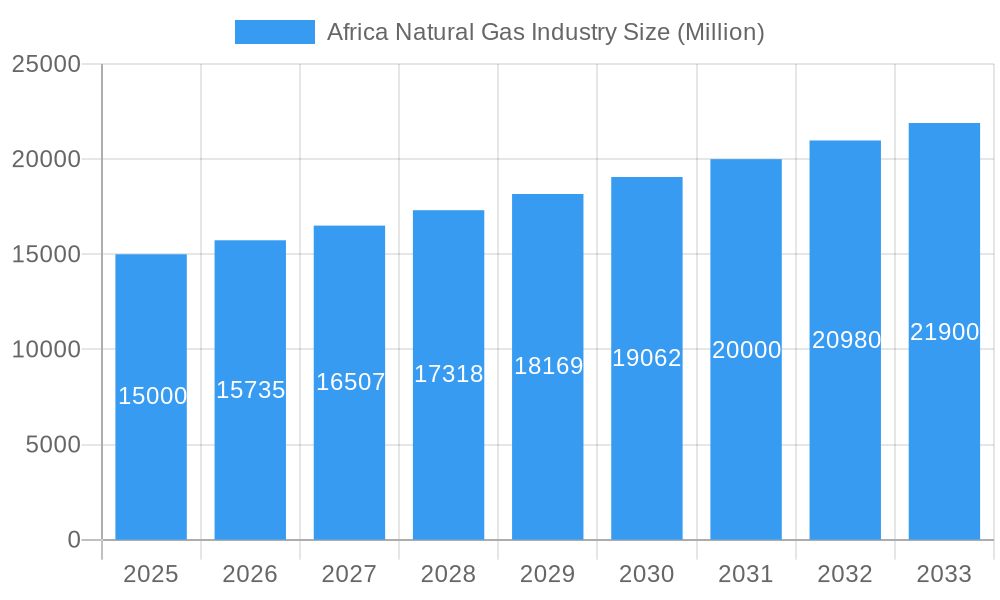
Africa Natural Gas Industry Market Size (In Billion)
However, the market faces certain challenges. Infrastructure limitations, particularly in transporting natural gas across vast distances, hinder expansion in some regions. Political instability and regulatory uncertainties in certain African nations can also impact investment decisions and project timelines. Furthermore, competition from renewable energy sources, while still relatively nascent in Africa, presents a long-term challenge to the sustained dominance of natural gas. Despite these restraints, the overall outlook remains positive, indicating a promising future for the African natural gas industry, especially with continued investments in infrastructure and a supportive regulatory framework. Further growth is expected particularly in countries with abundant natural gas reserves and a strong focus on industrialization.
Africa Natural Gas Industry Company Market Share
Africa Natural Gas Industry: A Comprehensive Market Report (2019-2033)
This in-depth report provides a comprehensive analysis of the African natural gas industry, encompassing market dynamics, growth trends, key players, and future outlook. With a focus on the historical period (2019-2024), base year (2025), and forecast period (2025-2033), this report is an essential resource for industry professionals, investors, and policymakers seeking to understand this dynamic and rapidly evolving market. The report segments the market by geography (North Africa, West Africa, Central Africa, East Africa, Southern Africa), end-user (power generation, industrial, residential), and company size (large, medium, small).
Africa Natural Gas Industry Market Dynamics & Structure
This section analyzes the competitive landscape, technological advancements, regulatory environment, and market trends influencing the African natural gas industry. We delve into market concentration, assessing the market share of key players like Shell PLC, TotalEnergies SE, Eni SpA, and Sonatrach. The report also examines the impact of mergers and acquisitions (M&A) activities, estimating a total M&A deal volume of xx Million in the historical period.
- Market Concentration: The market exhibits a moderately concentrated structure, with a few dominant players holding significant market share, while numerous smaller players compete in specific niche segments.
- Technological Innovation: Drivers include exploration and production technologies to enhance efficiency and reduce costs. Barriers include the lack of infrastructure, skills gap, and technological transfer challenges.
- Regulatory Frameworks: Vary considerably across African nations, impacting investment decisions and project development timelines. Harmonization of regulations and streamlining of approval processes are crucial.
- Competitive Product Substitutes: Renewable energy sources present a significant competitive pressure, particularly in power generation and industrial segments.
- End-User Demographics: Rapid population growth and increasing urbanization are driving demand for natural gas across all end-use sectors.
- M&A Trends: The number of M&A deals increased by xx% from 2021 to 2022, primarily driven by expansion strategies and consolidation within the industry.
Africa Natural Gas Industry Growth Trends & Insights
This section provides a detailed analysis of the market size evolution, adoption rates, technological disruptions, and consumer behavior shifts within the African natural gas industry, leveraging proprietary data and publicly available information. The report projects a Compound Annual Growth Rate (CAGR) of xx% from 2025 to 2033, driven by increased energy demand and infrastructure development. Market penetration is anticipated to reach xx% by 2033. The analysis covers the impact of factors such as government policies promoting gas development, fluctuating global gas prices, and advancements in gas processing technologies.
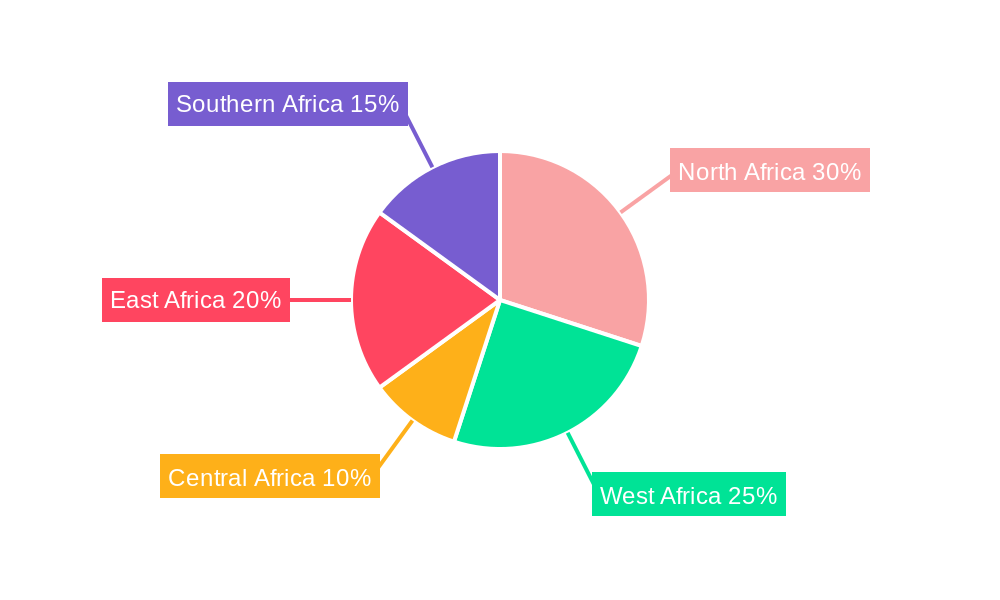
Dominant Regions, Countries, or Segments in Africa Natural Gas Industry
This section identifies the leading regions, countries, and segments driving market growth. North Africa currently holds the largest market share, driven by significant reserves and established infrastructure. However, West Africa shows immense growth potential due to ongoing exploration activities and increased investment in gas infrastructure projects, like the Nigeria-Morocco gas pipeline.
- North Africa: Strong existing infrastructure, significant gas reserves, and established export routes contribute to dominance.
- West Africa: Significant untapped reserves and the Nigeria-Morocco pipeline project are key drivers.
- Power Generation: Remains the largest end-use segment, accounting for xx% of total consumption.
- Large Companies: Large players dominate the upstream and midstream segments due to high capital investment requirements.
Africa Natural Gas Industry Product Landscape
The African natural gas industry's product landscape consists primarily of natural gas in its various forms, including pipeline gas, liquefied natural gas (LNG), and compressed natural gas (CNG). Ongoing innovations focus on improving efficiency in gas processing and transportation. The development of new gas fields and improvement in pipelines infrastructure is shaping the product landscape.
Key Drivers, Barriers & Challenges in Africa Natural Gas Industry
Key Drivers: Increased energy demand, government support for gas development, significant gas reserves, and the emergence of new export opportunities.
Challenges: Lack of infrastructure, high upfront investment costs, regulatory hurdles, security concerns, and volatile global gas prices. The impact of these challenges can be estimated in terms of delays in project implementation, increased project costs, and reduction in overall market growth. The report quantifies these impacts through specific examples.
Emerging Opportunities in Africa Natural Gas Industry
Emerging opportunities include the development of smaller-scale LNG projects to supply remote areas, increasing investment in gas-to-power projects to increase electricity access, and the utilization of natural gas as a transition fuel towards a lower-carbon energy future.
Growth Accelerators in the Africa Natural Gas Industry Industry
Long-term growth will be accelerated by strategic partnerships between international and national companies, technological breakthroughs in gas exploration and production, and increased regional cooperation in infrastructure development. This will lead to increased exploration, improved efficiency and more efficient infrastructure.
Key Players Shaping the Africa Natural Gas Industry Market
- Anadarko Petroleum Corporation
- Shell PLC
- Sonatrach
- PetroSA
- NIPCO PLC
- TotalEnergies SE
- Egyptian Natural Gas Holding Company
- Eni SpA
- Nigerian National Petroleum Corporation
- Chevron Corporation
Notable Milestones in Africa Natural Gas Industry Sector
- September 2022: Announcement of the Nigeria-Morocco gas pipeline project, potentially transforming West African gas supply dynamics.
- May 2022: Sonatrach and Eni MoU to accelerate Algerian gas field development, boosting export capacity.
In-Depth Africa Natural Gas Industry Market Outlook
The future of the African natural gas industry looks promising, with substantial growth potential driven by increased energy demand, ongoing exploration activities, and the development of crucial infrastructure projects. Strategic partnerships and technological advancements will play a pivotal role in unlocking the region's vast natural gas resources and fostering sustainable economic development. The market is poised for significant expansion, presenting numerous opportunities for investors and industry participants alike.
Africa Natural Gas Industry Segmentation
-
1. Geography
- 1.1. Nigeria
- 1.2. Algeria
- 1.3. Egypt
- 1.4. South Africa
- 1.5. Rest of Africa
Africa Natural Gas Industry Segmentation By Geography
- 1. Nigeria
- 2. Algeria
- 3. Egypt
- 4. South Africa
- 5. Rest of Africa
Africa Natural Gas Industry Regional Market Share
Geographic Coverage of Africa Natural Gas Industry
Africa Natural Gas Industry REPORT HIGHLIGHTS
| Aspects | Details |
|---|---|
| Study Period | 2020-2034 |
| Base Year | 2025 |
| Estimated Year | 2026 |
| Forecast Period | 2026-2034 |
| Historical Period | 2020-2025 |
| Growth Rate | CAGR of > 4.50% from 2020-2034 |
| Segmentation |
|
Table of Contents
- 1. Introduction
- 1.1. Research Scope
- 1.2. Market Segmentation
- 1.3. Research Objective
- 1.4. Definitions and Assumptions
- 2. Executive Summary
- 2.1. Market Snapshot
- 3. Market Dynamics
- 3.1. Market Drivers
- 3.2. Market Restrains
- 3.3. Market Trends
- 3.4. Market Opportunities
- 4. Market Factor Analysis
- 4.1. Porters Five Forces
- 4.1.1. Bargaining Power of Suppliers
- 4.1.2. Bargaining Power of Buyers
- 4.1.3. Threat of New Entrants
- 4.1.4. Threat of Substitutes
- 4.1.5. Competitive Rivalry
- 4.2. PESTEL analysis
- 4.3. BCG Analysis
- 4.3.1. Stars (High Growth, High Market Share)
- 4.3.2. Cash Cows (Low Growth, High Market Share)
- 4.3.3. Question Mark (High Growth, Low Market Share)
- 4.3.4. Dogs (Low Growth, Low Market Share)
- 4.4. Ansoff Matrix Analysis
- 4.5. Supply Chain Analysis
- 4.6. Regulatory Landscape
- 4.7. Current Market Potential and Opportunity Assessment (TAM–SAM–SOM Framework)
- 4.8. VDR Analyst Note
- 4.1. Porters Five Forces
- 5. Market Analysis, Insights and Forecast 2021-2033
- 5.1. Market Analysis, Insights and Forecast - by Geography
- 5.1.1. Nigeria
- 5.1.2. Algeria
- 5.1.3. Egypt
- 5.1.4. South Africa
- 5.1.5. Rest of Africa
- 5.2. Market Analysis, Insights and Forecast - by Region
- 5.2.1. Nigeria
- 5.2.2. Algeria
- 5.2.3. Egypt
- 5.2.4. South Africa
- 5.2.5. Rest of Africa
- 5.1. Market Analysis, Insights and Forecast - by Geography
- 6. Africa Natural Gas Industry Analysis, Insights and Forecast, 2021-2033
- 6.1. Market Analysis, Insights and Forecast - by Geography
- 6.1.1. Nigeria
- 6.1.2. Algeria
- 6.1.3. Egypt
- 6.1.4. South Africa
- 6.1.5. Rest of Africa
- 6.1. Market Analysis, Insights and Forecast - by Geography
- 7. Nigeria Africa Natural Gas Industry Analysis, Insights and Forecast, 2021-2033
- 7.1. Market Analysis, Insights and Forecast - by Geography
- 7.1.1. Nigeria
- 7.1.2. Algeria
- 7.1.3. Egypt
- 7.1.4. South Africa
- 7.1.5. Rest of Africa
- 7.1. Market Analysis, Insights and Forecast - by Geography
- 8. Algeria Africa Natural Gas Industry Analysis, Insights and Forecast, 2021-2033
- 8.1. Market Analysis, Insights and Forecast - by Geography
- 8.1.1. Nigeria
- 8.1.2. Algeria
- 8.1.3. Egypt
- 8.1.4. South Africa
- 8.1.5. Rest of Africa
- 8.1. Market Analysis, Insights and Forecast - by Geography
- 9. Egypt Africa Natural Gas Industry Analysis, Insights and Forecast, 2021-2033
- 9.1. Market Analysis, Insights and Forecast - by Geography
- 9.1.1. Nigeria
- 9.1.2. Algeria
- 9.1.3. Egypt
- 9.1.4. South Africa
- 9.1.5. Rest of Africa
- 9.1. Market Analysis, Insights and Forecast - by Geography
- 10. South Africa Africa Natural Gas Industry Analysis, Insights and Forecast, 2021-2033
- 10.1. Market Analysis, Insights and Forecast - by Geography
- 10.1.1. Nigeria
- 10.1.2. Algeria
- 10.1.3. Egypt
- 10.1.4. South Africa
- 10.1.5. Rest of Africa
- 10.1. Market Analysis, Insights and Forecast - by Geography
- 11. Rest of Africa Africa Natural Gas Industry Analysis, Insights and Forecast, 2021-2033
- 11.1. Market Analysis, Insights and Forecast - by Geography
- 11.1.1. Nigeria
- 11.1.2. Algeria
- 11.1.3. Egypt
- 11.1.4. South Africa
- 11.1.5. Rest of Africa
- 11.1. Market Analysis, Insights and Forecast - by Geography
- 12. Competitive Analysis
- 12.1. Company Profiles
- 12.1.1 Anadarko Petroleum Corporation
- 12.1.1.1. Company Overview
- 12.1.1.2. Products
- 12.1.1.3. Company Financials
- 12.1.1.4. SWOT Analysis
- 12.1.2 Shell PLC
- 12.1.2.1. Company Overview
- 12.1.2.2. Products
- 12.1.2.3. Company Financials
- 12.1.2.4. SWOT Analysis
- 12.1.3 Sonatrach
- 12.1.3.1. Company Overview
- 12.1.3.2. Products
- 12.1.3.3. Company Financials
- 12.1.3.4. SWOT Analysis
- 12.1.4 PetroSA
- 12.1.4.1. Company Overview
- 12.1.4.2. Products
- 12.1.4.3. Company Financials
- 12.1.4.4. SWOT Analysis
- 12.1.5 NIPCO PLC
- 12.1.5.1. Company Overview
- 12.1.5.2. Products
- 12.1.5.3. Company Financials
- 12.1.5.4. SWOT Analysis
- 12.1.6 TotalEnergies SE
- 12.1.6.1. Company Overview
- 12.1.6.2. Products
- 12.1.6.3. Company Financials
- 12.1.6.4. SWOT Analysis
- 12.1.7 Egyptian Natural Gas Holding Company
- 12.1.7.1. Company Overview
- 12.1.7.2. Products
- 12.1.7.3. Company Financials
- 12.1.7.4. SWOT Analysis
- 12.1.8 Eni SpA
- 12.1.8.1. Company Overview
- 12.1.8.2. Products
- 12.1.8.3. Company Financials
- 12.1.8.4. SWOT Analysis
- 12.1.9 Nigerian National Petroleum Corporation
- 12.1.9.1. Company Overview
- 12.1.9.2. Products
- 12.1.9.3. Company Financials
- 12.1.9.4. SWOT Analysis
- 12.1.10 Chevron Corporation
- 12.1.10.1. Company Overview
- 12.1.10.2. Products
- 12.1.10.3. Company Financials
- 12.1.10.4. SWOT Analysis
- 12.1.1 Anadarko Petroleum Corporation
- 12.2. Market Entropy
- 12.2.1 Company's Key Areas Served
- 12.2.2 Recent Developments
- 12.3. Company Market Share Analysis 2025
- 12.3.1 Top 5 Companies Market Share Analysis
- 12.3.2 Top 3 Companies Market Share Analysis
- 12.4. List of Potential Customers
- 13. Research Methodology
List of Figures
- Figure 1: Africa Natural Gas Industry Revenue Breakdown (Million, %) by Product 2025 & 2033
- Figure 2: Africa Natural Gas Industry Share (%) by Company 2025
List of Tables
- Table 1: Africa Natural Gas Industry Revenue Million Forecast, by Geography 2020 & 2033
- Table 2: Africa Natural Gas Industry Volume Tonnes Forecast, by Geography 2020 & 2033
- Table 3: Africa Natural Gas Industry Revenue Million Forecast, by Region 2020 & 2033
- Table 4: Africa Natural Gas Industry Volume Tonnes Forecast, by Region 2020 & 2033
- Table 5: Africa Natural Gas Industry Revenue Million Forecast, by Geography 2020 & 2033
- Table 6: Africa Natural Gas Industry Volume Tonnes Forecast, by Geography 2020 & 2033
- Table 7: Africa Natural Gas Industry Revenue Million Forecast, by Country 2020 & 2033
- Table 8: Africa Natural Gas Industry Volume Tonnes Forecast, by Country 2020 & 2033
- Table 9: Africa Natural Gas Industry Revenue Million Forecast, by Geography 2020 & 2033
- Table 10: Africa Natural Gas Industry Volume Tonnes Forecast, by Geography 2020 & 2033
- Table 11: Africa Natural Gas Industry Revenue Million Forecast, by Country 2020 & 2033
- Table 12: Africa Natural Gas Industry Volume Tonnes Forecast, by Country 2020 & 2033
- Table 13: Africa Natural Gas Industry Revenue Million Forecast, by Geography 2020 & 2033
- Table 14: Africa Natural Gas Industry Volume Tonnes Forecast, by Geography 2020 & 2033
- Table 15: Africa Natural Gas Industry Revenue Million Forecast, by Country 2020 & 2033
- Table 16: Africa Natural Gas Industry Volume Tonnes Forecast, by Country 2020 & 2033
- Table 17: Africa Natural Gas Industry Revenue Million Forecast, by Geography 2020 & 2033
- Table 18: Africa Natural Gas Industry Volume Tonnes Forecast, by Geography 2020 & 2033
- Table 19: Africa Natural Gas Industry Revenue Million Forecast, by Country 2020 & 2033
- Table 20: Africa Natural Gas Industry Volume Tonnes Forecast, by Country 2020 & 2033
- Table 21: Africa Natural Gas Industry Revenue Million Forecast, by Geography 2020 & 2033
- Table 22: Africa Natural Gas Industry Volume Tonnes Forecast, by Geography 2020 & 2033
- Table 23: Africa Natural Gas Industry Revenue Million Forecast, by Country 2020 & 2033
- Table 24: Africa Natural Gas Industry Volume Tonnes Forecast, by Country 2020 & 2033
Frequently Asked Questions
1. What is the projected Compound Annual Growth Rate (CAGR) of the Africa Natural Gas Industry?
The projected CAGR is approximately > 4.50%.
2. Which companies are prominent players in the Africa Natural Gas Industry?
Key companies in the market include Anadarko Petroleum Corporation, Shell PLC, Sonatrach, PetroSA, NIPCO PLC, TotalEnergies SE, Egyptian Natural Gas Holding Company, Eni SpA, Nigerian National Petroleum Corporation, Chevron Corporation.
3. What are the main segments of the Africa Natural Gas Industry?
The market segments include Geography.
4. Can you provide details about the market size?
The market size is estimated to be USD XX Million as of 2022.
5. What are some drivers contributing to market growth?
4.; Increasing Amount of Waste Generation. Growing Concern for Waste Management to Meet the Needs for Sustainable Urban Living4.; Increasing Focus on Non-fossil Fuel Sources of Energy.
6. What are the notable trends driving market growth?
Governments Moving Towards the Cleaner Energy Sources is Driving the Market.
7. Are there any restraints impacting market growth?
4.; Expensive Nature of Incinerators.
8. Can you provide examples of recent developments in the market?
In September 2022, The Nigerian National Petroleum Company Limited (NNPCL) announced its intention to sign a Memorandum of Understanding (MoU) on developing a gas pipeline with Morocco's National Office of Hydrocarbons and Mines and the commission of the Economic Community of West African States (ECOWAS). As a result of the MoU, the 7,000-kilometre Nigeria-Morocco gas pipeline project is expected to ramp up gas supply to Europe. Upon the project completion, 3 billion standard cubic feet of gas is expected to be supplied along the coast of West Africa from Nigeria, Benin, Togo, Ghana, Cote d'Ivoire, Liberia, Sierra Leone, Guinea, Guinea Bissau, Gambia, Senegal, Mauritania to Morocco.
9. What pricing options are available for accessing the report?
Pricing options include single-user, multi-user, and enterprise licenses priced at USD 4750, USD 5250, and USD 8750 respectively.
10. Is the market size provided in terms of value or volume?
The market size is provided in terms of value, measured in Million and volume, measured in Tonnes.
11. Are there any specific market keywords associated with the report?
Yes, the market keyword associated with the report is "Africa Natural Gas Industry," which aids in identifying and referencing the specific market segment covered.
12. How do I determine which pricing option suits my needs best?
The pricing options vary based on user requirements and access needs. Individual users may opt for single-user licenses, while businesses requiring broader access may choose multi-user or enterprise licenses for cost-effective access to the report.
13. Are there any additional resources or data provided in the Africa Natural Gas Industry report?
While the report offers comprehensive insights, it's advisable to review the specific contents or supplementary materials provided to ascertain if additional resources or data are available.
14. How can I stay updated on further developments or reports in the Africa Natural Gas Industry?
To stay informed about further developments, trends, and reports in the Africa Natural Gas Industry, consider subscribing to industry newsletters, following relevant companies and organizations, or regularly checking reputable industry news sources and publications.
Methodology
Step 1 - Identification of Relevant Samples Size from Population Database


Step 2 - Approaches for Defining Global Market Size (Value, Volume* & Price*)

Note*: In applicable scenarios
Step 3 - Data Sources
Primary Research
- Web Analytics
- Survey Reports
- Research Institute
- Latest Research Reports
- Opinion Leaders
Secondary Research
- Annual Reports
- White Paper
- Latest Press Release
- Industry Association
- Paid Database
- Investor Presentations

Step 4 - Data Triangulation
Involves using different sources of information in order to increase the validity of a study
These sources are likely to be stakeholders in a program - participants, other researchers, program staff, other community members, and so on.
Then we put all data in single framework & apply various statistical tools to find out the dynamic on the market.
During the analysis stage, feedback from the stakeholder groups would be compared to determine areas of agreement as well as areas of divergence