


Key Insights
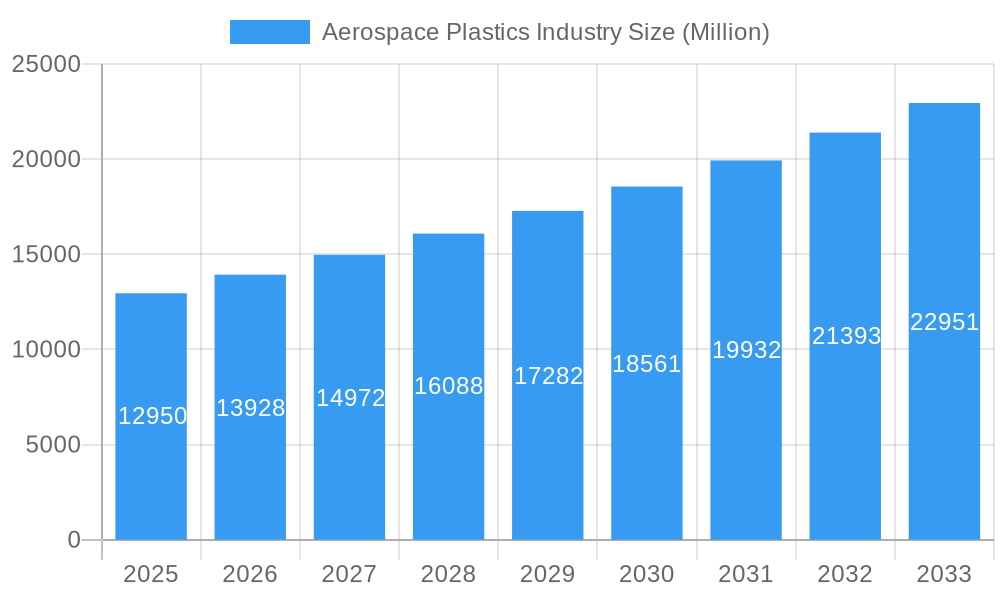
The aerospace plastics market, valued at $12.95 billion in 2025, is projected to experience robust growth, driven by increasing demand for lightweight and high-performance materials in aircraft and spacecraft manufacturing. The market's Compound Annual Growth Rate (CAGR) of 7.66% from 2019 to 2024 indicates a significant upward trajectory, a trend expected to continue through 2033. Key drivers include the rising adoption of composite materials in aerostructures to reduce fuel consumption and enhance aircraft efficiency, the growing demand for advanced cabin interiors offering improved passenger comfort and aesthetics, and the expansion of the space exploration industry requiring specialized plastics for satellite components and propulsion systems. Technological advancements in polymer science are leading to the development of new, high-strength, and lightweight plastics suitable for extreme aerospace environments. This innovation, coupled with increasing investments in research and development, fuels market expansion.
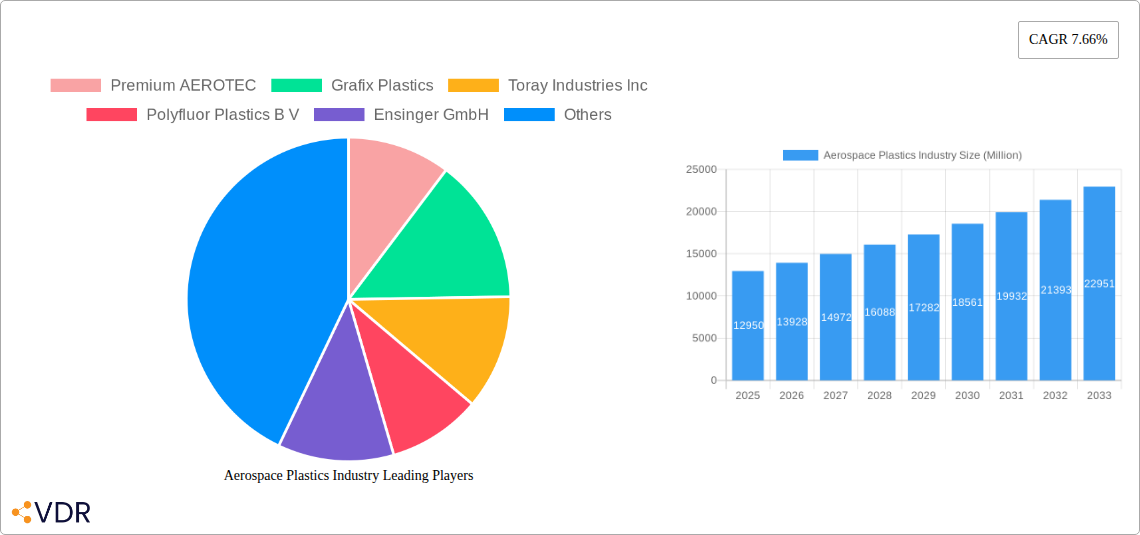
Aerospace Plastics Industry Market Size (In Billion)

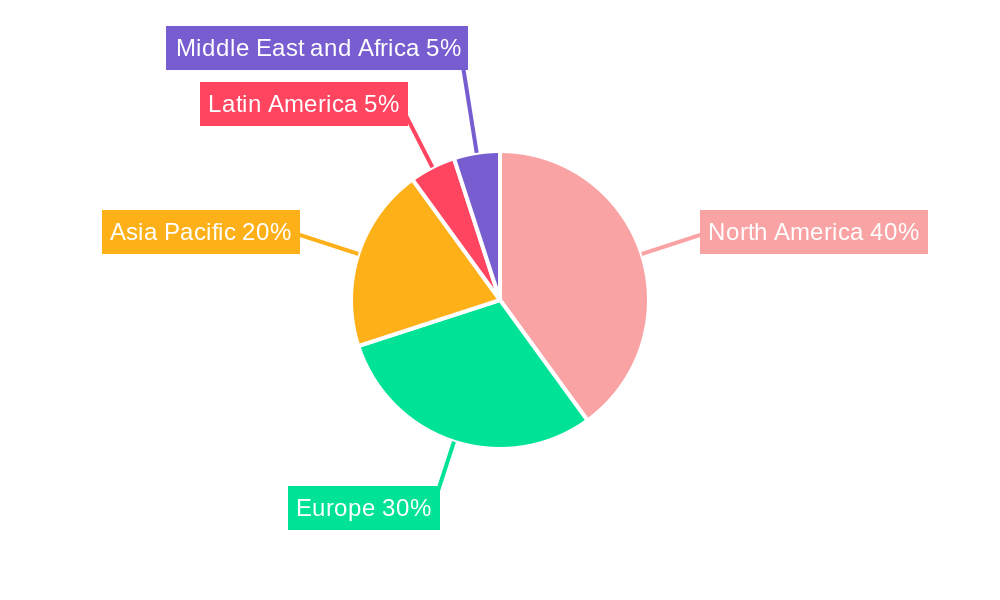
However, the market faces some challenges. High material costs, stringent regulatory requirements for aerospace-grade plastics, and the need for specialized manufacturing processes can potentially restrain growth. Nevertheless, the long-term outlook remains positive due to the ongoing trend towards lightweighting in aerospace design, increasing air travel, and continuous advancements in materials science. The market segmentation by application (aerostructures, cabin interiors, propulsion systems, satellites) and end-user (aviation, space) highlights diverse opportunities for growth. North America currently holds a significant market share due to its established aerospace industry and technological advancements; however, the Asia-Pacific region is expected to witness substantial growth in the coming years, driven by increased investments in aerospace infrastructure and manufacturing capabilities within emerging economies.
Aerospace Plastics Industry Company Market Share
Aerospace Plastics Industry Market Report: 2019-2033
This comprehensive report provides an in-depth analysis of the Aerospace Plastics industry, encompassing market dynamics, growth trends, regional segmentation, product landscape, key players, and future outlook. The report covers the period from 2019 to 2033, with a focus on the forecast period from 2025 to 2033 and a base year of 2025. The study covers key segments including General Aviation and Space, with applications spanning Aerostructure, Cabin Interiors, Propulsion Systems, and Satellites, ultimately serving the Aviation end-user. Market values are presented in million USD.
Aerospace Plastics Industry Market Dynamics & Structure
The Aerospace Plastics market is characterized by moderate concentration, with key players such as Premium AEROTEC, Toray Industries Inc., and Ensinger GmbH holding significant market share. However, the presence of numerous smaller, specialized players indicates a competitive landscape. Technological innovation, driven by the need for lightweight, high-strength materials, is a significant market driver. Stringent regulatory frameworks concerning material safety and performance are crucial considerations. The industry faces pressure from competitive substitutes like advanced composites and metals, particularly in specific applications. End-user demographics are primarily driven by the growth of the commercial aviation sector and space exploration initiatives. Market consolidation through M&A activity is observed, as illustrated by recent deals.
- Market Concentration: Moderately concentrated, with top 5 players holding approximately xx% market share (2025).
- Technological Innovation: Focus on lightweighting, high-performance materials (e.g., carbon fiber reinforced polymers), and improved processing techniques.
- Regulatory Framework: Stringent safety and performance standards (e.g., FAA, EASA) influence material selection and manufacturing processes.
- Competitive Substitutes: Advanced composites (carbon fiber, etc.), metals (aluminum, titanium).
- M&A Activity: Moderate level, with strategic acquisitions aimed at expanding product portfolios and geographical reach (e.g., Demgy Group's acquisition of E.I.S. Aircraft GmbH).
Aerospace Plastics Industry Growth Trends & Insights
The Aerospace Plastics market experienced a CAGR of xx% during the historical period (2019-2024) and is projected to grow at a CAGR of xx% during the forecast period (2025-2033), reaching a market size of xx million USD by 2033. This growth is fueled by increasing demand for fuel-efficient aircraft, advancements in aerospace manufacturing, and the expanding space exploration industry. The adoption rate of high-performance plastics is increasing, driven by their superior properties compared to traditional materials. Technological disruptions, such as the development of novel polymer blends and additive manufacturing techniques, are reshaping the market. Consumer behavior is shifting toward sustainable and eco-friendly materials, influencing the demand for bio-based and recyclable plastics.
Dominant Regions, Countries, or Segments in Aerospace Plastics Industry
North America currently holds the largest market share in the aerospace plastics industry, driven by robust domestic aerospace manufacturing and a strong presence of major players. Europe follows closely, benefiting from a well-established aerospace sector and ongoing investments in research and development. Within segments, the Aerostructure application holds the largest share, followed by Cabin Interiors. The Space segment is experiencing the fastest growth, fueled by increased space exploration initiatives and satellite deployments.
- Key Drivers for North America: Strong aerospace manufacturing base, significant R&D investments, favorable government policies.
- Key Drivers for Europe: Established aerospace industry, skilled workforce, collaborative R&D initiatives.
- Fastest Growing Segment: Space (driven by satellite manufacturing and space exploration programs).
- Largest Market Segment: Aerostructure (due to high material usage in aircraft construction).
Aerospace Plastics Industry Product Landscape
The aerospace plastics market offers a diverse range of products, including high-performance thermoplastics (e.g., PEEK, PEI), thermosets (e.g., epoxy resins), and advanced composites. These materials are engineered for specific applications, exhibiting exceptional properties like high strength-to-weight ratio, resistance to extreme temperatures, and chemical inertness. Unique selling propositions include enhanced durability, lightweight design, and improved fuel efficiency. Recent innovations focus on bio-based plastics and self-healing materials.
Key Drivers, Barriers & Challenges in Aerospace Plastics Industry
Key Drivers:
- Growing demand for lightweight aircraft
- Advancements in material science and processing technologies
- Increasing investment in space exploration
Key Challenges:
- High material costs
- Stringent regulatory compliance requirements
- Supply chain disruptions (e.g., raw material shortages)
- Intense competition from established materials (e.g., metals)
Emerging Opportunities in Aerospace Plastics Industry
- Development of sustainable and biodegradable aerospace plastics
- Expansion into new applications (e.g., drones, hypersonic vehicles)
- Increased adoption of additive manufacturing for customized parts
- Growth of the space exploration sector
Growth Accelerators in the Aerospace Plastics Industry
Technological breakthroughs in material science, leading to lighter, stronger, and more heat-resistant polymers, are key growth drivers. Strategic partnerships between materials suppliers and aircraft manufacturers facilitate innovation and product development. Expansion into new applications, such as unmanned aerial vehicles (UAVs) and electric aircraft, will further fuel market growth.
Key Players Shaping the Aerospace Plastics Industry Market
- Premium AEROTEC
- Grafix Plastics
- Toray Industries Inc
- Polyfluor Plastics B V
- Ensinger GmbH
- Curbell Plastics Inc
- Big Bear Plastic Products Limited
- Zeus Industrial Products Inc
- Paco Plastics Inc
- Loar Group Inc
- 3P Performance Plastics Products
Notable Milestones in Aerospace Plastics Industry Sector
- January 2023: Toray Industries, Inc. announced a USD 780 million investment to increase production capacity for carbon fiber materials used in hydrogen fuel tanks and airplanes by 2025. This significantly impacts the supply of a key material for the aerospace industry.
- October 2023: Demgy Group acquired E.I.S. Aircraft GmbH, enhancing its position in high-value-added plastics processing for the aeronautics industry. This consolidation strengthens market presence and production capacity.
In-Depth Aerospace Plastics Industry Market Outlook
The Aerospace Plastics market is poised for continued growth, driven by technological advancements, increasing demand for fuel-efficient and sustainable aircraft, and expansion into new applications. Strategic partnerships and investments in R&D will be crucial for capturing market share. The market presents significant opportunities for companies specializing in high-performance materials and advanced manufacturing techniques. The focus on lightweighting, sustainability, and improved performance will shape the future of the industry.
Aerospace Plastics Industry Segmentation
- 1. Production Analysis
- 2. Consumption Analysis
- 3. Import Market Analysis (Value & Volume)
- 4. Export Market Analysis (Value & Volume)
- 5. Price Trend Analysis
Aerospace Plastics Industry Segmentation By Geography
-
1. North America
- 1.1. United States
- 1.2. Canada
- 1.3. Mexico
-
2. South America
- 2.1. Brazil
- 2.2. Argentina
- 2.3. Rest of South America
-
3. Europe
- 3.1. United Kingdom
- 3.2. Germany
- 3.3. France
- 3.4. Italy
- 3.5. Spain
- 3.6. Russia
- 3.7. Benelux
- 3.8. Nordics
- 3.9. Rest of Europe
-
4. Middle East & Africa
- 4.1. Turkey
- 4.2. Israel
- 4.3. GCC
- 4.4. North Africa
- 4.5. South Africa
- 4.6. Rest of Middle East & Africa
-
5. Asia Pacific
- 5.1. China
- 5.2. India
- 5.3. Japan
- 5.4. South Korea
- 5.5. ASEAN
- 5.6. Oceania
- 5.7. Rest of Asia Pacific
Aerospace Plastics Industry Regional Market Share
Geographic Coverage of Aerospace Plastics Industry
Aerospace Plastics Industry REPORT HIGHLIGHTS
| Aspects | Details |
|---|---|
| Study Period | 2020-2034 |
| Base Year | 2025 |
| Estimated Year | 2026 |
| Forecast Period | 2026-2034 |
| Historical Period | 2020-2025 |
| Growth Rate | CAGR of 7.66% from 2020-2034 |
| Segmentation |
|
Table of Contents
- 1. Introduction
- 1.1. Research Scope
- 1.2. Market Segmentation
- 1.3. Research Methodology
- 1.4. Definitions and Assumptions
- 2. Executive Summary
- 2.1. Introduction
- 3. Market Dynamics
- 3.1. Introduction
- 3.2. Market Drivers
- 3.2.1. ; Increasing Number Of Air Passengers; Use Of Portable Electronic Devices
- 3.3. Market Restrains
- 3.3.1. ; High Cost Of Connectivity Equipments
- 3.4. Market Trends
- 3.4.1. Cabin Interiors to Witness Higher Growth During the Forecast Period
- 4. Market Factor Analysis
- 4.1. Porters Five Forces
- 4.2. Supply/Value Chain
- 4.3. PESTEL analysis
- 4.4. Market Entropy
- 4.5. Patent/Trademark Analysis
- 5. Global Aerospace Plastics Industry Analysis, Insights and Forecast, 2020-2032
- 5.1. Market Analysis, Insights and Forecast - by Production Analysis
- 5.2. Market Analysis, Insights and Forecast - by Consumption Analysis
- 5.3. Market Analysis, Insights and Forecast - by Import Market Analysis (Value & Volume)
- 5.4. Market Analysis, Insights and Forecast - by Export Market Analysis (Value & Volume)
- 5.5. Market Analysis, Insights and Forecast - by Price Trend Analysis
- 5.6. Market Analysis, Insights and Forecast - by Region
- 5.6.1. North America
- 5.6.2. South America
- 5.6.3. Europe
- 5.6.4. Middle East & Africa
- 5.6.5. Asia Pacific
- 5.1. Market Analysis, Insights and Forecast - by Production Analysis
- 6. North America Aerospace Plastics Industry Analysis, Insights and Forecast, 2020-2032
- 6.1. Market Analysis, Insights and Forecast - by Production Analysis
- 6.2. Market Analysis, Insights and Forecast - by Consumption Analysis
- 6.3. Market Analysis, Insights and Forecast - by Import Market Analysis (Value & Volume)
- 6.4. Market Analysis, Insights and Forecast - by Export Market Analysis (Value & Volume)
- 6.5. Market Analysis, Insights and Forecast - by Price Trend Analysis
- 6.1. Market Analysis, Insights and Forecast - by Production Analysis
- 7. South America Aerospace Plastics Industry Analysis, Insights and Forecast, 2020-2032
- 7.1. Market Analysis, Insights and Forecast - by Production Analysis
- 7.2. Market Analysis, Insights and Forecast - by Consumption Analysis
- 7.3. Market Analysis, Insights and Forecast - by Import Market Analysis (Value & Volume)
- 7.4. Market Analysis, Insights and Forecast - by Export Market Analysis (Value & Volume)
- 7.5. Market Analysis, Insights and Forecast - by Price Trend Analysis
- 7.1. Market Analysis, Insights and Forecast - by Production Analysis
- 8. Europe Aerospace Plastics Industry Analysis, Insights and Forecast, 2020-2032
- 8.1. Market Analysis, Insights and Forecast - by Production Analysis
- 8.2. Market Analysis, Insights and Forecast - by Consumption Analysis
- 8.3. Market Analysis, Insights and Forecast - by Import Market Analysis (Value & Volume)
- 8.4. Market Analysis, Insights and Forecast - by Export Market Analysis (Value & Volume)
- 8.5. Market Analysis, Insights and Forecast - by Price Trend Analysis
- 8.1. Market Analysis, Insights and Forecast - by Production Analysis
- 9. Middle East & Africa Aerospace Plastics Industry Analysis, Insights and Forecast, 2020-2032
- 9.1. Market Analysis, Insights and Forecast - by Production Analysis
- 9.2. Market Analysis, Insights and Forecast - by Consumption Analysis
- 9.3. Market Analysis, Insights and Forecast - by Import Market Analysis (Value & Volume)
- 9.4. Market Analysis, Insights and Forecast - by Export Market Analysis (Value & Volume)
- 9.5. Market Analysis, Insights and Forecast - by Price Trend Analysis
- 9.1. Market Analysis, Insights and Forecast - by Production Analysis
- 10. Asia Pacific Aerospace Plastics Industry Analysis, Insights and Forecast, 2020-2032
- 10.1. Market Analysis, Insights and Forecast - by Production Analysis
- 10.2. Market Analysis, Insights and Forecast - by Consumption Analysis
- 10.3. Market Analysis, Insights and Forecast - by Import Market Analysis (Value & Volume)
- 10.4. Market Analysis, Insights and Forecast - by Export Market Analysis (Value & Volume)
- 10.5. Market Analysis, Insights and Forecast - by Price Trend Analysis
- 10.1. Market Analysis, Insights and Forecast - by Production Analysis
- 11. Competitive Analysis
- 11.1. Global Market Share Analysis 2025
- 11.2. Company Profiles
- 11.2.1 Premium AEROTEC
- 11.2.1.1. Overview
- 11.2.1.2. Products
- 11.2.1.3. SWOT Analysis
- 11.2.1.4. Recent Developments
- 11.2.1.5. Financials (Based on Availability)
- 11.2.2 Grafix Plastics
- 11.2.2.1. Overview
- 11.2.2.2. Products
- 11.2.2.3. SWOT Analysis
- 11.2.2.4. Recent Developments
- 11.2.2.5. Financials (Based on Availability)
- 11.2.3 Toray Industries Inc
- 11.2.3.1. Overview
- 11.2.3.2. Products
- 11.2.3.3. SWOT Analysis
- 11.2.3.4. Recent Developments
- 11.2.3.5. Financials (Based on Availability)
- 11.2.4 Polyfluor Plastics B V
- 11.2.4.1. Overview
- 11.2.4.2. Products
- 11.2.4.3. SWOT Analysis
- 11.2.4.4. Recent Developments
- 11.2.4.5. Financials (Based on Availability)
- 11.2.5 Ensinger GmbH
- 11.2.5.1. Overview
- 11.2.5.2. Products
- 11.2.5.3. SWOT Analysis
- 11.2.5.4. Recent Developments
- 11.2.5.5. Financials (Based on Availability)
- 11.2.6 Curbell Plastics Inc
- 11.2.6.1. Overview
- 11.2.6.2. Products
- 11.2.6.3. SWOT Analysis
- 11.2.6.4. Recent Developments
- 11.2.6.5. Financials (Based on Availability)
- 11.2.7 Big Bear Plastic Products Limited
- 11.2.7.1. Overview
- 11.2.7.2. Products
- 11.2.7.3. SWOT Analysis
- 11.2.7.4. Recent Developments
- 11.2.7.5. Financials (Based on Availability)
- 11.2.8 Zeus Industrial Products Inc
- 11.2.8.1. Overview
- 11.2.8.2. Products
- 11.2.8.3. SWOT Analysis
- 11.2.8.4. Recent Developments
- 11.2.8.5. Financials (Based on Availability)
- 11.2.9 Paco Plastics Inc
- 11.2.9.1. Overview
- 11.2.9.2. Products
- 11.2.9.3. SWOT Analysis
- 11.2.9.4. Recent Developments
- 11.2.9.5. Financials (Based on Availability)
- 11.2.10 Loar Group Inc
- 11.2.10.1. Overview
- 11.2.10.2. Products
- 11.2.10.3. SWOT Analysis
- 11.2.10.4. Recent Developments
- 11.2.10.5. Financials (Based on Availability)
- 11.2.11 3P Performance Plastics Products
- 11.2.11.1. Overview
- 11.2.11.2. Products
- 11.2.11.3. SWOT Analysis
- 11.2.11.4. Recent Developments
- 11.2.11.5. Financials (Based on Availability)
- 11.2.1 Premium AEROTEC
List of Figures
- Figure 1: Global Aerospace Plastics Industry Revenue Breakdown (Million, %) by Region 2025 & 2033
- Figure 2: North America Aerospace Plastics Industry Revenue (Million), by Production Analysis 2025 & 2033
- Figure 3: North America Aerospace Plastics Industry Revenue Share (%), by Production Analysis 2025 & 2033
- Figure 4: North America Aerospace Plastics Industry Revenue (Million), by Consumption Analysis 2025 & 2033
- Figure 5: North America Aerospace Plastics Industry Revenue Share (%), by Consumption Analysis 2025 & 2033
- Figure 6: North America Aerospace Plastics Industry Revenue (Million), by Import Market Analysis (Value & Volume) 2025 & 2033
- Figure 7: North America Aerospace Plastics Industry Revenue Share (%), by Import Market Analysis (Value & Volume) 2025 & 2033
- Figure 8: North America Aerospace Plastics Industry Revenue (Million), by Export Market Analysis (Value & Volume) 2025 & 2033
- Figure 9: North America Aerospace Plastics Industry Revenue Share (%), by Export Market Analysis (Value & Volume) 2025 & 2033
- Figure 10: North America Aerospace Plastics Industry Revenue (Million), by Price Trend Analysis 2025 & 2033
- Figure 11: North America Aerospace Plastics Industry Revenue Share (%), by Price Trend Analysis 2025 & 2033
- Figure 12: North America Aerospace Plastics Industry Revenue (Million), by Country 2025 & 2033
- Figure 13: North America Aerospace Plastics Industry Revenue Share (%), by Country 2025 & 2033
- Figure 14: South America Aerospace Plastics Industry Revenue (Million), by Production Analysis 2025 & 2033
- Figure 15: South America Aerospace Plastics Industry Revenue Share (%), by Production Analysis 2025 & 2033
- Figure 16: South America Aerospace Plastics Industry Revenue (Million), by Consumption Analysis 2025 & 2033
- Figure 17: South America Aerospace Plastics Industry Revenue Share (%), by Consumption Analysis 2025 & 2033
- Figure 18: South America Aerospace Plastics Industry Revenue (Million), by Import Market Analysis (Value & Volume) 2025 & 2033
- Figure 19: South America Aerospace Plastics Industry Revenue Share (%), by Import Market Analysis (Value & Volume) 2025 & 2033
- Figure 20: South America Aerospace Plastics Industry Revenue (Million), by Export Market Analysis (Value & Volume) 2025 & 2033
- Figure 21: South America Aerospace Plastics Industry Revenue Share (%), by Export Market Analysis (Value & Volume) 2025 & 2033
- Figure 22: South America Aerospace Plastics Industry Revenue (Million), by Price Trend Analysis 2025 & 2033
- Figure 23: South America Aerospace Plastics Industry Revenue Share (%), by Price Trend Analysis 2025 & 2033
- Figure 24: South America Aerospace Plastics Industry Revenue (Million), by Country 2025 & 2033
- Figure 25: South America Aerospace Plastics Industry Revenue Share (%), by Country 2025 & 2033
- Figure 26: Europe Aerospace Plastics Industry Revenue (Million), by Production Analysis 2025 & 2033
- Figure 27: Europe Aerospace Plastics Industry Revenue Share (%), by Production Analysis 2025 & 2033
- Figure 28: Europe Aerospace Plastics Industry Revenue (Million), by Consumption Analysis 2025 & 2033
- Figure 29: Europe Aerospace Plastics Industry Revenue Share (%), by Consumption Analysis 2025 & 2033
- Figure 30: Europe Aerospace Plastics Industry Revenue (Million), by Import Market Analysis (Value & Volume) 2025 & 2033
- Figure 31: Europe Aerospace Plastics Industry Revenue Share (%), by Import Market Analysis (Value & Volume) 2025 & 2033
- Figure 32: Europe Aerospace Plastics Industry Revenue (Million), by Export Market Analysis (Value & Volume) 2025 & 2033
- Figure 33: Europe Aerospace Plastics Industry Revenue Share (%), by Export Market Analysis (Value & Volume) 2025 & 2033
- Figure 34: Europe Aerospace Plastics Industry Revenue (Million), by Price Trend Analysis 2025 & 2033
- Figure 35: Europe Aerospace Plastics Industry Revenue Share (%), by Price Trend Analysis 2025 & 2033
- Figure 36: Europe Aerospace Plastics Industry Revenue (Million), by Country 2025 & 2033
- Figure 37: Europe Aerospace Plastics Industry Revenue Share (%), by Country 2025 & 2033
- Figure 38: Middle East & Africa Aerospace Plastics Industry Revenue (Million), by Production Analysis 2025 & 2033
- Figure 39: Middle East & Africa Aerospace Plastics Industry Revenue Share (%), by Production Analysis 2025 & 2033
- Figure 40: Middle East & Africa Aerospace Plastics Industry Revenue (Million), by Consumption Analysis 2025 & 2033
- Figure 41: Middle East & Africa Aerospace Plastics Industry Revenue Share (%), by Consumption Analysis 2025 & 2033
- Figure 42: Middle East & Africa Aerospace Plastics Industry Revenue (Million), by Import Market Analysis (Value & Volume) 2025 & 2033
- Figure 43: Middle East & Africa Aerospace Plastics Industry Revenue Share (%), by Import Market Analysis (Value & Volume) 2025 & 2033
- Figure 44: Middle East & Africa Aerospace Plastics Industry Revenue (Million), by Export Market Analysis (Value & Volume) 2025 & 2033
- Figure 45: Middle East & Africa Aerospace Plastics Industry Revenue Share (%), by Export Market Analysis (Value & Volume) 2025 & 2033
- Figure 46: Middle East & Africa Aerospace Plastics Industry Revenue (Million), by Price Trend Analysis 2025 & 2033
- Figure 47: Middle East & Africa Aerospace Plastics Industry Revenue Share (%), by Price Trend Analysis 2025 & 2033
- Figure 48: Middle East & Africa Aerospace Plastics Industry Revenue (Million), by Country 2025 & 2033
- Figure 49: Middle East & Africa Aerospace Plastics Industry Revenue Share (%), by Country 2025 & 2033
- Figure 50: Asia Pacific Aerospace Plastics Industry Revenue (Million), by Production Analysis 2025 & 2033
- Figure 51: Asia Pacific Aerospace Plastics Industry Revenue Share (%), by Production Analysis 2025 & 2033
- Figure 52: Asia Pacific Aerospace Plastics Industry Revenue (Million), by Consumption Analysis 2025 & 2033
- Figure 53: Asia Pacific Aerospace Plastics Industry Revenue Share (%), by Consumption Analysis 2025 & 2033
- Figure 54: Asia Pacific Aerospace Plastics Industry Revenue (Million), by Import Market Analysis (Value & Volume) 2025 & 2033
- Figure 55: Asia Pacific Aerospace Plastics Industry Revenue Share (%), by Import Market Analysis (Value & Volume) 2025 & 2033
- Figure 56: Asia Pacific Aerospace Plastics Industry Revenue (Million), by Export Market Analysis (Value & Volume) 2025 & 2033
- Figure 57: Asia Pacific Aerospace Plastics Industry Revenue Share (%), by Export Market Analysis (Value & Volume) 2025 & 2033
- Figure 58: Asia Pacific Aerospace Plastics Industry Revenue (Million), by Price Trend Analysis 2025 & 2033
- Figure 59: Asia Pacific Aerospace Plastics Industry Revenue Share (%), by Price Trend Analysis 2025 & 2033
- Figure 60: Asia Pacific Aerospace Plastics Industry Revenue (Million), by Country 2025 & 2033
- Figure 61: Asia Pacific Aerospace Plastics Industry Revenue Share (%), by Country 2025 & 2033
List of Tables
- Table 1: Global Aerospace Plastics Industry Revenue Million Forecast, by Production Analysis 2020 & 2033
- Table 2: Global Aerospace Plastics Industry Revenue Million Forecast, by Consumption Analysis 2020 & 2033
- Table 3: Global Aerospace Plastics Industry Revenue Million Forecast, by Import Market Analysis (Value & Volume) 2020 & 2033
- Table 4: Global Aerospace Plastics Industry Revenue Million Forecast, by Export Market Analysis (Value & Volume) 2020 & 2033
- Table 5: Global Aerospace Plastics Industry Revenue Million Forecast, by Price Trend Analysis 2020 & 2033
- Table 6: Global Aerospace Plastics Industry Revenue Million Forecast, by Region 2020 & 2033
- Table 7: Global Aerospace Plastics Industry Revenue Million Forecast, by Production Analysis 2020 & 2033
- Table 8: Global Aerospace Plastics Industry Revenue Million Forecast, by Consumption Analysis 2020 & 2033
- Table 9: Global Aerospace Plastics Industry Revenue Million Forecast, by Import Market Analysis (Value & Volume) 2020 & 2033
- Table 10: Global Aerospace Plastics Industry Revenue Million Forecast, by Export Market Analysis (Value & Volume) 2020 & 2033
- Table 11: Global Aerospace Plastics Industry Revenue Million Forecast, by Price Trend Analysis 2020 & 2033
- Table 12: Global Aerospace Plastics Industry Revenue Million Forecast, by Country 2020 & 2033
- Table 13: United States Aerospace Plastics Industry Revenue (Million) Forecast, by Application 2020 & 2033
- Table 14: Canada Aerospace Plastics Industry Revenue (Million) Forecast, by Application 2020 & 2033
- Table 15: Mexico Aerospace Plastics Industry Revenue (Million) Forecast, by Application 2020 & 2033
- Table 16: Global Aerospace Plastics Industry Revenue Million Forecast, by Production Analysis 2020 & 2033
- Table 17: Global Aerospace Plastics Industry Revenue Million Forecast, by Consumption Analysis 2020 & 2033
- Table 18: Global Aerospace Plastics Industry Revenue Million Forecast, by Import Market Analysis (Value & Volume) 2020 & 2033
- Table 19: Global Aerospace Plastics Industry Revenue Million Forecast, by Export Market Analysis (Value & Volume) 2020 & 2033
- Table 20: Global Aerospace Plastics Industry Revenue Million Forecast, by Price Trend Analysis 2020 & 2033
- Table 21: Global Aerospace Plastics Industry Revenue Million Forecast, by Country 2020 & 2033
- Table 22: Brazil Aerospace Plastics Industry Revenue (Million) Forecast, by Application 2020 & 2033
- Table 23: Argentina Aerospace Plastics Industry Revenue (Million) Forecast, by Application 2020 & 2033
- Table 24: Rest of South America Aerospace Plastics Industry Revenue (Million) Forecast, by Application 2020 & 2033
- Table 25: Global Aerospace Plastics Industry Revenue Million Forecast, by Production Analysis 2020 & 2033
- Table 26: Global Aerospace Plastics Industry Revenue Million Forecast, by Consumption Analysis 2020 & 2033
- Table 27: Global Aerospace Plastics Industry Revenue Million Forecast, by Import Market Analysis (Value & Volume) 2020 & 2033
- Table 28: Global Aerospace Plastics Industry Revenue Million Forecast, by Export Market Analysis (Value & Volume) 2020 & 2033
- Table 29: Global Aerospace Plastics Industry Revenue Million Forecast, by Price Trend Analysis 2020 & 2033
- Table 30: Global Aerospace Plastics Industry Revenue Million Forecast, by Country 2020 & 2033
- Table 31: United Kingdom Aerospace Plastics Industry Revenue (Million) Forecast, by Application 2020 & 2033
- Table 32: Germany Aerospace Plastics Industry Revenue (Million) Forecast, by Application 2020 & 2033
- Table 33: France Aerospace Plastics Industry Revenue (Million) Forecast, by Application 2020 & 2033
- Table 34: Italy Aerospace Plastics Industry Revenue (Million) Forecast, by Application 2020 & 2033
- Table 35: Spain Aerospace Plastics Industry Revenue (Million) Forecast, by Application 2020 & 2033
- Table 36: Russia Aerospace Plastics Industry Revenue (Million) Forecast, by Application 2020 & 2033
- Table 37: Benelux Aerospace Plastics Industry Revenue (Million) Forecast, by Application 2020 & 2033
- Table 38: Nordics Aerospace Plastics Industry Revenue (Million) Forecast, by Application 2020 & 2033
- Table 39: Rest of Europe Aerospace Plastics Industry Revenue (Million) Forecast, by Application 2020 & 2033
- Table 40: Global Aerospace Plastics Industry Revenue Million Forecast, by Production Analysis 2020 & 2033
- Table 41: Global Aerospace Plastics Industry Revenue Million Forecast, by Consumption Analysis 2020 & 2033
- Table 42: Global Aerospace Plastics Industry Revenue Million Forecast, by Import Market Analysis (Value & Volume) 2020 & 2033
- Table 43: Global Aerospace Plastics Industry Revenue Million Forecast, by Export Market Analysis (Value & Volume) 2020 & 2033
- Table 44: Global Aerospace Plastics Industry Revenue Million Forecast, by Price Trend Analysis 2020 & 2033
- Table 45: Global Aerospace Plastics Industry Revenue Million Forecast, by Country 2020 & 2033
- Table 46: Turkey Aerospace Plastics Industry Revenue (Million) Forecast, by Application 2020 & 2033
- Table 47: Israel Aerospace Plastics Industry Revenue (Million) Forecast, by Application 2020 & 2033
- Table 48: GCC Aerospace Plastics Industry Revenue (Million) Forecast, by Application 2020 & 2033
- Table 49: North Africa Aerospace Plastics Industry Revenue (Million) Forecast, by Application 2020 & 2033
- Table 50: South Africa Aerospace Plastics Industry Revenue (Million) Forecast, by Application 2020 & 2033
- Table 51: Rest of Middle East & Africa Aerospace Plastics Industry Revenue (Million) Forecast, by Application 2020 & 2033
- Table 52: Global Aerospace Plastics Industry Revenue Million Forecast, by Production Analysis 2020 & 2033
- Table 53: Global Aerospace Plastics Industry Revenue Million Forecast, by Consumption Analysis 2020 & 2033
- Table 54: Global Aerospace Plastics Industry Revenue Million Forecast, by Import Market Analysis (Value & Volume) 2020 & 2033
- Table 55: Global Aerospace Plastics Industry Revenue Million Forecast, by Export Market Analysis (Value & Volume) 2020 & 2033
- Table 56: Global Aerospace Plastics Industry Revenue Million Forecast, by Price Trend Analysis 2020 & 2033
- Table 57: Global Aerospace Plastics Industry Revenue Million Forecast, by Country 2020 & 2033
- Table 58: China Aerospace Plastics Industry Revenue (Million) Forecast, by Application 2020 & 2033
- Table 59: India Aerospace Plastics Industry Revenue (Million) Forecast, by Application 2020 & 2033
- Table 60: Japan Aerospace Plastics Industry Revenue (Million) Forecast, by Application 2020 & 2033
- Table 61: South Korea Aerospace Plastics Industry Revenue (Million) Forecast, by Application 2020 & 2033
- Table 62: ASEAN Aerospace Plastics Industry Revenue (Million) Forecast, by Application 2020 & 2033
- Table 63: Oceania Aerospace Plastics Industry Revenue (Million) Forecast, by Application 2020 & 2033
- Table 64: Rest of Asia Pacific Aerospace Plastics Industry Revenue (Million) Forecast, by Application 2020 & 2033
Frequently Asked Questions
1. What is the projected Compound Annual Growth Rate (CAGR) of the Aerospace Plastics Industry?
The projected CAGR is approximately 7.66%.
2. Which companies are prominent players in the Aerospace Plastics Industry?
Key companies in the market include Premium AEROTEC, Grafix Plastics, Toray Industries Inc, Polyfluor Plastics B V, Ensinger GmbH, Curbell Plastics Inc, Big Bear Plastic Products Limited, Zeus Industrial Products Inc, Paco Plastics Inc, Loar Group Inc, 3P Performance Plastics Products.
3. What are the main segments of the Aerospace Plastics Industry?
The market segments include Production Analysis, Consumption Analysis, Import Market Analysis (Value & Volume), Export Market Analysis (Value & Volume), Price Trend Analysis.
4. Can you provide details about the market size?
The market size is estimated to be USD 12.95 Million as of 2022.
5. What are some drivers contributing to market growth?
; Increasing Number Of Air Passengers; Use Of Portable Electronic Devices.
6. What are the notable trends driving market growth?
Cabin Interiors to Witness Higher Growth During the Forecast Period.
7. Are there any restraints impacting market growth?
; High Cost Of Connectivity Equipments.
8. Can you provide examples of recent developments in the market?
In January 2023, Toray Industries, Inc. announced a USD 780 million investment towards increasing its production capacity for carbon fiber materials used in hydrogen fuel tanks and airplanes by 2025.
9. What pricing options are available for accessing the report?
Pricing options include single-user, multi-user, and enterprise licenses priced at USD 4750, USD 5250, and USD 8750 respectively.
10. Is the market size provided in terms of value or volume?
The market size is provided in terms of value, measured in Million.
11. Are there any specific market keywords associated with the report?
Yes, the market keyword associated with the report is "Aerospace Plastics Industry," which aids in identifying and referencing the specific market segment covered.
12. How do I determine which pricing option suits my needs best?
The pricing options vary based on user requirements and access needs. Individual users may opt for single-user licenses, while businesses requiring broader access may choose multi-user or enterprise licenses for cost-effective access to the report.
13. Are there any additional resources or data provided in the Aerospace Plastics Industry report?
While the report offers comprehensive insights, it's advisable to review the specific contents or supplementary materials provided to ascertain if additional resources or data are available.
14. How can I stay updated on further developments or reports in the Aerospace Plastics Industry?
To stay informed about further developments, trends, and reports in the Aerospace Plastics Industry, consider subscribing to industry newsletters, following relevant companies and organizations, or regularly checking reputable industry news sources and publications.
Methodology
Step 1 - Identification of Relevant Samples Size from Population Database


Step 2 - Approaches for Defining Global Market Size (Value, Volume* & Price*)

Note*: In applicable scenarios
Step 3 - Data Sources
Primary Research
- Web Analytics
- Survey Reports
- Research Institute
- Latest Research Reports
- Opinion Leaders
Secondary Research
- Annual Reports
- White Paper
- Latest Press Release
- Industry Association
- Paid Database
- Investor Presentations

Step 4 - Data Triangulation
Involves using different sources of information in order to increase the validity of a study
These sources are likely to be stakeholders in a program - participants, other researchers, program staff, other community members, and so on.
Then we put all data in single framework & apply various statistical tools to find out the dynamic on the market.
During the analysis stage, feedback from the stakeholder groups would be compared to determine areas of agreement as well as areas of divergence