

Key Insights
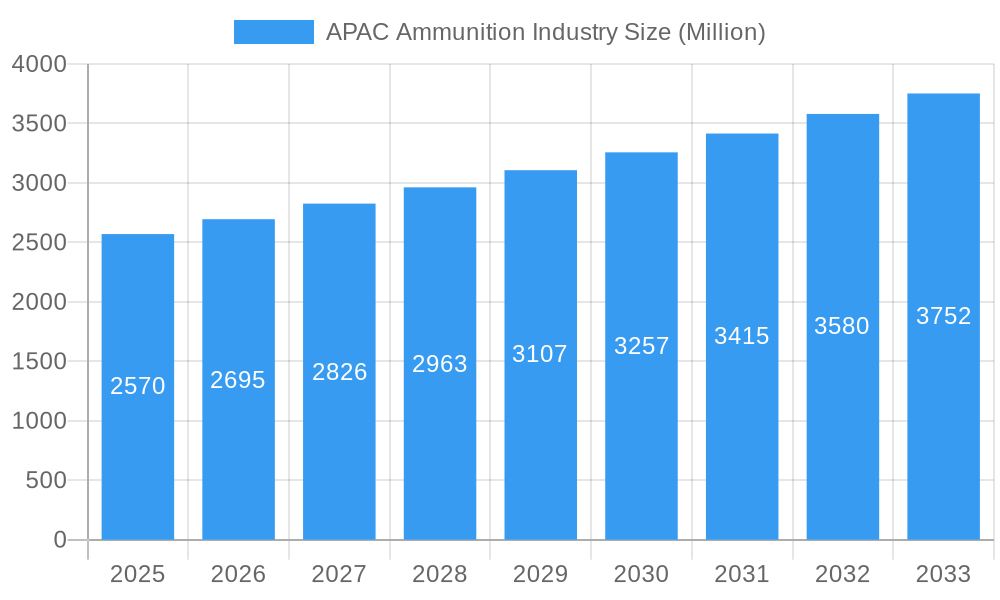
The APAC Ammunition Industry is poised for significant expansion, with a projected market size of $2.57 Billion in 2025, growing at a robust Compound Annual Growth Rate (CAGR) of 4.83% through 2033. This upward trajectory is driven by a confluence of factors including escalating geopolitical tensions across the region, increasing defense budgets of major APAC nations, and a growing demand for advanced munitions for both military and law enforcement applications. Furthermore, the ongoing modernization of armed forces, coupled with significant investments in research and development for next-generation ammunition, will further fuel market growth. The segment showing the most dynamic growth is expected to be small and medium-caliber ammunition, driven by extensive training requirements and internal security needs.
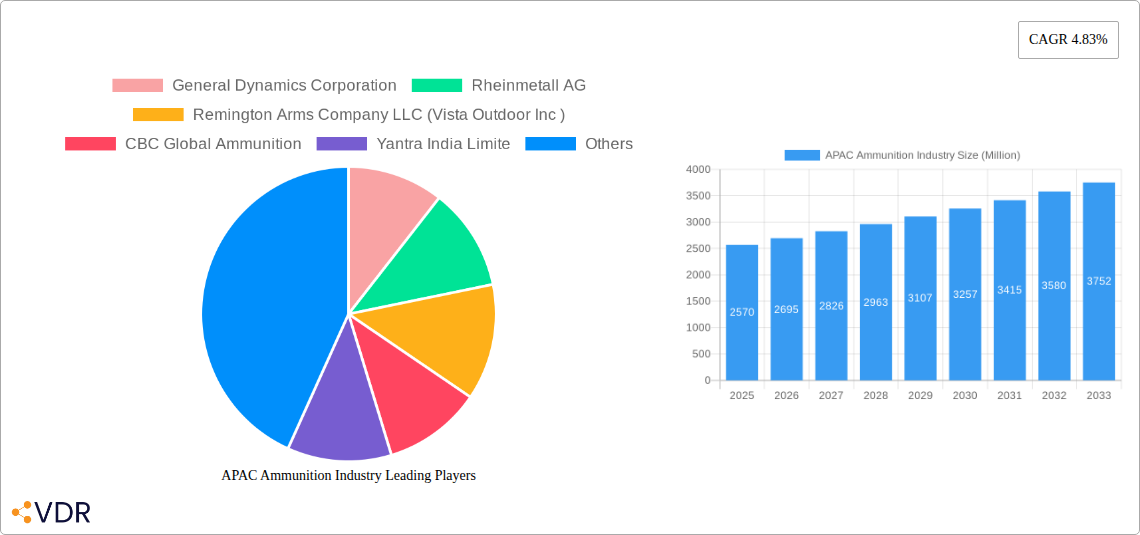
APAC Ammunition Industry Market Size (In Billion)
The market landscape is characterized by a strategic shift towards indigenous production capabilities, as many APAC countries aim to reduce reliance on foreign suppliers and bolster their defense industrial bases. This trend is supported by government initiatives and defense procurement policies. Emerging technologies such as smart ammunition, guided munitions, and eco-friendly propellants are also gaining traction, presenting new opportunities for innovation and market penetration. Key players like General Dynamics Corporation, Rheinmetall AG, and Winchester Ammunition are actively participating in this evolving market through strategic partnerships, mergers, and acquisitions, as well as investments in advanced manufacturing facilities. The demand for specialized ammunition for counter-terrorism operations and peacekeeping missions is also contributing to the overall market expansion, making the APAC region a critical hub for ammunition manufacturers and suppliers globally.
APAC Ammunition Industry Company Market Share
APAC Ammunition Industry Market Dynamics & Structure
The APAC ammunition industry is characterized by a dynamic interplay of market concentration, rapid technological innovation, and evolving regulatory frameworks. While certain segments exhibit high concentration with major global players dominating, others remain fragmented, offering opportunities for niche manufacturers. Technological advancements, particularly in guided munitions and smart ammunition, are key drivers, alongside the constant need for modernization by defense forces across the region. Regulatory landscapes vary significantly, impacting production, import/export, and procurement processes. Competitive product substitutes are emerging, primarily in the form of advanced drone warfare and cyber capabilities, pushing ammunition manufacturers to innovate. End-user demographics are increasingly influenced by geopolitical tensions, modernization programs, and regional security alliances. Mergers and acquisitions (M&A) trends are shaping market consolidation, with larger entities acquiring smaller ones to gain market share and access new technologies. The estimated market share for the top 5 companies stands at approximately 45%, while M&A deal volumes have seen a 10% increase year-on-year, driven by strategic acquisitions to enhance capabilities and expand product portfolios. Innovation barriers include high research and development costs and stringent testing requirements.
- Market Concentration: Dominance of key global players alongside fragmented niche markets.
- Technological Innovation: Focus on guided munitions, smart ammunition, and counter-drone solutions.
- Regulatory Frameworks: Diverse and evolving policies influencing trade and production.
- Competitive Substitutes: Rise of drone warfare and cyber capabilities.
- End-User Demographics: Driven by geopolitical factors and defense modernization.
- M&A Trends: Strategic acquisitions for market consolidation and capability enhancement.
APAC Ammunition Industry Growth Trends & Insights
The APAC ammunition industry is poised for substantial growth, with the market size projected to witness a Compound Annual Growth Rate (CAGR) of approximately 7.5% during the forecast period of 2025–2033. This robust expansion is fueled by escalating geopolitical tensions, ongoing defense modernization initiatives across numerous APAC nations, and increasing defense budgets. The adoption rates of advanced ammunition technologies, such as precision-guided munitions (PGMs) and smart ammunition, are rapidly accelerating as military forces prioritize enhanced battlefield effectiveness and reduced collateral damage. Technological disruptions, including the integration of AI in targeting systems and the development of more sophisticated propellants and warheads, are transforming the product landscape. Consumer behavior shifts are evident, with a growing demand for customized ammunition solutions tailored to specific operational requirements and platform integration. Market penetration of advanced ammunition types is expected to reach 60% by 2033, up from an estimated 30% in the base year of 2025. The overall market value is projected to grow from an estimated $35,000 million units in 2025 to over $60,000 million units by 2033. This growth trajectory is underpinned by a continuous need for sustained replenishment of existing stockpiles and the procurement of next-generation ordnance to maintain military superiority and deter potential adversaries. Furthermore, the burgeoning internal defense manufacturing capabilities within several APAC countries are contributing to increased production volumes and a more self-reliant supply chain, thereby bolstering market resilience and driving down long-term acquisition costs for the region's armed forces. The strategic importance of ammunition as a critical component of national security ensures consistent demand, even amidst economic fluctuations.
Dominant Regions, Countries, or Segments in APAC Ammunition Industry
Within the APAC ammunition industry, the Asia-Pacific region itself emerges as the dominant force, driven by a confluence of factors including significant defense expenditure, ongoing territorial disputes, and robust industrial capabilities. Among the key segments, Production Analysis and Consumption Analysis are intrinsically linked to the region's growing strategic importance.
Production Analysis: China and India are the leading nations in ammunition production, boasting substantial manufacturing capacities. China’s extensive defense industrial base, coupled with its significant export activities, positions it as a global powerhouse. India, driven by its “Atmanirbhar Bharat” (self-reliant India) initiative, has been heavily investing in bolstering its domestic ammunition production capabilities, aiming to reduce reliance on imports. Yantra India Limited and Munitions India Limited are pivotal in this endeavor. Other nations like South Korea, with companies such as Poongson Corporation and Hanwha Corporation, and Singapore, represented by Singapore Technologies Engineering Ltd, also contribute significantly to regional production, focusing on specialized ammunition types and advanced manufacturing techniques. The production volume is estimated to reach 18,000 million units in 2025, with a projected growth to 28,000 million units by 2033.
Consumption Analysis: The consumption of ammunition in APAC is predominantly driven by military modernization programs and the ongoing need to maintain readiness. Major consumers include China, India, Japan, South Korea, and Southeast Asian nations. Growing regional security concerns, such as maritime disputes and border tensions, necessitate sustained ammunition procurement. The consumption volume is projected to grow from an estimated 15,000 million units in 2025 to 24,000 million units by 2033, reflecting a consistent demand for a wide array of ammunition calibers and types.
Import Market Analysis (Value & Volume): While regional production is expanding, significant import volumes persist, particularly for highly specialized or technologically advanced ammunition that domestic industries may not yet fully produce. Southeast Asian nations and some smaller economies with less developed defense industries are major importers. The import value is estimated at $15,000 million units in 2025, with a projected increase to $22,000 million units by 2033.
Export Market Analysis (Value & Volume): China and India are also significant exporters of ammunition, catering to markets in the Middle East, Africa, and other parts of Asia. Rheinmetall AG, KNDS NV, and General Dynamics Corporation, while global entities, also have a significant presence and export activities within the APAC region. The export volume is projected to reach 5,000 million units in 2025, expanding to 8,000 million units by 2033.
Price Trend Analysis: Ammunition prices in APAC are influenced by raw material costs, production efficiencies, technological sophistication, and geopolitical demand. While basic ammunition calibers may see price stability, advanced and precision-guided munitions command premium pricing. The average price per unit is estimated at $1.00 in 2025, with a modest increase to $1.15 by 2033, largely driven by the increasing prevalence of high-value smart munitions.
- Dominant Region: Asia-Pacific.
- Leading Producers: China, India, South Korea, Singapore.
- Key Importers: Southeast Asian nations, smaller economies.
- Major Exporters: China, India, with global players active.
- Price Drivers: Raw materials, technology, geopolitical demand.
APAC Ammunition Industry Product Landscape
The APAC ammunition industry product landscape is characterized by continuous innovation, driven by the demand for enhanced lethality, accuracy, and versatility. Key product categories include small-caliber, medium-caliber, and large-caliber ammunition, along with specialized munitions like precision-guided munitions (PGMs), loitering munitions, and anti-tank rounds. Product performance metrics focus on range, accuracy, terminal ballistics, and interoperability with various weapon systems. For instance, the newly developed ASN-301 loitering munition showcases advanced target acquisition and precision strike capabilities. Winchester Ammunition and Remington Arms Company LLC (Vista Outdoor Inc) are known for their extensive range of small and medium-caliber ammunition, catering to both military and civilian markets. CBC Global Ammunition is a significant player in various calibers and has a strong presence in training and simulation ammunition. The emphasis is on developing ammunition that is cost-effective, reliable, and offers superior performance in diverse operational environments.
Key Drivers, Barriers & Challenges in APAC Ammunition Industry
Key Drivers:
- Geopolitical Tensions: Rising regional conflicts and territorial disputes necessitate increased defense spending and ammunition procurement.
- Defense Modernization Programs: Nations across APAC are actively modernizing their armed forces, leading to demand for advanced and conventional ammunition.
- Technological Advancements: Development of smart munitions, guided projectiles, and loitering munitions drives demand for next-generation ordnance.
- Growing Defense Budgets: Increased allocation of resources towards national security bolsters ammunition market growth.
- Domestic Manufacturing Initiatives: Government policies promoting local production create opportunities for indigenous ammunition manufacturers.
Barriers & Challenges:
- Supply Chain Disruptions: Reliance on global supply chains for raw materials and components can lead to vulnerabilities.
- Stringent Regulatory Frameworks: Export controls, import restrictions, and licensing requirements can impede market access.
- High R&D Costs: Developing advanced ammunition technologies requires significant investment in research and development.
- Technological Obsolescence: Rapid advancements can render existing ammunition stockpiles outdated, necessitating costly upgrades or replacements.
- Environmental Regulations: Compliance with environmental standards during production and disposal of ammunition adds complexity and cost.
- Skilled Workforce Shortage: A lack of specialized engineers and technicians can hinder production and innovation.
Emerging Opportunities in APAC Ammunition Industry
Emerging opportunities in the APAC ammunition industry lie in the development and deployment of autonomous and intelligent munitions. The growing interest in counter-drone capabilities presents a significant market for specialized ammunition designed to neutralize unmanned aerial systems. Furthermore, the increasing adoption of digital warfare and network-centric operations is driving demand for smart ammunition with integrated communication and targeting systems, enabling greater battlefield awareness and precision. Untapped markets in countries with nascent defense sectors offer potential for growth, provided tailored solutions and competitive pricing are offered. The evolving nature of conflict also points towards opportunities in training and simulation ammunition, allowing armed forces to practice with realistic munitions in a cost-effective and safe manner.
Growth Accelerators in the APAC Ammunition Industry Industry
Several catalysts are accelerating growth in the APAC ammunition industry. Technological breakthroughs in areas like novel propellants, advanced warhead designs, and miniaturized guidance systems are crucial. Strategic partnerships between domestic manufacturers and international defense giants foster technology transfer and enhance local production capabilities. Market expansion strategies, including securing long-term supply contracts with national defense ministries and actively participating in regional defense expos, are vital. The increasing emphasis on indigenous defense manufacturing and "Make in India" type initiatives are powerful growth accelerators, driving investment and creating a more robust domestic supply chain, thereby reducing import dependence and boosting production volumes.
Key Players Shaping the APAC Ammunition Industry Market
- General Dynamics Corporation
- Rheinmetall AG
- Remington Arms Company LLC (Vista Outdoor Inc)
- CBC Global Ammunition
- Yantra India Limited
- BAE Systems PLC
- Winchester Ammunition (Olin Corporation)
- Munitions India Limited
- Singapore Technologies Engineering Ltd
- Poongson Corporation
- Hanwha Corporation
- KNDS NV
Notable Milestones in APAC Ammunition Industry Sector
- February 2024: China showcased its newly developed ASN-301 loitering munition in Saudi Arabia. Designed to infiltrate adversary airspace, the ASN-301's main function is to loiter until it picks up a radar signal. Upon detection, the ASN-301 targets the signal and precisely strikes. Equipped with a warhead containing 7,000 fragments, the munition is activated by a proximity laser fuse, ensuring a lethal radius of 20 meters. This development highlights the region's growing prowess in advanced drone and munition technology.
- February 2023: The Indian Ministry of Defence (MoD) selected five domestic ammunition manufacturers to supply 2,000 155mm terminally guided munitions (TGMs) for the existing 155-mm artillery guns. This signifies a major step towards enhancing India's indigenous production of precision-guided munitions and reducing reliance on imports.
In-Depth APAC Ammunition Industry Market Outlook
The outlook for the APAC ammunition industry remains exceptionally strong, driven by a persistent demand for both conventional and advanced ordnance. Growth accelerators include the continued emphasis on national security, substantial defense modernization programs across key nations, and ongoing geopolitical complexities that necessitate robust military preparedness. Emerging opportunities in smart munitions, loitering munition technology, and counter-drone solutions will shape future market dynamics. Strategic partnerships and government-backed initiatives promoting indigenous defense manufacturing are poised to further bolster regional production capabilities and market resilience. The industry is set to experience sustained growth, with innovation and technological adoption playing pivotal roles in defining competitive advantages and market leadership in the coming years.
APAC Ammunition Industry Segmentation
- 1. Production Analysis
- 2. Consumption Analysis
- 3. Import Market Analysis (Value & Volume)
- 4. Export Market Analysis (Value & Volume)
- 5. Price Trend Analysis
APAC Ammunition Industry Segmentation By Geography
-
1. North America
- 1.1. United States
- 1.2. Canada
- 1.3. Mexico
-
2. South America
- 2.1. Brazil
- 2.2. Argentina
- 2.3. Rest of South America
-
3. Europe
- 3.1. United Kingdom
- 3.2. Germany
- 3.3. France
- 3.4. Italy
- 3.5. Spain
- 3.6. Russia
- 3.7. Benelux
- 3.8. Nordics
- 3.9. Rest of Europe
-
4. Middle East & Africa
- 4.1. Turkey
- 4.2. Israel
- 4.3. GCC
- 4.4. North Africa
- 4.5. South Africa
- 4.6. Rest of Middle East & Africa
-
5. Asia Pacific
- 5.1. China
- 5.2. India
- 5.3. Japan
- 5.4. South Korea
- 5.5. ASEAN
- 5.6. Oceania
- 5.7. Rest of Asia Pacific
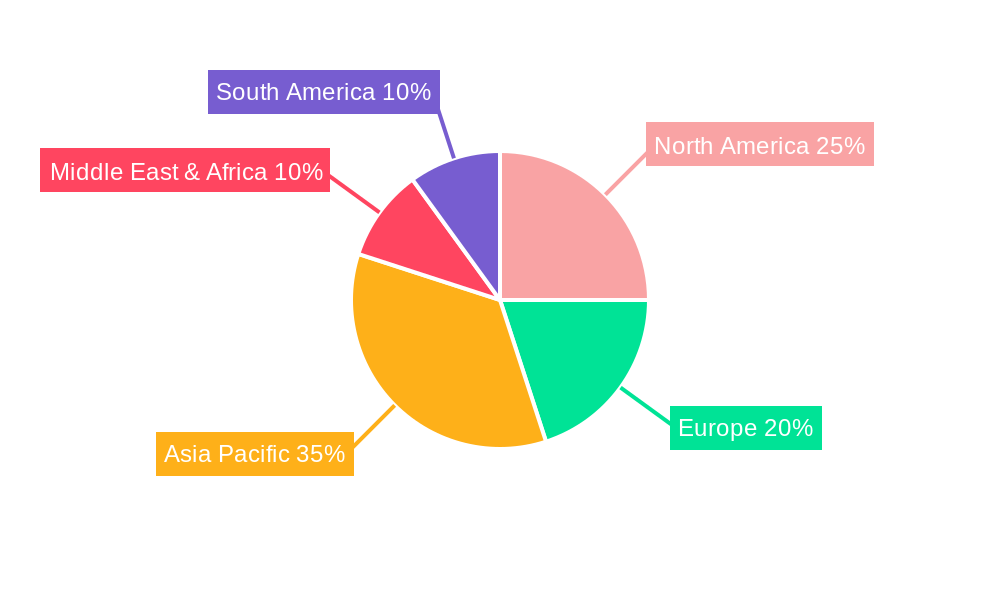
APAC Ammunition Industry Regional Market Share
Geographic Coverage of APAC Ammunition Industry
APAC Ammunition Industry REPORT HIGHLIGHTS
| Aspects | Details |
|---|---|
| Study Period | 2020-2034 |
| Base Year | 2025 |
| Estimated Year | 2026 |
| Forecast Period | 2026-2034 |
| Historical Period | 2020-2025 |
| Growth Rate | CAGR of 4.83% from 2020-2034 |
| Segmentation |
|
Table of Contents
- 1. Introduction
- 1.1. Research Scope
- 1.2. Market Segmentation
- 1.3. Research Objective
- 1.4. Definitions and Assumptions
- 2. Executive Summary
- 2.1. Market Snapshot
- 3. Market Dynamics
- 3.1. Market Drivers
- 3.2. Market Restrains
- 3.3. Market Trends
- 3.4. Market Opportunities
- 4. Market Factor Analysis
- 4.1. Porters Five Forces
- 4.1.1. Bargaining Power of Suppliers
- 4.1.2. Bargaining Power of Buyers
- 4.1.3. Threat of New Entrants
- 4.1.4. Threat of Substitutes
- 4.1.5. Competitive Rivalry
- 4.2. PESTEL analysis
- 4.3. BCG Analysis
- 4.3.1. Stars (High Growth, High Market Share)
- 4.3.2. Cash Cows (Low Growth, High Market Share)
- 4.3.3. Question Mark (High Growth, Low Market Share)
- 4.3.4. Dogs (Low Growth, Low Market Share)
- 4.4. Ansoff Matrix Analysis
- 4.5. Supply Chain Analysis
- 4.6. Regulatory Landscape
- 4.7. Current Market Potential and Opportunity Assessment (TAM–SAM–SOM Framework)
- 4.8. VDR Analyst Note
- 4.1. Porters Five Forces
- 5. Market Analysis, Insights and Forecast 2021-2033
- 5.1. Market Analysis, Insights and Forecast - by Production Analysis
- 5.2. Market Analysis, Insights and Forecast - by Consumption Analysis
- 5.3. Market Analysis, Insights and Forecast - by Import Market Analysis (Value & Volume)
- 5.4. Market Analysis, Insights and Forecast - by Export Market Analysis (Value & Volume)
- 5.5. Market Analysis, Insights and Forecast - by Price Trend Analysis
- 5.6. Market Analysis, Insights and Forecast - by Region
- 5.6.1. North America
- 5.6.2. South America
- 5.6.3. Europe
- 5.6.4. Middle East & Africa
- 5.6.5. Asia Pacific
- 6. Global APAC Ammunition Industry Analysis, Insights and Forecast, 2021-2033
- 6.1. Market Analysis, Insights and Forecast - by Production Analysis
- 6.2. Market Analysis, Insights and Forecast - by Consumption Analysis
- 6.3. Market Analysis, Insights and Forecast - by Import Market Analysis (Value & Volume)
- 6.4. Market Analysis, Insights and Forecast - by Export Market Analysis (Value & Volume)
- 6.5. Market Analysis, Insights and Forecast - by Price Trend Analysis
- 7. North America APAC Ammunition Industry Analysis, Insights and Forecast, 2021-2033
- 7.1. Market Analysis, Insights and Forecast - by Production Analysis
- 7.2. Market Analysis, Insights and Forecast - by Consumption Analysis
- 7.3. Market Analysis, Insights and Forecast - by Import Market Analysis (Value & Volume)
- 7.4. Market Analysis, Insights and Forecast - by Export Market Analysis (Value & Volume)
- 7.5. Market Analysis, Insights and Forecast - by Price Trend Analysis
- 8. South America APAC Ammunition Industry Analysis, Insights and Forecast, 2021-2033
- 8.1. Market Analysis, Insights and Forecast - by Production Analysis
- 8.2. Market Analysis, Insights and Forecast - by Consumption Analysis
- 8.3. Market Analysis, Insights and Forecast - by Import Market Analysis (Value & Volume)
- 8.4. Market Analysis, Insights and Forecast - by Export Market Analysis (Value & Volume)
- 8.5. Market Analysis, Insights and Forecast - by Price Trend Analysis
- 9. Europe APAC Ammunition Industry Analysis, Insights and Forecast, 2021-2033
- 9.1. Market Analysis, Insights and Forecast - by Production Analysis
- 9.2. Market Analysis, Insights and Forecast - by Consumption Analysis
- 9.3. Market Analysis, Insights and Forecast - by Import Market Analysis (Value & Volume)
- 9.4. Market Analysis, Insights and Forecast - by Export Market Analysis (Value & Volume)
- 9.5. Market Analysis, Insights and Forecast - by Price Trend Analysis
- 10. Middle East & Africa APAC Ammunition Industry Analysis, Insights and Forecast, 2021-2033
- 10.1. Market Analysis, Insights and Forecast - by Production Analysis
- 10.2. Market Analysis, Insights and Forecast - by Consumption Analysis
- 10.3. Market Analysis, Insights and Forecast - by Import Market Analysis (Value & Volume)
- 10.4. Market Analysis, Insights and Forecast - by Export Market Analysis (Value & Volume)
- 10.5. Market Analysis, Insights and Forecast - by Price Trend Analysis
- 11. Asia Pacific APAC Ammunition Industry Analysis, Insights and Forecast, 2021-2033
- 11.1. Market Analysis, Insights and Forecast - by Production Analysis
- 11.2. Market Analysis, Insights and Forecast - by Consumption Analysis
- 11.3. Market Analysis, Insights and Forecast - by Import Market Analysis (Value & Volume)
- 11.4. Market Analysis, Insights and Forecast - by Export Market Analysis (Value & Volume)
- 11.5. Market Analysis, Insights and Forecast - by Price Trend Analysis
- 12. Competitive Analysis
- 12.1. Company Profiles
- 12.1.1 General Dynamics Corporation
- 12.1.1.1. Company Overview
- 12.1.1.2. Products
- 12.1.1.3. Company Financials
- 12.1.1.4. SWOT Analysis
- 12.1.2 Rheinmetall AG
- 12.1.2.1. Company Overview
- 12.1.2.2. Products
- 12.1.2.3. Company Financials
- 12.1.2.4. SWOT Analysis
- 12.1.3 Remington Arms Company LLC (Vista Outdoor Inc )
- 12.1.3.1. Company Overview
- 12.1.3.2. Products
- 12.1.3.3. Company Financials
- 12.1.3.4. SWOT Analysis
- 12.1.4 CBC Global Ammunition
- 12.1.4.1. Company Overview
- 12.1.4.2. Products
- 12.1.4.3. Company Financials
- 12.1.4.4. SWOT Analysis
- 12.1.5 Yantra India Limite
- 12.1.5.1. Company Overview
- 12.1.5.2. Products
- 12.1.5.3. Company Financials
- 12.1.5.4. SWOT Analysis
- 12.1.6 BAE Systems PLC
- 12.1.6.1. Company Overview
- 12.1.6.2. Products
- 12.1.6.3. Company Financials
- 12.1.6.4. SWOT Analysis
- 12.1.7 Winchester Ammunition (Olin Corporation)
- 12.1.7.1. Company Overview
- 12.1.7.2. Products
- 12.1.7.3. Company Financials
- 12.1.7.4. SWOT Analysis
- 12.1.8 Munitions India Limited
- 12.1.8.1. Company Overview
- 12.1.8.2. Products
- 12.1.8.3. Company Financials
- 12.1.8.4. SWOT Analysis
- 12.1.9 Singapore Technologies Engineering Ltd
- 12.1.9.1. Company Overview
- 12.1.9.2. Products
- 12.1.9.3. Company Financials
- 12.1.9.4. SWOT Analysis
- 12.1.10 Poongson Corporation
- 12.1.10.1. Company Overview
- 12.1.10.2. Products
- 12.1.10.3. Company Financials
- 12.1.10.4. SWOT Analysis
- 12.1.11 Hanwha Corporation
- 12.1.11.1. Company Overview
- 12.1.11.2. Products
- 12.1.11.3. Company Financials
- 12.1.11.4. SWOT Analysis
- 12.1.12 KNDS NV
- 12.1.12.1. Company Overview
- 12.1.12.2. Products
- 12.1.12.3. Company Financials
- 12.1.12.4. SWOT Analysis
- 12.1.1 General Dynamics Corporation
- 12.2. Market Entropy
- 12.2.1 Company's Key Areas Served
- 12.2.2 Recent Developments
- 12.3. Company Market Share Analysis 2025
- 12.3.1 Top 5 Companies Market Share Analysis
- 12.3.2 Top 3 Companies Market Share Analysis
- 12.4. List of Potential Customers
- 13. Research Methodology
List of Figures
- Figure 1: Global APAC Ammunition Industry Revenue Breakdown (Million, %) by Region 2025 & 2033
- Figure 2: North America APAC Ammunition Industry Revenue (Million), by Production Analysis 2025 & 2033
- Figure 3: North America APAC Ammunition Industry Revenue Share (%), by Production Analysis 2025 & 2033
- Figure 4: North America APAC Ammunition Industry Revenue (Million), by Consumption Analysis 2025 & 2033
- Figure 5: North America APAC Ammunition Industry Revenue Share (%), by Consumption Analysis 2025 & 2033
- Figure 6: North America APAC Ammunition Industry Revenue (Million), by Import Market Analysis (Value & Volume) 2025 & 2033
- Figure 7: North America APAC Ammunition Industry Revenue Share (%), by Import Market Analysis (Value & Volume) 2025 & 2033
- Figure 8: North America APAC Ammunition Industry Revenue (Million), by Export Market Analysis (Value & Volume) 2025 & 2033
- Figure 9: North America APAC Ammunition Industry Revenue Share (%), by Export Market Analysis (Value & Volume) 2025 & 2033
- Figure 10: North America APAC Ammunition Industry Revenue (Million), by Price Trend Analysis 2025 & 2033
- Figure 11: North America APAC Ammunition Industry Revenue Share (%), by Price Trend Analysis 2025 & 2033
- Figure 12: North America APAC Ammunition Industry Revenue (Million), by Country 2025 & 2033
- Figure 13: North America APAC Ammunition Industry Revenue Share (%), by Country 2025 & 2033
- Figure 14: South America APAC Ammunition Industry Revenue (Million), by Production Analysis 2025 & 2033
- Figure 15: South America APAC Ammunition Industry Revenue Share (%), by Production Analysis 2025 & 2033
- Figure 16: South America APAC Ammunition Industry Revenue (Million), by Consumption Analysis 2025 & 2033
- Figure 17: South America APAC Ammunition Industry Revenue Share (%), by Consumption Analysis 2025 & 2033
- Figure 18: South America APAC Ammunition Industry Revenue (Million), by Import Market Analysis (Value & Volume) 2025 & 2033
- Figure 19: South America APAC Ammunition Industry Revenue Share (%), by Import Market Analysis (Value & Volume) 2025 & 2033
- Figure 20: South America APAC Ammunition Industry Revenue (Million), by Export Market Analysis (Value & Volume) 2025 & 2033
- Figure 21: South America APAC Ammunition Industry Revenue Share (%), by Export Market Analysis (Value & Volume) 2025 & 2033
- Figure 22: South America APAC Ammunition Industry Revenue (Million), by Price Trend Analysis 2025 & 2033
- Figure 23: South America APAC Ammunition Industry Revenue Share (%), by Price Trend Analysis 2025 & 2033
- Figure 24: South America APAC Ammunition Industry Revenue (Million), by Country 2025 & 2033
- Figure 25: South America APAC Ammunition Industry Revenue Share (%), by Country 2025 & 2033
- Figure 26: Europe APAC Ammunition Industry Revenue (Million), by Production Analysis 2025 & 2033
- Figure 27: Europe APAC Ammunition Industry Revenue Share (%), by Production Analysis 2025 & 2033
- Figure 28: Europe APAC Ammunition Industry Revenue (Million), by Consumption Analysis 2025 & 2033
- Figure 29: Europe APAC Ammunition Industry Revenue Share (%), by Consumption Analysis 2025 & 2033
- Figure 30: Europe APAC Ammunition Industry Revenue (Million), by Import Market Analysis (Value & Volume) 2025 & 2033
- Figure 31: Europe APAC Ammunition Industry Revenue Share (%), by Import Market Analysis (Value & Volume) 2025 & 2033
- Figure 32: Europe APAC Ammunition Industry Revenue (Million), by Export Market Analysis (Value & Volume) 2025 & 2033
- Figure 33: Europe APAC Ammunition Industry Revenue Share (%), by Export Market Analysis (Value & Volume) 2025 & 2033
- Figure 34: Europe APAC Ammunition Industry Revenue (Million), by Price Trend Analysis 2025 & 2033
- Figure 35: Europe APAC Ammunition Industry Revenue Share (%), by Price Trend Analysis 2025 & 2033
- Figure 36: Europe APAC Ammunition Industry Revenue (Million), by Country 2025 & 2033
- Figure 37: Europe APAC Ammunition Industry Revenue Share (%), by Country 2025 & 2033
- Figure 38: Middle East & Africa APAC Ammunition Industry Revenue (Million), by Production Analysis 2025 & 2033
- Figure 39: Middle East & Africa APAC Ammunition Industry Revenue Share (%), by Production Analysis 2025 & 2033
- Figure 40: Middle East & Africa APAC Ammunition Industry Revenue (Million), by Consumption Analysis 2025 & 2033
- Figure 41: Middle East & Africa APAC Ammunition Industry Revenue Share (%), by Consumption Analysis 2025 & 2033
- Figure 42: Middle East & Africa APAC Ammunition Industry Revenue (Million), by Import Market Analysis (Value & Volume) 2025 & 2033
- Figure 43: Middle East & Africa APAC Ammunition Industry Revenue Share (%), by Import Market Analysis (Value & Volume) 2025 & 2033
- Figure 44: Middle East & Africa APAC Ammunition Industry Revenue (Million), by Export Market Analysis (Value & Volume) 2025 & 2033
- Figure 45: Middle East & Africa APAC Ammunition Industry Revenue Share (%), by Export Market Analysis (Value & Volume) 2025 & 2033
- Figure 46: Middle East & Africa APAC Ammunition Industry Revenue (Million), by Price Trend Analysis 2025 & 2033
- Figure 47: Middle East & Africa APAC Ammunition Industry Revenue Share (%), by Price Trend Analysis 2025 & 2033
- Figure 48: Middle East & Africa APAC Ammunition Industry Revenue (Million), by Country 2025 & 2033
- Figure 49: Middle East & Africa APAC Ammunition Industry Revenue Share (%), by Country 2025 & 2033
- Figure 50: Asia Pacific APAC Ammunition Industry Revenue (Million), by Production Analysis 2025 & 2033
- Figure 51: Asia Pacific APAC Ammunition Industry Revenue Share (%), by Production Analysis 2025 & 2033
- Figure 52: Asia Pacific APAC Ammunition Industry Revenue (Million), by Consumption Analysis 2025 & 2033
- Figure 53: Asia Pacific APAC Ammunition Industry Revenue Share (%), by Consumption Analysis 2025 & 2033
- Figure 54: Asia Pacific APAC Ammunition Industry Revenue (Million), by Import Market Analysis (Value & Volume) 2025 & 2033
- Figure 55: Asia Pacific APAC Ammunition Industry Revenue Share (%), by Import Market Analysis (Value & Volume) 2025 & 2033
- Figure 56: Asia Pacific APAC Ammunition Industry Revenue (Million), by Export Market Analysis (Value & Volume) 2025 & 2033
- Figure 57: Asia Pacific APAC Ammunition Industry Revenue Share (%), by Export Market Analysis (Value & Volume) 2025 & 2033
- Figure 58: Asia Pacific APAC Ammunition Industry Revenue (Million), by Price Trend Analysis 2025 & 2033
- Figure 59: Asia Pacific APAC Ammunition Industry Revenue Share (%), by Price Trend Analysis 2025 & 2033
- Figure 60: Asia Pacific APAC Ammunition Industry Revenue (Million), by Country 2025 & 2033
- Figure 61: Asia Pacific APAC Ammunition Industry Revenue Share (%), by Country 2025 & 2033
List of Tables
- Table 1: Global APAC Ammunition Industry Revenue Million Forecast, by Production Analysis 2020 & 2033
- Table 2: Global APAC Ammunition Industry Revenue Million Forecast, by Consumption Analysis 2020 & 2033
- Table 3: Global APAC Ammunition Industry Revenue Million Forecast, by Import Market Analysis (Value & Volume) 2020 & 2033
- Table 4: Global APAC Ammunition Industry Revenue Million Forecast, by Export Market Analysis (Value & Volume) 2020 & 2033
- Table 5: Global APAC Ammunition Industry Revenue Million Forecast, by Price Trend Analysis 2020 & 2033
- Table 6: Global APAC Ammunition Industry Revenue Million Forecast, by Region 2020 & 2033
- Table 7: Global APAC Ammunition Industry Revenue Million Forecast, by Production Analysis 2020 & 2033
- Table 8: Global APAC Ammunition Industry Revenue Million Forecast, by Consumption Analysis 2020 & 2033
- Table 9: Global APAC Ammunition Industry Revenue Million Forecast, by Import Market Analysis (Value & Volume) 2020 & 2033
- Table 10: Global APAC Ammunition Industry Revenue Million Forecast, by Export Market Analysis (Value & Volume) 2020 & 2033
- Table 11: Global APAC Ammunition Industry Revenue Million Forecast, by Price Trend Analysis 2020 & 2033
- Table 12: Global APAC Ammunition Industry Revenue Million Forecast, by Country 2020 & 2033
- Table 13: United States APAC Ammunition Industry Revenue (Million) Forecast, by Application 2020 & 2033
- Table 14: Canada APAC Ammunition Industry Revenue (Million) Forecast, by Application 2020 & 2033
- Table 15: Mexico APAC Ammunition Industry Revenue (Million) Forecast, by Application 2020 & 2033
- Table 16: Global APAC Ammunition Industry Revenue Million Forecast, by Production Analysis 2020 & 2033
- Table 17: Global APAC Ammunition Industry Revenue Million Forecast, by Consumption Analysis 2020 & 2033
- Table 18: Global APAC Ammunition Industry Revenue Million Forecast, by Import Market Analysis (Value & Volume) 2020 & 2033
- Table 19: Global APAC Ammunition Industry Revenue Million Forecast, by Export Market Analysis (Value & Volume) 2020 & 2033
- Table 20: Global APAC Ammunition Industry Revenue Million Forecast, by Price Trend Analysis 2020 & 2033
- Table 21: Global APAC Ammunition Industry Revenue Million Forecast, by Country 2020 & 2033
- Table 22: Brazil APAC Ammunition Industry Revenue (Million) Forecast, by Application 2020 & 2033
- Table 23: Argentina APAC Ammunition Industry Revenue (Million) Forecast, by Application 2020 & 2033
- Table 24: Rest of South America APAC Ammunition Industry Revenue (Million) Forecast, by Application 2020 & 2033
- Table 25: Global APAC Ammunition Industry Revenue Million Forecast, by Production Analysis 2020 & 2033
- Table 26: Global APAC Ammunition Industry Revenue Million Forecast, by Consumption Analysis 2020 & 2033
- Table 27: Global APAC Ammunition Industry Revenue Million Forecast, by Import Market Analysis (Value & Volume) 2020 & 2033
- Table 28: Global APAC Ammunition Industry Revenue Million Forecast, by Export Market Analysis (Value & Volume) 2020 & 2033
- Table 29: Global APAC Ammunition Industry Revenue Million Forecast, by Price Trend Analysis 2020 & 2033
- Table 30: Global APAC Ammunition Industry Revenue Million Forecast, by Country 2020 & 2033
- Table 31: United Kingdom APAC Ammunition Industry Revenue (Million) Forecast, by Application 2020 & 2033
- Table 32: Germany APAC Ammunition Industry Revenue (Million) Forecast, by Application 2020 & 2033
- Table 33: France APAC Ammunition Industry Revenue (Million) Forecast, by Application 2020 & 2033
- Table 34: Italy APAC Ammunition Industry Revenue (Million) Forecast, by Application 2020 & 2033
- Table 35: Spain APAC Ammunition Industry Revenue (Million) Forecast, by Application 2020 & 2033
- Table 36: Russia APAC Ammunition Industry Revenue (Million) Forecast, by Application 2020 & 2033
- Table 37: Benelux APAC Ammunition Industry Revenue (Million) Forecast, by Application 2020 & 2033
- Table 38: Nordics APAC Ammunition Industry Revenue (Million) Forecast, by Application 2020 & 2033
- Table 39: Rest of Europe APAC Ammunition Industry Revenue (Million) Forecast, by Application 2020 & 2033
- Table 40: Global APAC Ammunition Industry Revenue Million Forecast, by Production Analysis 2020 & 2033
- Table 41: Global APAC Ammunition Industry Revenue Million Forecast, by Consumption Analysis 2020 & 2033
- Table 42: Global APAC Ammunition Industry Revenue Million Forecast, by Import Market Analysis (Value & Volume) 2020 & 2033
- Table 43: Global APAC Ammunition Industry Revenue Million Forecast, by Export Market Analysis (Value & Volume) 2020 & 2033
- Table 44: Global APAC Ammunition Industry Revenue Million Forecast, by Price Trend Analysis 2020 & 2033
- Table 45: Global APAC Ammunition Industry Revenue Million Forecast, by Country 2020 & 2033
- Table 46: Turkey APAC Ammunition Industry Revenue (Million) Forecast, by Application 2020 & 2033
- Table 47: Israel APAC Ammunition Industry Revenue (Million) Forecast, by Application 2020 & 2033
- Table 48: GCC APAC Ammunition Industry Revenue (Million) Forecast, by Application 2020 & 2033
- Table 49: North Africa APAC Ammunition Industry Revenue (Million) Forecast, by Application 2020 & 2033
- Table 50: South Africa APAC Ammunition Industry Revenue (Million) Forecast, by Application 2020 & 2033
- Table 51: Rest of Middle East & Africa APAC Ammunition Industry Revenue (Million) Forecast, by Application 2020 & 2033
- Table 52: Global APAC Ammunition Industry Revenue Million Forecast, by Production Analysis 2020 & 2033
- Table 53: Global APAC Ammunition Industry Revenue Million Forecast, by Consumption Analysis 2020 & 2033
- Table 54: Global APAC Ammunition Industry Revenue Million Forecast, by Import Market Analysis (Value & Volume) 2020 & 2033
- Table 55: Global APAC Ammunition Industry Revenue Million Forecast, by Export Market Analysis (Value & Volume) 2020 & 2033
- Table 56: Global APAC Ammunition Industry Revenue Million Forecast, by Price Trend Analysis 2020 & 2033
- Table 57: Global APAC Ammunition Industry Revenue Million Forecast, by Country 2020 & 2033
- Table 58: China APAC Ammunition Industry Revenue (Million) Forecast, by Application 2020 & 2033
- Table 59: India APAC Ammunition Industry Revenue (Million) Forecast, by Application 2020 & 2033
- Table 60: Japan APAC Ammunition Industry Revenue (Million) Forecast, by Application 2020 & 2033
- Table 61: South Korea APAC Ammunition Industry Revenue (Million) Forecast, by Application 2020 & 2033
- Table 62: ASEAN APAC Ammunition Industry Revenue (Million) Forecast, by Application 2020 & 2033
- Table 63: Oceania APAC Ammunition Industry Revenue (Million) Forecast, by Application 2020 & 2033
- Table 64: Rest of Asia Pacific APAC Ammunition Industry Revenue (Million) Forecast, by Application 2020 & 2033
Frequently Asked Questions
1. What is the projected Compound Annual Growth Rate (CAGR) of the APAC Ammunition Industry?
The projected CAGR is approximately 4.83%.
2. Which companies are prominent players in the APAC Ammunition Industry?
Key companies in the market include General Dynamics Corporation, Rheinmetall AG, Remington Arms Company LLC (Vista Outdoor Inc ), CBC Global Ammunition, Yantra India Limite, BAE Systems PLC, Winchester Ammunition (Olin Corporation), Munitions India Limited, Singapore Technologies Engineering Ltd, Poongson Corporation, Hanwha Corporation, KNDS NV.
3. What are the main segments of the APAC Ammunition Industry?
The market segments include Production Analysis, Consumption Analysis, Import Market Analysis (Value & Volume), Export Market Analysis (Value & Volume), Price Trend Analysis.
4. Can you provide details about the market size?
The market size is estimated to be USD 2.57 Million as of 2022.
5. What are some drivers contributing to market growth?
; Increasing Number Of Air Passengers; Use Of Portable Electronic Devices.
6. What are the notable trends driving market growth?
Military Segment is Expected to Dominate the Market During the Forecast Period.
7. Are there any restraints impacting market growth?
; High Cost Of Connectivity Equipments.
8. Can you provide examples of recent developments in the market?
February 2024: China showcased its newly developed ASN-301 loitering munition in Saudi Arabia. Designed to infiltrate adversary airspace, the ASN-301's main function is to loiter until it picks up a radar signal. Upon detection, the ASN-301 targets the signal and precisely strikes. Equipped with a warhead containing 7,000 fragments, the munition is activated by a proximity laser fuse, ensuring a lethal radius of 20 meters.
9. What pricing options are available for accessing the report?
Pricing options include single-user, multi-user, and enterprise licenses priced at USD 4750, USD 4950, and USD 6800 respectively.
10. Is the market size provided in terms of value or volume?
The market size is provided in terms of value, measured in Million.
11. Are there any specific market keywords associated with the report?
Yes, the market keyword associated with the report is "APAC Ammunition Industry," which aids in identifying and referencing the specific market segment covered.
12. How do I determine which pricing option suits my needs best?
The pricing options vary based on user requirements and access needs. Individual users may opt for single-user licenses, while businesses requiring broader access may choose multi-user or enterprise licenses for cost-effective access to the report.
13. Are there any additional resources or data provided in the APAC Ammunition Industry report?
While the report offers comprehensive insights, it's advisable to review the specific contents or supplementary materials provided to ascertain if additional resources or data are available.
14. How can I stay updated on further developments or reports in the APAC Ammunition Industry?
To stay informed about further developments, trends, and reports in the APAC Ammunition Industry, consider subscribing to industry newsletters, following relevant companies and organizations, or regularly checking reputable industry news sources and publications.
Methodology
Step 1 - Identification of Relevant Samples Size from Population Database


Step 2 - Approaches for Defining Global Market Size (Value, Volume* & Price*)

Note*: In applicable scenarios
Step 3 - Data Sources
Primary Research
- Web Analytics
- Survey Reports
- Research Institute
- Latest Research Reports
- Opinion Leaders
Secondary Research
- Annual Reports
- White Paper
- Latest Press Release
- Industry Association
- Paid Database
- Investor Presentations

Step 4 - Data Triangulation
Involves using different sources of information in order to increase the validity of a study
These sources are likely to be stakeholders in a program - participants, other researchers, program staff, other community members, and so on.
Then we put all data in single framework & apply various statistical tools to find out the dynamic on the market.
During the analysis stage, feedback from the stakeholder groups would be compared to determine areas of agreement as well as areas of divergence