

Key Insights
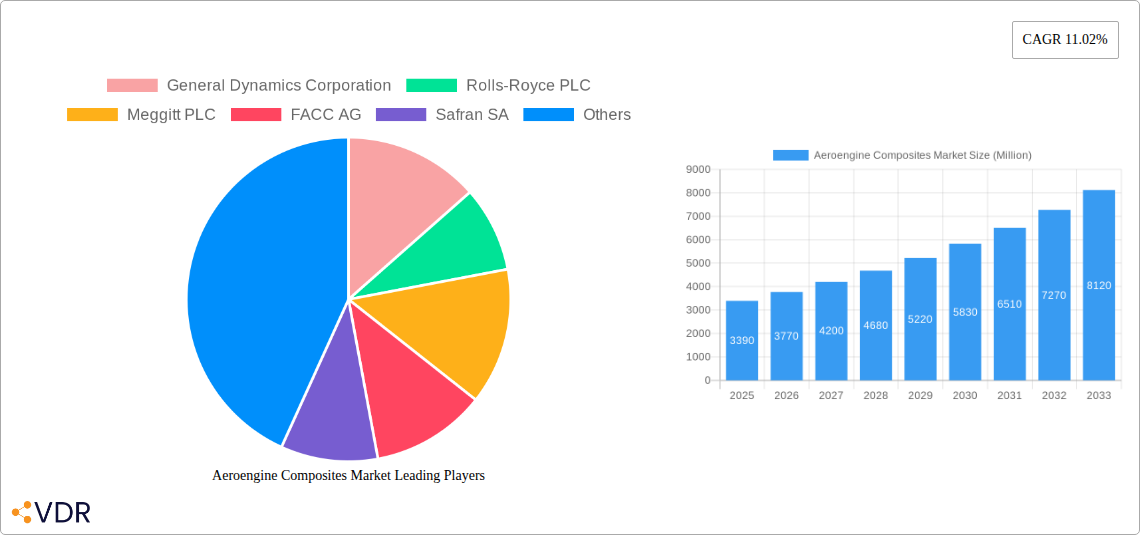
The aeroengine composites market, valued at $3.39 billion in 2025, is projected to experience robust growth, driven by the increasing demand for lightweight yet high-strength materials in the aerospace industry. This demand is fueled primarily by the ongoing trend toward fuel-efficient aircraft, a critical factor for airlines aiming to reduce operational costs and meet stringent environmental regulations. The market's expansion is further propelled by advancements in composite materials technology, leading to improved performance characteristics like enhanced durability and resistance to extreme temperatures and pressures encountered during flight. Key segments within the market include fan blades, fan cases, guide vanes, and shrouds, all of which are witnessing significant adoption in commercial, military, and general aviation aircraft. Leading manufacturers such as General Dynamics, Rolls-Royce, and Safran are heavily invested in research and development, contributing to innovation and market expansion. Geographical growth is anticipated across regions, with North America and Europe holding significant market share, driven by established aerospace manufacturing hubs and substantial government investments in aerospace research and development. Asia-Pacific is also expected to demonstrate significant growth potential fueled by increasing aircraft manufacturing and fleet expansion in the region.
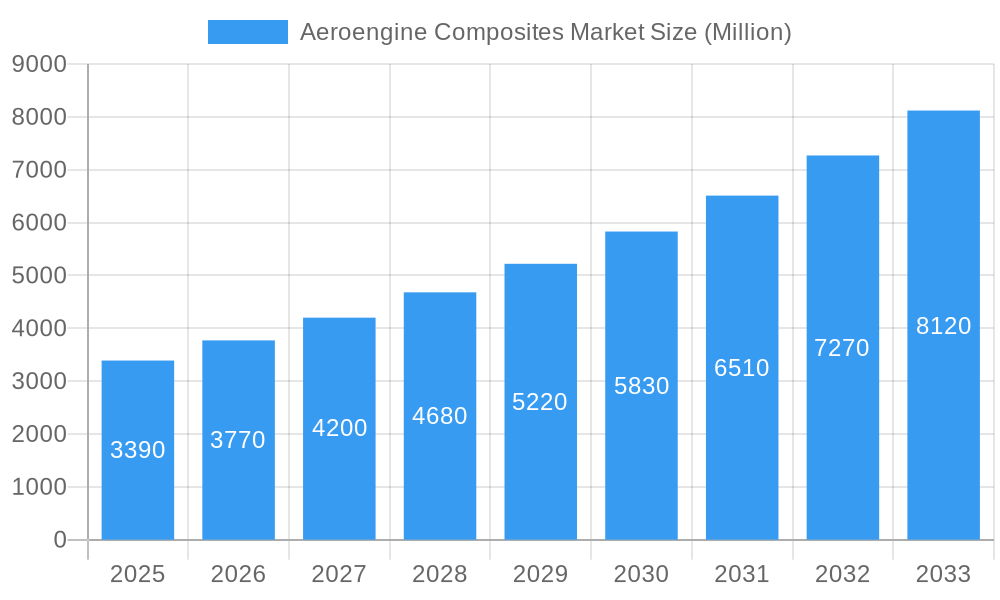
Aeroengine Composites Market Market Size (In Billion)
However, the market's growth trajectory is not without challenges. High manufacturing costs associated with composite materials and the complex processes involved in their integration into aeroengines remain significant restraints. Furthermore, the stringent quality control and certification procedures necessary for aerospace applications can present hurdles. Despite these challenges, the long-term outlook for the aeroengine composites market remains positive, with continuous technological advancements and increasing demand for fuel-efficient aircraft expected to propel substantial growth over the forecast period (2025-2033). The market is likely to witness increased consolidation as major players seek to enhance their market position and technological capabilities through mergers, acquisitions, and strategic partnerships.
Aeroengine Composites Market Company Market Share
This comprehensive report provides an in-depth analysis of the Aeroengine Composites Market, encompassing market dynamics, growth trends, regional dominance, product landscape, key players, and future outlook. The report covers the parent market of aerospace composites and the child market of aeroengine composites, offering a granular view of this dynamic sector. The study period spans 2019-2033, with 2025 as the base and estimated year. The report is invaluable for industry professionals, investors, and strategic decision-makers seeking to understand and capitalize on opportunities within this high-growth market. The market size is projected to reach xx Million by 2033.
Aeroengine Composites Market Dynamics & Structure
The Aeroengine Composites market is characterized by a moderately concentrated structure, with key players like General Dynamics Corporation, Rolls-Royce PLC, Meggitt PLC, and Safran SA holding significant market share. Technological innovation, particularly in materials science and manufacturing processes, is a primary driver. Stringent regulatory frameworks governing aviation safety influence material selection and manufacturing standards. Competition from alternative materials like advanced metals presents a challenge, while the increasing demand for fuel-efficient aircraft fuels market growth. Mergers and acquisitions (M&A) activity has been moderate, with xx deals recorded between 2019 and 2024, indicating a trend towards consolidation.
- Market Concentration: Moderately concentrated, with top 5 players holding approximately xx% market share in 2024.
- Technological Innovation: Focus on lightweight, high-strength composites like carbon fiber reinforced polymers (CFRP) and ceramic matrix composites (CMCs).
- Regulatory Landscape: Stringent safety regulations drive demand for high-quality, reliable composite materials.
- Competitive Substitutes: Advanced metal alloys pose a competitive threat, but composites offer advantages in weight and fuel efficiency.
- End-User Demographics: Primarily driven by commercial and military aircraft manufacturers.
- M&A Activity: xx M&A deals recorded between 2019 and 2024, indicating a trend of consolidation within the industry.
Aeroengine Composites Market Growth Trends & Insights
The Aeroengine Composites market has witnessed significant growth over the past few years, driven by increasing demand for fuel-efficient aircraft and the inherent advantages of composites in terms of weight reduction and performance enhancement. The market size expanded from xx Million in 2019 to xx Million in 2024, exhibiting a CAGR of xx%. This growth is expected to continue, with a projected CAGR of xx% from 2025 to 2033, reaching xx Million by 2033. Technological advancements like the adoption of CMCs and advancements in manufacturing processes are accelerating adoption rates. Shifting consumer preferences towards eco-friendly aviation further boost market growth. Market penetration of composites in aeroengines is expected to reach xx% by 2033.
Dominant Regions, Countries, or Segments in Aeroengine Composites Market
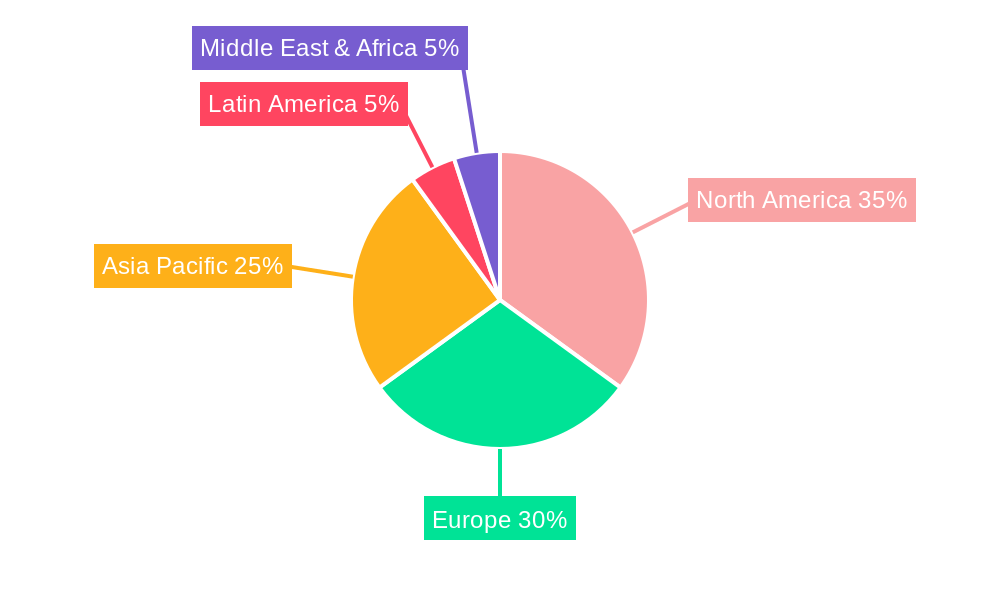
North America currently holds the largest market share in the aeroengine composites market, driven by a strong aerospace manufacturing base and significant investments in research and development. Europe follows closely, fueled by a large commercial aircraft manufacturing sector. Within the component segments, Fan Blades dominate market share, followed by Fan Cases and Guide Vanes. The Commercial Aircraft segment leads the application-based market due to high production volume.
- Key Drivers (North America): Strong aerospace industry, substantial R&D investment, favorable government policies.
- Key Drivers (Europe): Robust commercial aircraft manufacturing, skilled workforce, technological advancements.
- Dominant Component Segment: Fan Blades (xx% market share in 2024) due to high demand for lightweight and high-performance components.
- Dominant Application Segment: Commercial Aircraft (xx% market share in 2024) driven by high production volumes and increasing fuel efficiency requirements.
Aeroengine Composites Market Product Landscape
The Aeroengine Composites market offers a wide range of products, including fan blades, fan cases, guide vanes, shrouds, and other components, each designed for specific applications and performance requirements. Innovations focus on advanced materials like CMCs, offering superior high-temperature resistance and improved durability. Unique selling propositions include enhanced strength-to-weight ratios, improved fuel efficiency, and extended component lifespan. Advanced manufacturing techniques like automated fiber placement and 3D weaving are further enhancing product quality and reducing manufacturing costs.
Key Drivers, Barriers & Challenges in Aeroengine Composites Market
Key Drivers:
- Increasing demand for fuel-efficient aircraft.
- Growing adoption of lightweight composite materials.
- Technological advancements in material science and manufacturing processes.
- Favorable government regulations and incentives for sustainable aviation.
Key Challenges & Restraints:
- High initial material and manufacturing costs.
- Complex design and manufacturing processes.
- Potential supply chain disruptions affecting raw material availability.
- Stringent certification and qualification requirements impacting time-to-market.
Emerging Opportunities in Aeroengine Composites Market
- Growing demand for sustainable aviation fuels is driving the need for lightweight composites.
- Expansion of the general aviation and UAV sectors offer new applications.
- Advancements in materials like CMCs offer opportunities for high-temperature applications.
- Development of innovative manufacturing processes like additive manufacturing holds potential.
Growth Accelerators in the Aeroengine Composites Market Industry
Technological breakthroughs in materials science, especially in the development of higher-performance CMCs, are driving the market's growth. Strategic partnerships between material suppliers and engine manufacturers facilitate technology transfer and product development. Expanding into new markets like unmanned aerial vehicles (UAVs) and electric aircraft offer significant growth potential.
Key Players Shaping the Aeroengine Composites Market Market
Notable Milestones in Aeroengine Composites Market Sector
- November 2021: Safran Aircraft Engines and Albany International Corp. extended their partnership to 2046, focusing on high-technology composite parts.
- July 2021: Pratt & Whitney opened a new CMCs Center of Excellence in Carlsbad, California, accelerating CMC development and production for aerospace applications.
In-Depth Aeroengine Composites Market Market Outlook
The Aeroengine Composites market is poised for continued strong growth, driven by technological advancements, increasing demand for fuel-efficient aircraft, and expansion into new applications. Strategic partnerships and investments in R&D will further fuel innovation and market expansion. The market's future potential is substantial, with opportunities for companies to capitalize on the growing demand for lightweight, high-performance composite materials in the aerospace industry.
Aeroengine Composites Market Segmentation
-
1. Application
- 1.1. Commercial Aircraft
- 1.2. Military Aircraft
- 1.3. General Aviation Aircraft
-
2. Component
- 2.1. Fan Blades
- 2.2. Fan Case
- 2.3. Guide Vanes
- 2.4. Shrouds
- 2.5. Other Components
Aeroengine Composites Market Segmentation By Geography
-
1. North America
- 1.1. United States
-
2. Application
- 2.1. Canada
- 3. Application
-
4. Europe
- 4.1. United Kingdom
-
5. Application
- 5.1. France
-
6. Application
- 6.1. Germany
-
7. Application
- 7.1. Rest of Europe
- 8. Application
-
9. Asia Pacific
- 9.1. China
-
10. Application
- 10.1. India
-
11. Application
- 11.1. Japan
-
12. Application
- 12.1. Rest of Asia Pacific
- 13. Application
-
14. Latin America
- 14.1. Brazil
-
15. Application
- 15.1. Rest of Latin America
- 16. Application
-
17. Middle East and Africa
- 17.1. Saudi Arabia
-
18. Application
- 18.1. United Arab Emirates
-
19. Application
- 19.1. Egypt
-
20. Application
- 20.1. Rest of Middle East and Africa
- 21. Application
Aeroengine Composites Market Regional Market Share
Geographic Coverage of Aeroengine Composites Market
Aeroengine Composites Market REPORT HIGHLIGHTS
| Aspects | Details |
|---|---|
| Study Period | 2020-2034 |
| Base Year | 2025 |
| Estimated Year | 2026 |
| Forecast Period | 2026-2034 |
| Historical Period | 2020-2025 |
| Growth Rate | CAGR of 11.02% from 2020-2034 |
| Segmentation |
|
Table of Contents
- 1. Introduction
- 1.1. Research Scope
- 1.2. Market Segmentation
- 1.3. Research Objective
- 1.4. Definitions and Assumptions
- 2. Executive Summary
- 2.1. Market Snapshot
- 3. Market Dynamics
- 3.1. Market Drivers
- 3.2. Market Restrains
- 3.3. Market Trends
- 3.4. Market Opportunities
- 4. Market Factor Analysis
- 4.1. Porters Five Forces
- 4.1.1. Bargaining Power of Suppliers
- 4.1.2. Bargaining Power of Buyers
- 4.1.3. Threat of New Entrants
- 4.1.4. Threat of Substitutes
- 4.1.5. Competitive Rivalry
- 4.2. PESTEL analysis
- 4.3. BCG Analysis
- 4.3.1. Stars (High Growth, High Market Share)
- 4.3.2. Cash Cows (Low Growth, High Market Share)
- 4.3.3. Question Mark (High Growth, Low Market Share)
- 4.3.4. Dogs (Low Growth, Low Market Share)
- 4.4. Ansoff Matrix Analysis
- 4.5. Supply Chain Analysis
- 4.6. Regulatory Landscape
- 4.7. Current Market Potential and Opportunity Assessment (TAM–SAM–SOM Framework)
- 4.8. VDR Analyst Note
- 4.1. Porters Five Forces
- 5. Market Analysis, Insights and Forecast 2021-2033
- 5.1. Market Analysis, Insights and Forecast - by Application
- 5.1.1. Commercial Aircraft
- 5.1.2. Military Aircraft
- 5.1.3. General Aviation Aircraft
- 5.2. Market Analysis, Insights and Forecast - by Component
- 5.2.1. Fan Blades
- 5.2.2. Fan Case
- 5.2.3. Guide Vanes
- 5.2.4. Shrouds
- 5.2.5. Other Components
- 5.3. Market Analysis, Insights and Forecast - by Region
- 5.3.1. North America
- 5.3.2. Application
- 5.3.3. Application
- 5.3.4. Europe
- 5.3.5. Application
- 5.3.6. Application
- 5.3.7. Application
- 5.3.8. Application
- 5.3.9. Asia Pacific
- 5.3.10. Application
- 5.3.11. Application
- 5.3.12. Application
- 5.3.13. Application
- 5.3.14. Latin America
- 5.3.15. Application
- 5.3.16. Application
- 5.3.17. Middle East and Africa
- 5.3.18. Application
- 5.3.19. Application
- 5.3.20. Application
- 5.3.21. Application
- 5.1. Market Analysis, Insights and Forecast - by Application
- 6. Global Aeroengine Composites Market Analysis, Insights and Forecast, 2021-2033
- 6.1. Market Analysis, Insights and Forecast - by Application
- 6.1.1. Commercial Aircraft
- 6.1.2. Military Aircraft
- 6.1.3. General Aviation Aircraft
- 6.2. Market Analysis, Insights and Forecast - by Component
- 6.2.1. Fan Blades
- 6.2.2. Fan Case
- 6.2.3. Guide Vanes
- 6.2.4. Shrouds
- 6.2.5. Other Components
- 6.1. Market Analysis, Insights and Forecast - by Application
- 7. North America Aeroengine Composites Market Analysis, Insights and Forecast, 2021-2033
- 7.1. Market Analysis, Insights and Forecast - by Application
- 7.1.1. Commercial Aircraft
- 7.1.2. Military Aircraft
- 7.1.3. General Aviation Aircraft
- 7.2. Market Analysis, Insights and Forecast - by Component
- 7.2.1. Fan Blades
- 7.2.2. Fan Case
- 7.2.3. Guide Vanes
- 7.2.4. Shrouds
- 7.2.5. Other Components
- 7.1. Market Analysis, Insights and Forecast - by Application
- 8. Application Aeroengine Composites Market Analysis, Insights and Forecast, 2021-2033
- 8.1. Market Analysis, Insights and Forecast - by Application
- 8.1.1. Commercial Aircraft
- 8.1.2. Military Aircraft
- 8.1.3. General Aviation Aircraft
- 8.2. Market Analysis, Insights and Forecast - by Component
- 8.2.1. Fan Blades
- 8.2.2. Fan Case
- 8.2.3. Guide Vanes
- 8.2.4. Shrouds
- 8.2.5. Other Components
- 8.1. Market Analysis, Insights and Forecast - by Application
- 9. Application Aeroengine Composites Market Analysis, Insights and Forecast, 2021-2033
- 9.1. Market Analysis, Insights and Forecast - by Application
- 9.1.1. Commercial Aircraft
- 9.1.2. Military Aircraft
- 9.1.3. General Aviation Aircraft
- 9.2. Market Analysis, Insights and Forecast - by Component
- 9.2.1. Fan Blades
- 9.2.2. Fan Case
- 9.2.3. Guide Vanes
- 9.2.4. Shrouds
- 9.2.5. Other Components
- 9.1. Market Analysis, Insights and Forecast - by Application
- 10. Europe Aeroengine Composites Market Analysis, Insights and Forecast, 2021-2033
- 10.1. Market Analysis, Insights and Forecast - by Application
- 10.1.1. Commercial Aircraft
- 10.1.2. Military Aircraft
- 10.1.3. General Aviation Aircraft
- 10.2. Market Analysis, Insights and Forecast - by Component
- 10.2.1. Fan Blades
- 10.2.2. Fan Case
- 10.2.3. Guide Vanes
- 10.2.4. Shrouds
- 10.2.5. Other Components
- 10.1. Market Analysis, Insights and Forecast - by Application
- 11. Application Aeroengine Composites Market Analysis, Insights and Forecast, 2021-2033
- 11.1. Market Analysis, Insights and Forecast - by Application
- 11.1.1. Commercial Aircraft
- 11.1.2. Military Aircraft
- 11.1.3. General Aviation Aircraft
- 11.2. Market Analysis, Insights and Forecast - by Component
- 11.2.1. Fan Blades
- 11.2.2. Fan Case
- 11.2.3. Guide Vanes
- 11.2.4. Shrouds
- 11.2.5. Other Components
- 11.1. Market Analysis, Insights and Forecast - by Application
- 12. Application Aeroengine Composites Market Analysis, Insights and Forecast, 2021-2033
- 12.1. Market Analysis, Insights and Forecast - by Application
- 12.1.1. Commercial Aircraft
- 12.1.2. Military Aircraft
- 12.1.3. General Aviation Aircraft
- 12.2. Market Analysis, Insights and Forecast - by Component
- 12.2.1. Fan Blades
- 12.2.2. Fan Case
- 12.2.3. Guide Vanes
- 12.2.4. Shrouds
- 12.2.5. Other Components
- 12.1. Market Analysis, Insights and Forecast - by Application
- 13. Application Aeroengine Composites Market Analysis, Insights and Forecast, 2021-2033
- 13.1. Market Analysis, Insights and Forecast - by Application
- 13.1.1. Commercial Aircraft
- 13.1.2. Military Aircraft
- 13.1.3. General Aviation Aircraft
- 13.2. Market Analysis, Insights and Forecast - by Component
- 13.2.1. Fan Blades
- 13.2.2. Fan Case
- 13.2.3. Guide Vanes
- 13.2.4. Shrouds
- 13.2.5. Other Components
- 13.1. Market Analysis, Insights and Forecast - by Application
- 14. Application Aeroengine Composites Market Analysis, Insights and Forecast, 2021-2033
- 14.1. Market Analysis, Insights and Forecast - by Application
- 14.1.1. Commercial Aircraft
- 14.1.2. Military Aircraft
- 14.1.3. General Aviation Aircraft
- 14.2. Market Analysis, Insights and Forecast - by Component
- 14.2.1. Fan Blades
- 14.2.2. Fan Case
- 14.2.3. Guide Vanes
- 14.2.4. Shrouds
- 14.2.5. Other Components
- 14.1. Market Analysis, Insights and Forecast - by Application
- 15. Asia Pacific Aeroengine Composites Market Analysis, Insights and Forecast, 2021-2033
- 15.1. Market Analysis, Insights and Forecast - by Application
- 15.1.1. Commercial Aircraft
- 15.1.2. Military Aircraft
- 15.1.3. General Aviation Aircraft
- 15.2. Market Analysis, Insights and Forecast - by Component
- 15.2.1. Fan Blades
- 15.2.2. Fan Case
- 15.2.3. Guide Vanes
- 15.2.4. Shrouds
- 15.2.5. Other Components
- 15.1. Market Analysis, Insights and Forecast - by Application
- 16. Application Aeroengine Composites Market Analysis, Insights and Forecast, 2021-2033
- 16.1. Market Analysis, Insights and Forecast - by Application
- 16.1.1. Commercial Aircraft
- 16.1.2. Military Aircraft
- 16.1.3. General Aviation Aircraft
- 16.2. Market Analysis, Insights and Forecast - by Component
- 16.2.1. Fan Blades
- 16.2.2. Fan Case
- 16.2.3. Guide Vanes
- 16.2.4. Shrouds
- 16.2.5. Other Components
- 16.1. Market Analysis, Insights and Forecast - by Application
- 17. Application Aeroengine Composites Market Analysis, Insights and Forecast, 2021-2033
- 17.1. Market Analysis, Insights and Forecast - by Application
- 17.1.1. Commercial Aircraft
- 17.1.2. Military Aircraft
- 17.1.3. General Aviation Aircraft
- 17.2. Market Analysis, Insights and Forecast - by Component
- 17.2.1. Fan Blades
- 17.2.2. Fan Case
- 17.2.3. Guide Vanes
- 17.2.4. Shrouds
- 17.2.5. Other Components
- 17.1. Market Analysis, Insights and Forecast - by Application
- 18. Application Aeroengine Composites Market Analysis, Insights and Forecast, 2021-2033
- 18.1. Market Analysis, Insights and Forecast - by Application
- 18.1.1. Commercial Aircraft
- 18.1.2. Military Aircraft
- 18.1.3. General Aviation Aircraft
- 18.2. Market Analysis, Insights and Forecast - by Component
- 18.2.1. Fan Blades
- 18.2.2. Fan Case
- 18.2.3. Guide Vanes
- 18.2.4. Shrouds
- 18.2.5. Other Components
- 18.1. Market Analysis, Insights and Forecast - by Application
- 19. Application Aeroengine Composites Market Analysis, Insights and Forecast, 2021-2033
- 19.1. Market Analysis, Insights and Forecast - by Application
- 19.1.1. Commercial Aircraft
- 19.1.2. Military Aircraft
- 19.1.3. General Aviation Aircraft
- 19.2. Market Analysis, Insights and Forecast - by Component
- 19.2.1. Fan Blades
- 19.2.2. Fan Case
- 19.2.3. Guide Vanes
- 19.2.4. Shrouds
- 19.2.5. Other Components
- 19.1. Market Analysis, Insights and Forecast - by Application
- 20. Latin America Aeroengine Composites Market Analysis, Insights and Forecast, 2021-2033
- 20.1. Market Analysis, Insights and Forecast - by Application
- 20.1.1. Commercial Aircraft
- 20.1.2. Military Aircraft
- 20.1.3. General Aviation Aircraft
- 20.2. Market Analysis, Insights and Forecast - by Component
- 20.2.1. Fan Blades
- 20.2.2. Fan Case
- 20.2.3. Guide Vanes
- 20.2.4. Shrouds
- 20.2.5. Other Components
- 20.1. Market Analysis, Insights and Forecast - by Application
- 21. Application Aeroengine Composites Market Analysis, Insights and Forecast, 2021-2033
- 21.1. Market Analysis, Insights and Forecast - by Application
- 21.1.1. Commercial Aircraft
- 21.1.2. Military Aircraft
- 21.1.3. General Aviation Aircraft
- 21.2. Market Analysis, Insights and Forecast - by Component
- 21.2.1. Fan Blades
- 21.2.2. Fan Case
- 21.2.3. Guide Vanes
- 21.2.4. Shrouds
- 21.2.5. Other Components
- 21.1. Market Analysis, Insights and Forecast - by Application
- 22. Application Aeroengine Composites Market Analysis, Insights and Forecast, 2021-2033
- 22.1. Market Analysis, Insights and Forecast - by Application
- 22.1.1. Commercial Aircraft
- 22.1.2. Military Aircraft
- 22.1.3. General Aviation Aircraft
- 22.2. Market Analysis, Insights and Forecast - by Component
- 22.2.1. Fan Blades
- 22.2.2. Fan Case
- 22.2.3. Guide Vanes
- 22.2.4. Shrouds
- 22.2.5. Other Components
- 22.1. Market Analysis, Insights and Forecast - by Application
- 23. Middle East and Africa Aeroengine Composites Market Analysis, Insights and Forecast, 2021-2033
- 23.1. Market Analysis, Insights and Forecast - by Application
- 23.1.1. Commercial Aircraft
- 23.1.2. Military Aircraft
- 23.1.3. General Aviation Aircraft
- 23.2. Market Analysis, Insights and Forecast - by Component
- 23.2.1. Fan Blades
- 23.2.2. Fan Case
- 23.2.3. Guide Vanes
- 23.2.4. Shrouds
- 23.2.5. Other Components
- 23.1. Market Analysis, Insights and Forecast - by Application
- 24. Application Aeroengine Composites Market Analysis, Insights and Forecast, 2021-2033
- 24.1. Market Analysis, Insights and Forecast - by Application
- 24.1.1. Commercial Aircraft
- 24.1.2. Military Aircraft
- 24.1.3. General Aviation Aircraft
- 24.2. Market Analysis, Insights and Forecast - by Component
- 24.2.1. Fan Blades
- 24.2.2. Fan Case
- 24.2.3. Guide Vanes
- 24.2.4. Shrouds
- 24.2.5. Other Components
- 24.1. Market Analysis, Insights and Forecast - by Application
- 25. Application Aeroengine Composites Market Analysis, Insights and Forecast, 2021-2033
- 25.1. Market Analysis, Insights and Forecast - by Application
- 25.1.1. Commercial Aircraft
- 25.1.2. Military Aircraft
- 25.1.3. General Aviation Aircraft
- 25.2. Market Analysis, Insights and Forecast - by Component
- 25.2.1. Fan Blades
- 25.2.2. Fan Case
- 25.2.3. Guide Vanes
- 25.2.4. Shrouds
- 25.2.5. Other Components
- 25.1. Market Analysis, Insights and Forecast - by Application
- 26. Application Aeroengine Composites Market Analysis, Insights and Forecast, 2021-2033
- 26.1. Market Analysis, Insights and Forecast - by Application
- 26.1.1. Commercial Aircraft
- 26.1.2. Military Aircraft
- 26.1.3. General Aviation Aircraft
- 26.2. Market Analysis, Insights and Forecast - by Component
- 26.2.1. Fan Blades
- 26.2.2. Fan Case
- 26.2.3. Guide Vanes
- 26.2.4. Shrouds
- 26.2.5. Other Components
- 26.1. Market Analysis, Insights and Forecast - by Application
- 27. Application Aeroengine Composites Market Analysis, Insights and Forecast, 2021-2033
- 27.1. Market Analysis, Insights and Forecast - by Application
- 27.1.1. Commercial Aircraft
- 27.1.2. Military Aircraft
- 27.1.3. General Aviation Aircraft
- 27.2. Market Analysis, Insights and Forecast - by Component
- 27.2.1. Fan Blades
- 27.2.2. Fan Case
- 27.2.3. Guide Vanes
- 27.2.4. Shrouds
- 27.2.5. Other Components
- 27.1. Market Analysis, Insights and Forecast - by Application
- 28. Competitive Analysis
- 28.1. Company Profiles
- 28.1.1 General Dynamics Corporation
- 28.1.1.1. Company Overview
- 28.1.1.2. Products
- 28.1.1.3. Company Financials
- 28.1.1.4. SWOT Analysis
- 28.1.2 Rolls-Royce PLC
- 28.1.2.1. Company Overview
- 28.1.2.2. Products
- 28.1.2.3. Company Financials
- 28.1.2.4. SWOT Analysis
- 28.1.3 Meggitt PLC
- 28.1.3.1. Company Overview
- 28.1.3.2. Products
- 28.1.3.3. Company Financials
- 28.1.3.4. SWOT Analysis
- 28.1.4 FACC AG
- 28.1.4.1. Company Overview
- 28.1.4.2. Products
- 28.1.4.3. Company Financials
- 28.1.4.4. SWOT Analysis
- 28.1.5 Safran SA
- 28.1.5.1. Company Overview
- 28.1.5.2. Products
- 28.1.5.3. Company Financials
- 28.1.5.4. SWOT Analysis
- 28.1.6 Solvay SA
- 28.1.6.1. Company Overview
- 28.1.6.2. Products
- 28.1.6.3. Company Financials
- 28.1.6.4. SWOT Analysis
- 28.1.7 Hexcel Corporation
- 28.1.7.1. Company Overview
- 28.1.7.2. Products
- 28.1.7.3. Company Financials
- 28.1.7.4. SWOT Analysis
- 28.1.8 GE Aviation
- 28.1.8.1. Company Overview
- 28.1.8.2. Products
- 28.1.8.3. Company Financials
- 28.1.8.4. SWOT Analysis
- 28.1.9 Pratt & Whitney (Raytheon Technologies Corporation
- 28.1.9.1. Company Overview
- 28.1.9.2. Products
- 28.1.9.3. Company Financials
- 28.1.9.4. SWOT Analysis
- 28.1.10 Albany Engineered Composites Inc
- 28.1.10.1. Company Overview
- 28.1.10.2. Products
- 28.1.10.3. Company Financials
- 28.1.10.4. SWOT Analysis
- 28.1.11 GKN Aerospace
- 28.1.11.1. Company Overview
- 28.1.11.2. Products
- 28.1.11.3. Company Financials
- 28.1.11.4. SWOT Analysis
- 28.1.1 General Dynamics Corporation
- 28.2. Market Entropy
- 28.2.1 Company's Key Areas Served
- 28.2.2 Recent Developments
- 28.3. Company Market Share Analysis 2025
- 28.3.1 Top 5 Companies Market Share Analysis
- 28.3.2 Top 3 Companies Market Share Analysis
- 28.4. List of Potential Customers
- 29. Research Methodology
List of Figures
- Figure 1: Global Aeroengine Composites Market Revenue Breakdown (Million, %) by Region 2025 & 2033
- Figure 2: North America Aeroengine Composites Market Revenue (Million), by Application 2025 & 2033
- Figure 3: North America Aeroengine Composites Market Revenue Share (%), by Application 2025 & 2033
- Figure 4: North America Aeroengine Composites Market Revenue (Million), by Component 2025 & 2033
- Figure 5: North America Aeroengine Composites Market Revenue Share (%), by Component 2025 & 2033
- Figure 6: North America Aeroengine Composites Market Revenue (Million), by Country 2025 & 2033
- Figure 7: North America Aeroengine Composites Market Revenue Share (%), by Country 2025 & 2033
- Figure 8: Application Aeroengine Composites Market Revenue (Million), by Application 2025 & 2033
- Figure 9: Application Aeroengine Composites Market Revenue Share (%), by Application 2025 & 2033
- Figure 10: Application Aeroengine Composites Market Revenue (Million), by Component 2025 & 2033
- Figure 11: Application Aeroengine Composites Market Revenue Share (%), by Component 2025 & 2033
- Figure 12: Application Aeroengine Composites Market Revenue (Million), by Country 2025 & 2033
- Figure 13: Application Aeroengine Composites Market Revenue Share (%), by Country 2025 & 2033
- Figure 14: Application Aeroengine Composites Market Revenue (Million), by Application 2025 & 2033
- Figure 15: Application Aeroengine Composites Market Revenue Share (%), by Application 2025 & 2033
- Figure 16: Application Aeroengine Composites Market Revenue (Million), by Component 2025 & 2033
- Figure 17: Application Aeroengine Composites Market Revenue Share (%), by Component 2025 & 2033
- Figure 18: Application Aeroengine Composites Market Revenue (Million), by Country 2025 & 2033
- Figure 19: Application Aeroengine Composites Market Revenue Share (%), by Country 2025 & 2033
- Figure 20: Europe Aeroengine Composites Market Revenue (Million), by Application 2025 & 2033
- Figure 21: Europe Aeroengine Composites Market Revenue Share (%), by Application 2025 & 2033
- Figure 22: Europe Aeroengine Composites Market Revenue (Million), by Component 2025 & 2033
- Figure 23: Europe Aeroengine Composites Market Revenue Share (%), by Component 2025 & 2033
- Figure 24: Europe Aeroengine Composites Market Revenue (Million), by Country 2025 & 2033
- Figure 25: Europe Aeroengine Composites Market Revenue Share (%), by Country 2025 & 2033
- Figure 26: Application Aeroengine Composites Market Revenue (Million), by Application 2025 & 2033
- Figure 27: Application Aeroengine Composites Market Revenue Share (%), by Application 2025 & 2033
- Figure 28: Application Aeroengine Composites Market Revenue (Million), by Component 2025 & 2033
- Figure 29: Application Aeroengine Composites Market Revenue Share (%), by Component 2025 & 2033
- Figure 30: Application Aeroengine Composites Market Revenue (Million), by Country 2025 & 2033
- Figure 31: Application Aeroengine Composites Market Revenue Share (%), by Country 2025 & 2033
- Figure 32: Application Aeroengine Composites Market Revenue (Million), by Application 2025 & 2033
- Figure 33: Application Aeroengine Composites Market Revenue Share (%), by Application 2025 & 2033
- Figure 34: Application Aeroengine Composites Market Revenue (Million), by Component 2025 & 2033
- Figure 35: Application Aeroengine Composites Market Revenue Share (%), by Component 2025 & 2033
- Figure 36: Application Aeroengine Composites Market Revenue (Million), by Country 2025 & 2033
- Figure 37: Application Aeroengine Composites Market Revenue Share (%), by Country 2025 & 2033
- Figure 38: Application Aeroengine Composites Market Revenue (Million), by Application 2025 & 2033
- Figure 39: Application Aeroengine Composites Market Revenue Share (%), by Application 2025 & 2033
- Figure 40: Application Aeroengine Composites Market Revenue (Million), by Component 2025 & 2033
- Figure 41: Application Aeroengine Composites Market Revenue Share (%), by Component 2025 & 2033
- Figure 42: Application Aeroengine Composites Market Revenue (Million), by Country 2025 & 2033
- Figure 43: Application Aeroengine Composites Market Revenue Share (%), by Country 2025 & 2033
- Figure 44: Application Aeroengine Composites Market Revenue (Million), by Application 2025 & 2033
- Figure 45: Application Aeroengine Composites Market Revenue Share (%), by Application 2025 & 2033
- Figure 46: Application Aeroengine Composites Market Revenue (Million), by Component 2025 & 2033
- Figure 47: Application Aeroengine Composites Market Revenue Share (%), by Component 2025 & 2033
- Figure 48: Application Aeroengine Composites Market Revenue (Million), by Country 2025 & 2033
- Figure 49: Application Aeroengine Composites Market Revenue Share (%), by Country 2025 & 2033
- Figure 50: Asia Pacific Aeroengine Composites Market Revenue (Million), by Application 2025 & 2033
- Figure 51: Asia Pacific Aeroengine Composites Market Revenue Share (%), by Application 2025 & 2033
- Figure 52: Asia Pacific Aeroengine Composites Market Revenue (Million), by Component 2025 & 2033
- Figure 53: Asia Pacific Aeroengine Composites Market Revenue Share (%), by Component 2025 & 2033
- Figure 54: Asia Pacific Aeroengine Composites Market Revenue (Million), by Country 2025 & 2033
- Figure 55: Asia Pacific Aeroengine Composites Market Revenue Share (%), by Country 2025 & 2033
- Figure 56: Application Aeroengine Composites Market Revenue (Million), by Application 2025 & 2033
- Figure 57: Application Aeroengine Composites Market Revenue Share (%), by Application 2025 & 2033
- Figure 58: Application Aeroengine Composites Market Revenue (Million), by Component 2025 & 2033
- Figure 59: Application Aeroengine Composites Market Revenue Share (%), by Component 2025 & 2033
- Figure 60: Application Aeroengine Composites Market Revenue (Million), by Country 2025 & 2033
- Figure 61: Application Aeroengine Composites Market Revenue Share (%), by Country 2025 & 2033
- Figure 62: Application Aeroengine Composites Market Revenue (Million), by Application 2025 & 2033
- Figure 63: Application Aeroengine Composites Market Revenue Share (%), by Application 2025 & 2033
- Figure 64: Application Aeroengine Composites Market Revenue (Million), by Component 2025 & 2033
- Figure 65: Application Aeroengine Composites Market Revenue Share (%), by Component 2025 & 2033
- Figure 66: Application Aeroengine Composites Market Revenue (Million), by Country 2025 & 2033
- Figure 67: Application Aeroengine Composites Market Revenue Share (%), by Country 2025 & 2033
- Figure 68: Application Aeroengine Composites Market Revenue (Million), by Application 2025 & 2033
- Figure 69: Application Aeroengine Composites Market Revenue Share (%), by Application 2025 & 2033
- Figure 70: Application Aeroengine Composites Market Revenue (Million), by Component 2025 & 2033
- Figure 71: Application Aeroengine Composites Market Revenue Share (%), by Component 2025 & 2033
- Figure 72: Application Aeroengine Composites Market Revenue (Million), by Country 2025 & 2033
- Figure 73: Application Aeroengine Composites Market Revenue Share (%), by Country 2025 & 2033
- Figure 74: Application Aeroengine Composites Market Revenue (Million), by Application 2025 & 2033
- Figure 75: Application Aeroengine Composites Market Revenue Share (%), by Application 2025 & 2033
- Figure 76: Application Aeroengine Composites Market Revenue (Million), by Component 2025 & 2033
- Figure 77: Application Aeroengine Composites Market Revenue Share (%), by Component 2025 & 2033
- Figure 78: Application Aeroengine Composites Market Revenue (Million), by Country 2025 & 2033
- Figure 79: Application Aeroengine Composites Market Revenue Share (%), by Country 2025 & 2033
- Figure 80: Latin America Aeroengine Composites Market Revenue (Million), by Application 2025 & 2033
- Figure 81: Latin America Aeroengine Composites Market Revenue Share (%), by Application 2025 & 2033
- Figure 82: Latin America Aeroengine Composites Market Revenue (Million), by Component 2025 & 2033
- Figure 83: Latin America Aeroengine Composites Market Revenue Share (%), by Component 2025 & 2033
- Figure 84: Latin America Aeroengine Composites Market Revenue (Million), by Country 2025 & 2033
- Figure 85: Latin America Aeroengine Composites Market Revenue Share (%), by Country 2025 & 2033
- Figure 86: Application Aeroengine Composites Market Revenue (Million), by Application 2025 & 2033
- Figure 87: Application Aeroengine Composites Market Revenue Share (%), by Application 2025 & 2033
- Figure 88: Application Aeroengine Composites Market Revenue (Million), by Component 2025 & 2033
- Figure 89: Application Aeroengine Composites Market Revenue Share (%), by Component 2025 & 2033
- Figure 90: Application Aeroengine Composites Market Revenue (Million), by Country 2025 & 2033
- Figure 91: Application Aeroengine Composites Market Revenue Share (%), by Country 2025 & 2033
- Figure 92: Application Aeroengine Composites Market Revenue (Million), by Application 2025 & 2033
- Figure 93: Application Aeroengine Composites Market Revenue Share (%), by Application 2025 & 2033
- Figure 94: Application Aeroengine Composites Market Revenue (Million), by Component 2025 & 2033
- Figure 95: Application Aeroengine Composites Market Revenue Share (%), by Component 2025 & 2033
- Figure 96: Application Aeroengine Composites Market Revenue (Million), by Country 2025 & 2033
- Figure 97: Application Aeroengine Composites Market Revenue Share (%), by Country 2025 & 2033
- Figure 98: Middle East and Africa Aeroengine Composites Market Revenue (Million), by Application 2025 & 2033
- Figure 99: Middle East and Africa Aeroengine Composites Market Revenue Share (%), by Application 2025 & 2033
- Figure 100: Middle East and Africa Aeroengine Composites Market Revenue (Million), by Component 2025 & 2033
- Figure 101: Middle East and Africa Aeroengine Composites Market Revenue Share (%), by Component 2025 & 2033
- Figure 102: Middle East and Africa Aeroengine Composites Market Revenue (Million), by Country 2025 & 2033
- Figure 103: Middle East and Africa Aeroengine Composites Market Revenue Share (%), by Country 2025 & 2033
- Figure 104: Application Aeroengine Composites Market Revenue (Million), by Application 2025 & 2033
- Figure 105: Application Aeroengine Composites Market Revenue Share (%), by Application 2025 & 2033
- Figure 106: Application Aeroengine Composites Market Revenue (Million), by Component 2025 & 2033
- Figure 107: Application Aeroengine Composites Market Revenue Share (%), by Component 2025 & 2033
- Figure 108: Application Aeroengine Composites Market Revenue (Million), by Country 2025 & 2033
- Figure 109: Application Aeroengine Composites Market Revenue Share (%), by Country 2025 & 2033
- Figure 110: Application Aeroengine Composites Market Revenue (Million), by Application 2025 & 2033
- Figure 111: Application Aeroengine Composites Market Revenue Share (%), by Application 2025 & 2033
- Figure 112: Application Aeroengine Composites Market Revenue (Million), by Component 2025 & 2033
- Figure 113: Application Aeroengine Composites Market Revenue Share (%), by Component 2025 & 2033
- Figure 114: Application Aeroengine Composites Market Revenue (Million), by Country 2025 & 2033
- Figure 115: Application Aeroengine Composites Market Revenue Share (%), by Country 2025 & 2033
- Figure 116: Application Aeroengine Composites Market Revenue (Million), by Application 2025 & 2033
- Figure 117: Application Aeroengine Composites Market Revenue Share (%), by Application 2025 & 2033
- Figure 118: Application Aeroengine Composites Market Revenue (Million), by Component 2025 & 2033
- Figure 119: Application Aeroengine Composites Market Revenue Share (%), by Component 2025 & 2033
- Figure 120: Application Aeroengine Composites Market Revenue (Million), by Country 2025 & 2033
- Figure 121: Application Aeroengine Composites Market Revenue Share (%), by Country 2025 & 2033
- Figure 122: Application Aeroengine Composites Market Revenue (Million), by Application 2025 & 2033
- Figure 123: Application Aeroengine Composites Market Revenue Share (%), by Application 2025 & 2033
- Figure 124: Application Aeroengine Composites Market Revenue (Million), by Component 2025 & 2033
- Figure 125: Application Aeroengine Composites Market Revenue Share (%), by Component 2025 & 2033
- Figure 126: Application Aeroengine Composites Market Revenue (Million), by Country 2025 & 2033
- Figure 127: Application Aeroengine Composites Market Revenue Share (%), by Country 2025 & 2033
List of Tables
- Table 1: Global Aeroengine Composites Market Revenue Million Forecast, by Application 2020 & 2033
- Table 2: Global Aeroengine Composites Market Revenue Million Forecast, by Component 2020 & 2033
- Table 3: Global Aeroengine Composites Market Revenue Million Forecast, by Region 2020 & 2033
- Table 4: Global Aeroengine Composites Market Revenue Million Forecast, by Application 2020 & 2033
- Table 5: Global Aeroengine Composites Market Revenue Million Forecast, by Component 2020 & 2033
- Table 6: Global Aeroengine Composites Market Revenue Million Forecast, by Country 2020 & 2033
- Table 7: United States Aeroengine Composites Market Revenue (Million) Forecast, by Application 2020 & 2033
- Table 8: Global Aeroengine Composites Market Revenue Million Forecast, by Application 2020 & 2033
- Table 9: Global Aeroengine Composites Market Revenue Million Forecast, by Component 2020 & 2033
- Table 10: Global Aeroengine Composites Market Revenue Million Forecast, by Country 2020 & 2033
- Table 11: Canada Aeroengine Composites Market Revenue (Million) Forecast, by Application 2020 & 2033
- Table 12: Global Aeroengine Composites Market Revenue Million Forecast, by Application 2020 & 2033
- Table 13: Global Aeroengine Composites Market Revenue Million Forecast, by Component 2020 & 2033
- Table 14: Global Aeroengine Composites Market Revenue Million Forecast, by Country 2020 & 2033
- Table 15: Global Aeroengine Composites Market Revenue Million Forecast, by Application 2020 & 2033
- Table 16: Global Aeroengine Composites Market Revenue Million Forecast, by Component 2020 & 2033
- Table 17: Global Aeroengine Composites Market Revenue Million Forecast, by Country 2020 & 2033
- Table 18: United Kingdom Aeroengine Composites Market Revenue (Million) Forecast, by Application 2020 & 2033
- Table 19: Global Aeroengine Composites Market Revenue Million Forecast, by Application 2020 & 2033
- Table 20: Global Aeroengine Composites Market Revenue Million Forecast, by Component 2020 & 2033
- Table 21: Global Aeroengine Composites Market Revenue Million Forecast, by Country 2020 & 2033
- Table 22: France Aeroengine Composites Market Revenue (Million) Forecast, by Application 2020 & 2033
- Table 23: Global Aeroengine Composites Market Revenue Million Forecast, by Application 2020 & 2033
- Table 24: Global Aeroengine Composites Market Revenue Million Forecast, by Component 2020 & 2033
- Table 25: Global Aeroengine Composites Market Revenue Million Forecast, by Country 2020 & 2033
- Table 26: Germany Aeroengine Composites Market Revenue (Million) Forecast, by Application 2020 & 2033
- Table 27: Global Aeroengine Composites Market Revenue Million Forecast, by Application 2020 & 2033
- Table 28: Global Aeroengine Composites Market Revenue Million Forecast, by Component 2020 & 2033
- Table 29: Global Aeroengine Composites Market Revenue Million Forecast, by Country 2020 & 2033
- Table 30: Rest of Europe Aeroengine Composites Market Revenue (Million) Forecast, by Application 2020 & 2033
- Table 31: Global Aeroengine Composites Market Revenue Million Forecast, by Application 2020 & 2033
- Table 32: Global Aeroengine Composites Market Revenue Million Forecast, by Component 2020 & 2033
- Table 33: Global Aeroengine Composites Market Revenue Million Forecast, by Country 2020 & 2033
- Table 34: Global Aeroengine Composites Market Revenue Million Forecast, by Application 2020 & 2033
- Table 35: Global Aeroengine Composites Market Revenue Million Forecast, by Component 2020 & 2033
- Table 36: Global Aeroengine Composites Market Revenue Million Forecast, by Country 2020 & 2033
- Table 37: China Aeroengine Composites Market Revenue (Million) Forecast, by Application 2020 & 2033
- Table 38: Global Aeroengine Composites Market Revenue Million Forecast, by Application 2020 & 2033
- Table 39: Global Aeroengine Composites Market Revenue Million Forecast, by Component 2020 & 2033
- Table 40: Global Aeroengine Composites Market Revenue Million Forecast, by Country 2020 & 2033
- Table 41: India Aeroengine Composites Market Revenue (Million) Forecast, by Application 2020 & 2033
- Table 42: Global Aeroengine Composites Market Revenue Million Forecast, by Application 2020 & 2033
- Table 43: Global Aeroengine Composites Market Revenue Million Forecast, by Component 2020 & 2033
- Table 44: Global Aeroengine Composites Market Revenue Million Forecast, by Country 2020 & 2033
- Table 45: Japan Aeroengine Composites Market Revenue (Million) Forecast, by Application 2020 & 2033
- Table 46: Global Aeroengine Composites Market Revenue Million Forecast, by Application 2020 & 2033
- Table 47: Global Aeroengine Composites Market Revenue Million Forecast, by Component 2020 & 2033
- Table 48: Global Aeroengine Composites Market Revenue Million Forecast, by Country 2020 & 2033
- Table 49: Rest of Asia Pacific Aeroengine Composites Market Revenue (Million) Forecast, by Application 2020 & 2033
- Table 50: Global Aeroengine Composites Market Revenue Million Forecast, by Application 2020 & 2033
- Table 51: Global Aeroengine Composites Market Revenue Million Forecast, by Component 2020 & 2033
- Table 52: Global Aeroengine Composites Market Revenue Million Forecast, by Country 2020 & 2033
- Table 53: Global Aeroengine Composites Market Revenue Million Forecast, by Application 2020 & 2033
- Table 54: Global Aeroengine Composites Market Revenue Million Forecast, by Component 2020 & 2033
- Table 55: Global Aeroengine Composites Market Revenue Million Forecast, by Country 2020 & 2033
- Table 56: Brazil Aeroengine Composites Market Revenue (Million) Forecast, by Application 2020 & 2033
- Table 57: Global Aeroengine Composites Market Revenue Million Forecast, by Application 2020 & 2033
- Table 58: Global Aeroengine Composites Market Revenue Million Forecast, by Component 2020 & 2033
- Table 59: Global Aeroengine Composites Market Revenue Million Forecast, by Country 2020 & 2033
- Table 60: Rest of Latin America Aeroengine Composites Market Revenue (Million) Forecast, by Application 2020 & 2033
- Table 61: Global Aeroengine Composites Market Revenue Million Forecast, by Application 2020 & 2033
- Table 62: Global Aeroengine Composites Market Revenue Million Forecast, by Component 2020 & 2033
- Table 63: Global Aeroengine Composites Market Revenue Million Forecast, by Country 2020 & 2033
- Table 64: Global Aeroengine Composites Market Revenue Million Forecast, by Application 2020 & 2033
- Table 65: Global Aeroengine Composites Market Revenue Million Forecast, by Component 2020 & 2033
- Table 66: Global Aeroengine Composites Market Revenue Million Forecast, by Country 2020 & 2033
- Table 67: Saudi Arabia Aeroengine Composites Market Revenue (Million) Forecast, by Application 2020 & 2033
- Table 68: Global Aeroengine Composites Market Revenue Million Forecast, by Application 2020 & 2033
- Table 69: Global Aeroengine Composites Market Revenue Million Forecast, by Component 2020 & 2033
- Table 70: Global Aeroengine Composites Market Revenue Million Forecast, by Country 2020 & 2033
- Table 71: United Arab Emirates Aeroengine Composites Market Revenue (Million) Forecast, by Application 2020 & 2033
- Table 72: Global Aeroengine Composites Market Revenue Million Forecast, by Application 2020 & 2033
- Table 73: Global Aeroengine Composites Market Revenue Million Forecast, by Component 2020 & 2033
- Table 74: Global Aeroengine Composites Market Revenue Million Forecast, by Country 2020 & 2033
- Table 75: Egypt Aeroengine Composites Market Revenue (Million) Forecast, by Application 2020 & 2033
- Table 76: Global Aeroengine Composites Market Revenue Million Forecast, by Application 2020 & 2033
- Table 77: Global Aeroengine Composites Market Revenue Million Forecast, by Component 2020 & 2033
- Table 78: Global Aeroengine Composites Market Revenue Million Forecast, by Country 2020 & 2033
- Table 79: Rest of Middle East and Africa Aeroengine Composites Market Revenue (Million) Forecast, by Application 2020 & 2033
- Table 80: Global Aeroengine Composites Market Revenue Million Forecast, by Application 2020 & 2033
- Table 81: Global Aeroengine Composites Market Revenue Million Forecast, by Component 2020 & 2033
- Table 82: Global Aeroengine Composites Market Revenue Million Forecast, by Country 2020 & 2033
Frequently Asked Questions
1. What is the projected Compound Annual Growth Rate (CAGR) of the Aeroengine Composites Market?
The projected CAGR is approximately 11.02%.
2. Which companies are prominent players in the Aeroengine Composites Market?
Key companies in the market include General Dynamics Corporation, Rolls-Royce PLC, Meggitt PLC, FACC AG, Safran SA, Solvay SA, Hexcel Corporation, GE Aviation, Pratt & Whitney (Raytheon Technologies Corporation, Albany Engineered Composites Inc, GKN Aerospace.
3. What are the main segments of the Aeroengine Composites Market?
The market segments include Application, Component.
4. Can you provide details about the market size?
The market size is estimated to be USD 3.39 Million as of 2022.
5. What are some drivers contributing to market growth?
N/A
6. What are the notable trends driving market growth?
The Commercial Aircraft Segment Held the Highest Market Share in 2021.
7. Are there any restraints impacting market growth?
N/A
8. Can you provide examples of recent developments in the market?
In November 2021, Safran Aircraft Engines and Albany International Corp. announced an agreement extending their partnership to 2046. Albany International and Safran signed the original framework agreement in 2006, resulting in the creation of their joint venture for the development of high technology composite parts (3D woven and Resin Transfer Molded technologies) designed for aircraft engines, landing gears, and nacelles.
9. What pricing options are available for accessing the report?
Pricing options include single-user, multi-user, and enterprise licenses priced at USD 4750, USD 5250, and USD 8750 respectively.
10. Is the market size provided in terms of value or volume?
The market size is provided in terms of value, measured in Million.
11. Are there any specific market keywords associated with the report?
Yes, the market keyword associated with the report is "Aeroengine Composites Market," which aids in identifying and referencing the specific market segment covered.
12. How do I determine which pricing option suits my needs best?
The pricing options vary based on user requirements and access needs. Individual users may opt for single-user licenses, while businesses requiring broader access may choose multi-user or enterprise licenses for cost-effective access to the report.
13. Are there any additional resources or data provided in the Aeroengine Composites Market report?
While the report offers comprehensive insights, it's advisable to review the specific contents or supplementary materials provided to ascertain if additional resources or data are available.
14. How can I stay updated on further developments or reports in the Aeroengine Composites Market?
To stay informed about further developments, trends, and reports in the Aeroengine Composites Market, consider subscribing to industry newsletters, following relevant companies and organizations, or regularly checking reputable industry news sources and publications.
Methodology
Step 1 - Identification of Relevant Samples Size from Population Database


Step 2 - Approaches for Defining Global Market Size (Value, Volume* & Price*)

Note*: In applicable scenarios
Step 3 - Data Sources
Primary Research
- Web Analytics
- Survey Reports
- Research Institute
- Latest Research Reports
- Opinion Leaders
Secondary Research
- Annual Reports
- White Paper
- Latest Press Release
- Industry Association
- Paid Database
- Investor Presentations

Step 4 - Data Triangulation
Involves using different sources of information in order to increase the validity of a study
These sources are likely to be stakeholders in a program - participants, other researchers, program staff, other community members, and so on.
Then we put all data in single framework & apply various statistical tools to find out the dynamic on the market.
During the analysis stage, feedback from the stakeholder groups would be compared to determine areas of agreement as well as areas of divergence