
Key Insights
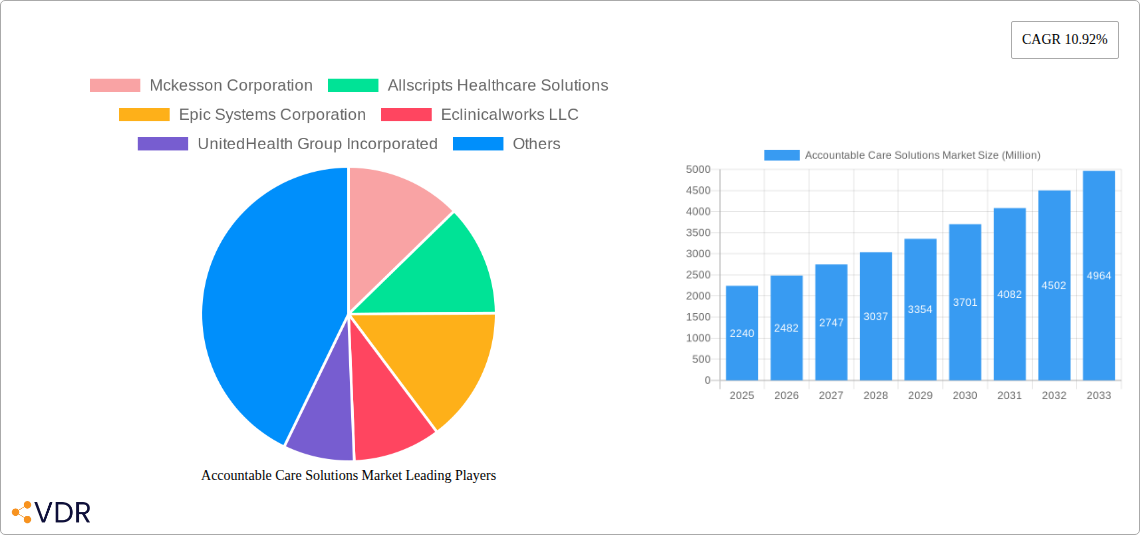
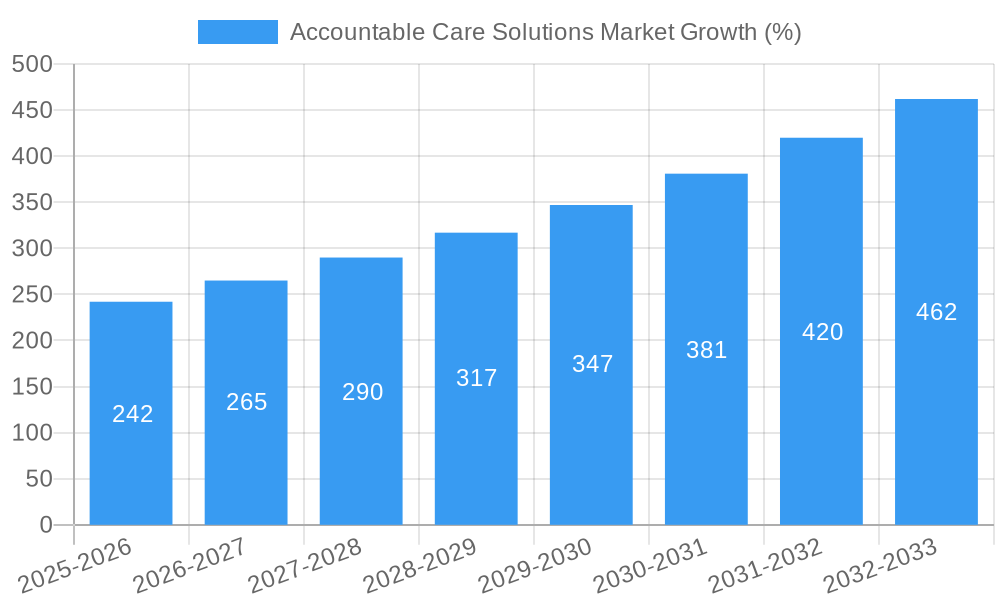
The Accountable Care Solutions (ACS) market is experiencing robust growth, projected to reach \$2.24 billion in 2025 and maintain a Compound Annual Growth Rate (CAGR) of 10.92% from 2025 to 2033. This expansion is driven by several key factors. Firstly, the increasing prevalence of chronic diseases and the rising elderly population necessitate more efficient and cost-effective healthcare delivery models. ACS, with its focus on coordinated care and preventative measures, directly addresses this need. Secondly, government initiatives promoting value-based care and reimbursement models are incentivizing the adoption of ACS across healthcare systems. The shift from fee-for-service to value-based care creates a strong market pull for solutions that improve patient outcomes and reduce healthcare costs. Technological advancements, particularly in Electronic Health Records (EHR) and healthcare analytics, further fuel market growth by enabling data-driven decision-making and streamlined workflows within accountable care organizations (ACOs). The market is segmented by product and services (EHR, analytics, RCM, claims & payment management, support services), deployment (on-premise, cloud-based), and end-user (providers and payers), offering diverse opportunities for specialized solutions. Competition is intense, with major players like McKesson, Allscripts, Epic Systems, and Cerner vying for market share. Geographic expansion, particularly in developing economies with burgeoning healthcare sectors, presents significant future growth potential.
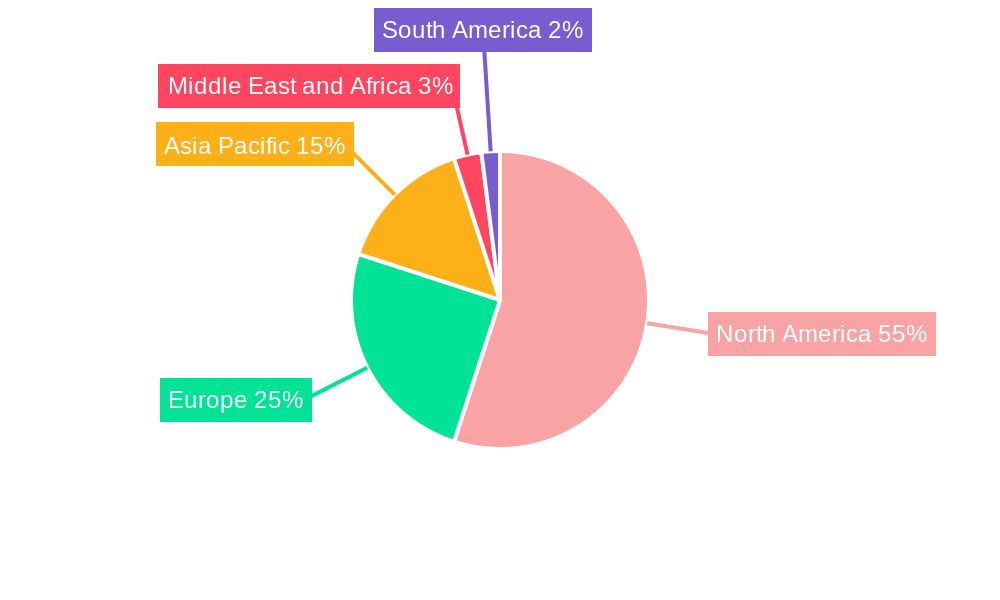
The North American market currently dominates the ACS landscape due to advanced healthcare infrastructure and early adoption of value-based care models. However, regions like Asia-Pacific and Europe are expected to witness significant growth driven by increasing healthcare expenditure and government investments in digital health infrastructure. The market's future trajectory hinges on the continued success of value-based care initiatives, technological innovations that enhance data interoperability and analytics capabilities, and the ability of ACS vendors to adapt to evolving regulatory landscapes and payer requirements. Specific challenges include data security concerns, the complexity of integrating disparate systems, and the need for robust training and support to ensure effective implementation and usage of ACS solutions across healthcare organizations. Despite these hurdles, the long-term outlook for the ACS market remains optimistic, driven by the fundamental need for more efficient, effective, and cost-conscious healthcare delivery.
Accountable Care Solutions Market: A Comprehensive Market Report (2019-2033)
This in-depth report provides a comprehensive analysis of the Accountable Care Solutions market, encompassing market dynamics, growth trends, regional performance, product landscape, key players, and future outlook. The report covers the period 2019-2033, with a base year of 2025 and a forecast period of 2025-2033. The market is segmented by product & services (Electronic Health/Medical Records, Healthcare Analytics, Revenue Cycle Management Solutions (RCM), Claims Management Solutions, Payment Management Solutions, Support and Maintenance Services, Other Products & Services), deployment (On-premise, Web & Cloud-Based), and end-user (Healthcare Providers, Healthcare Payers). The total market size is projected to reach xx Million by 2033.
Accountable Care Solutions Market Dynamics & Structure
The Accountable Care Solutions market is characterized by a moderately consolidated structure, with key players like McKesson Corporation, Allscripts Healthcare Solutions, and Epic Systems Corporation holding significant market share. Technological innovation, driven by advancements in AI, big data analytics, and cloud computing, is a major growth driver. Stringent regulatory frameworks, particularly within the healthcare sector, heavily influence market operations. The increasing adoption of value-based care models is fueling demand for accountable care solutions. Competitive substitutes include traditional fee-for-service models, but the shift towards value-based care is limiting their impact. The end-user demographics are largely skewed towards large healthcare providers and payers. Mergers and acquisitions (M&A) activity is prevalent, with an estimated xx number of deals occurring in the historical period (2019-2024), indicating a trend of consolidation and expansion within the market.
- Market Concentration: Moderately consolidated, with top 5 players holding xx% market share in 2024.
- Technological Innovation: AI, big data, cloud computing drive solution advancements.
- Regulatory Frameworks: Stringent healthcare regulations significantly influence market dynamics.
- Competitive Substitutes: Traditional fee-for-service models pose limited competition due to value-based care shift.
- End-User Demographics: Dominated by large healthcare providers and payers.
- M&A Trends: Significant M&A activity observed (xx deals between 2019-2024), leading to market consolidation.
Accountable Care Solutions Market Growth Trends & Insights
The Accountable Care Solutions market experienced robust growth during the historical period (2019-2024), with a CAGR of xx%. This growth is primarily attributed to the increasing adoption of electronic health records (EHRs), the rising prevalence of chronic diseases, the expanding use of healthcare analytics for population health management, and government initiatives promoting value-based care. The market is expected to continue its growth trajectory during the forecast period (2025-2033), driven by factors such as technological advancements in AI and machine learning for improved care coordination, increasing focus on patient engagement, and the expansion of telehealth services. Market penetration of cloud-based solutions is expected to increase significantly, reaching xx% by 2033. Consumer behavior shifts towards increased healthcare transparency and personalized care are further accelerating market demand.
Dominant Regions, Countries, or Segments in Accountable Care Solutions Market
North America currently dominates the Accountable Care Solutions market, holding the largest market share in 2024, followed by Europe and Asia Pacific. This dominance is largely attributed to the advanced healthcare infrastructure, high adoption of EHRs and advanced analytics, and favorable regulatory environment. Within segments, Electronic Health/Medical Records (EHR) and Healthcare Analytics are the leading revenue generators, exhibiting high growth potential. Web & Cloud-based deployment models are rapidly gaining traction, surpassing on-premise solutions in market share. Healthcare providers remain the largest end-user segment, driving the majority of market demand.
- Key Drivers:
- Advanced healthcare infrastructure in North America.
- High adoption rates of EHRs and analytics.
- Favorable regulatory environments.
- Increasing government investments in healthcare IT.
- Dominant Segments:
- Electronic Health/Medical Records (EHR)
- Healthcare Analytics
- Web & Cloud-Based Deployment
Accountable Care Solutions Market Product Landscape
The Accountable Care Solutions market features a diverse range of products and services, including EHR systems with advanced analytics capabilities, revenue cycle management solutions, and claims and payment management platforms. Key innovations focus on enhancing interoperability, improving data security and privacy, and integrating AI for predictive analytics and personalized care recommendations. These solutions are designed to streamline healthcare workflows, reduce administrative costs, and improve patient outcomes. Unique selling propositions frequently include superior user interfaces, robust analytics dashboards, and seamless integration with existing healthcare systems.
Key Drivers, Barriers & Challenges in Accountable Care Solutions Market
Key Drivers: The increasing adoption of value-based care models, rising demand for improved healthcare efficiency, and government initiatives promoting the use of technology in healthcare are key drivers. Advancements in AI and machine learning further contribute to improved analytics and care coordination.
Key Challenges: High implementation costs, data security and privacy concerns, interoperability issues between different healthcare systems, and the need for skilled IT professionals to manage these complex solutions represent significant barriers to market growth. Furthermore, regulatory compliance and varying reimbursement policies across different healthcare systems pose substantial challenges.
Emerging Opportunities in Accountable Care Solutions Market
The growing adoption of telehealth services presents a significant opportunity. The integration of wearable technology and remote patient monitoring solutions also offers substantial potential for growth. Expansion into untapped markets in developing countries, where healthcare infrastructure needs improvement, represents a key opportunity for market expansion. Additionally, the development of personalized medicine solutions that leverage patient-specific data to deliver targeted interventions can fuel future market growth.
Growth Accelerators in the Accountable Care Solutions Market Industry
Strategic partnerships between technology providers and healthcare organizations are crucial to drive market growth. The development of innovative solutions that address specific healthcare challenges, such as chronic disease management, will significantly accelerate market expansion. Increased investments in research and development, focusing on improving the user experience and incorporating cutting-edge technologies like AI and blockchain, will stimulate long-term growth.
Key Players Shaping the Accountable Care Solutions Market Market
- McKesson Corporation
- Allscripts Healthcare Solutions
- Epic Systems Corporation
- Eclinicalworks LLC
- UnitedHealth Group Incorporated
- Verisk Analytics Inc
- Constellation Software
- IBM Healthcare
- Cerner Corporation
- ZeOmega Inc
- Aetna Inc
- Athenahealth Inc
Notable Milestones in Accountable Care Solutions Market Sector
- March 2022: Collaborative Health Systems and Community Care Alliance formed a joint venture to improve care coordination.
- March 2022: CMS introduced the REACH accountable care model, replacing the GPDC model.
In-Depth Accountable Care Solutions Market Market Outlook
The Accountable Care Solutions market is poised for continued growth, driven by technological advancements, increasing adoption of value-based care, and the expanding need for improved healthcare efficiency. Strategic partnerships, innovative product development, and expansion into new markets will be critical to capitalize on future market potential. The market is expected to witness a substantial increase in the adoption of AI-powered solutions and cloud-based platforms, enhancing data analytics and care coordination capabilities.
Accountable Care Solutions Market Segmentation
-
1. Product & Services
- 1.1. Electronic Health/Medical Records
- 1.2. Healthcare Analytics
- 1.3. Revenue Cycle Management Solutions (RCM)
- 1.4. Claims Management Solutions
- 1.5. Payment Management Solutions
- 1.6. Support and Maintenance Services
- 1.7. Other Products & Services
-
2. Deployment
- 2.1. On-premise
- 2.2. Web & Cloud-Based
-
3. End User
- 3.1. Healthcare Providers
- 3.2. Healthcare Payers
Accountable Care Solutions Market Segmentation By Geography
-
1. North America
- 1.1. United States
- 1.2. Canada
- 1.3. Mexico
-
2. Europe
- 2.1. Germany
- 2.2. United Kingdom
- 2.3. France
- 2.4. Italy
- 2.5. Spain
- 2.6. Rest of Europe
-
3. Asia Pacific
- 3.1. China
- 3.2. Japan
- 3.3. India
- 3.4. Australia
- 3.5. South Korea
- 3.6. Rest of Asia Pacific
-
4. Middle East and Africa
- 4.1. GCC
- 4.2. South Africa
- 4.3. Rest of Middle East and Africa
-
5. South America
- 5.1. Brazil
- 5.2. Argentina
- 5.3. Rest of South America
Accountable Care Solutions Market REPORT HIGHLIGHTS
| Aspects | Details |
|---|---|
| Study Period | 2019-2033 |
| Base Year | 2024 |
| Estimated Year | 2025 |
| Forecast Period | 2025-2033 |
| Historical Period | 2019-2024 |
| Growth Rate | CAGR of 10.92% from 2019-2033 |
| Segmentation |
|
Table of Contents
- 1. Introduction
- 1.1. Research Scope
- 1.2. Market Segmentation
- 1.3. Research Methodology
- 1.4. Definitions and Assumptions
- 2. Executive Summary
- 2.1. Introduction
- 3. Market Dynamics
- 3.1. Introduction
- 3.2. Market Drivers
- 3.2.1. Emergence of Big Data in Healthcare; Government Regulations and Initiatives to Promote Patient-Centric Care; Increasing Demand to Curtail Healthcare Costs
- 3.3. Market Restrains
- 3.3.1. Data Security and Privacy Concerns; High Investments Required for Supporting Infrastructure
- 3.4. Market Trends
- 3.4.1. Electronic Health/Medical Records Segment is Expected to Hold a Significant Market Share Over the Forecast Period
- 4. Market Factor Analysis
- 4.1. Porters Five Forces
- 4.2. Supply/Value Chain
- 4.3. PESTEL analysis
- 4.4. Market Entropy
- 4.5. Patent/Trademark Analysis
- 5. Global Accountable Care Solutions Market Analysis, Insights and Forecast, 2019-2031
- 5.1. Market Analysis, Insights and Forecast - by Product & Services
- 5.1.1. Electronic Health/Medical Records
- 5.1.2. Healthcare Analytics
- 5.1.3. Revenue Cycle Management Solutions (RCM)
- 5.1.4. Claims Management Solutions
- 5.1.5. Payment Management Solutions
- 5.1.6. Support and Maintenance Services
- 5.1.7. Other Products & Services
- 5.2. Market Analysis, Insights and Forecast - by Deployment
- 5.2.1. On-premise
- 5.2.2. Web & Cloud-Based
- 5.3. Market Analysis, Insights and Forecast - by End User
- 5.3.1. Healthcare Providers
- 5.3.2. Healthcare Payers
- 5.4. Market Analysis, Insights and Forecast - by Region
- 5.4.1. North America
- 5.4.2. Europe
- 5.4.3. Asia Pacific
- 5.4.4. Middle East and Africa
- 5.4.5. South America
- 5.1. Market Analysis, Insights and Forecast - by Product & Services
- 6. North America Accountable Care Solutions Market Analysis, Insights and Forecast, 2019-2031
- 6.1. Market Analysis, Insights and Forecast - by Product & Services
- 6.1.1. Electronic Health/Medical Records
- 6.1.2. Healthcare Analytics
- 6.1.3. Revenue Cycle Management Solutions (RCM)
- 6.1.4. Claims Management Solutions
- 6.1.5. Payment Management Solutions
- 6.1.6. Support and Maintenance Services
- 6.1.7. Other Products & Services
- 6.2. Market Analysis, Insights and Forecast - by Deployment
- 6.2.1. On-premise
- 6.2.2. Web & Cloud-Based
- 6.3. Market Analysis, Insights and Forecast - by End User
- 6.3.1. Healthcare Providers
- 6.3.2. Healthcare Payers
- 6.1. Market Analysis, Insights and Forecast - by Product & Services
- 7. Europe Accountable Care Solutions Market Analysis, Insights and Forecast, 2019-2031
- 7.1. Market Analysis, Insights and Forecast - by Product & Services
- 7.1.1. Electronic Health/Medical Records
- 7.1.2. Healthcare Analytics
- 7.1.3. Revenue Cycle Management Solutions (RCM)
- 7.1.4. Claims Management Solutions
- 7.1.5. Payment Management Solutions
- 7.1.6. Support and Maintenance Services
- 7.1.7. Other Products & Services
- 7.2. Market Analysis, Insights and Forecast - by Deployment
- 7.2.1. On-premise
- 7.2.2. Web & Cloud-Based
- 7.3. Market Analysis, Insights and Forecast - by End User
- 7.3.1. Healthcare Providers
- 7.3.2. Healthcare Payers
- 7.1. Market Analysis, Insights and Forecast - by Product & Services
- 8. Asia Pacific Accountable Care Solutions Market Analysis, Insights and Forecast, 2019-2031
- 8.1. Market Analysis, Insights and Forecast - by Product & Services
- 8.1.1. Electronic Health/Medical Records
- 8.1.2. Healthcare Analytics
- 8.1.3. Revenue Cycle Management Solutions (RCM)
- 8.1.4. Claims Management Solutions
- 8.1.5. Payment Management Solutions
- 8.1.6. Support and Maintenance Services
- 8.1.7. Other Products & Services
- 8.2. Market Analysis, Insights and Forecast - by Deployment
- 8.2.1. On-premise
- 8.2.2. Web & Cloud-Based
- 8.3. Market Analysis, Insights and Forecast - by End User
- 8.3.1. Healthcare Providers
- 8.3.2. Healthcare Payers
- 8.1. Market Analysis, Insights and Forecast - by Product & Services
- 9. Middle East and Africa Accountable Care Solutions Market Analysis, Insights and Forecast, 2019-2031
- 9.1. Market Analysis, Insights and Forecast - by Product & Services
- 9.1.1. Electronic Health/Medical Records
- 9.1.2. Healthcare Analytics
- 9.1.3. Revenue Cycle Management Solutions (RCM)
- 9.1.4. Claims Management Solutions
- 9.1.5. Payment Management Solutions
- 9.1.6. Support and Maintenance Services
- 9.1.7. Other Products & Services
- 9.2. Market Analysis, Insights and Forecast - by Deployment
- 9.2.1. On-premise
- 9.2.2. Web & Cloud-Based
- 9.3. Market Analysis, Insights and Forecast - by End User
- 9.3.1. Healthcare Providers
- 9.3.2. Healthcare Payers
- 9.1. Market Analysis, Insights and Forecast - by Product & Services
- 10. South America Accountable Care Solutions Market Analysis, Insights and Forecast, 2019-2031
- 10.1. Market Analysis, Insights and Forecast - by Product & Services
- 10.1.1. Electronic Health/Medical Records
- 10.1.2. Healthcare Analytics
- 10.1.3. Revenue Cycle Management Solutions (RCM)
- 10.1.4. Claims Management Solutions
- 10.1.5. Payment Management Solutions
- 10.1.6. Support and Maintenance Services
- 10.1.7. Other Products & Services
- 10.2. Market Analysis, Insights and Forecast - by Deployment
- 10.2.1. On-premise
- 10.2.2. Web & Cloud-Based
- 10.3. Market Analysis, Insights and Forecast - by End User
- 10.3.1. Healthcare Providers
- 10.3.2. Healthcare Payers
- 10.1. Market Analysis, Insights and Forecast - by Product & Services
- 11. North America Accountable Care Solutions Market Analysis, Insights and Forecast, 2019-2031
- 11.1. Market Analysis, Insights and Forecast - By Country/Sub-region
- 11.1.1 United States
- 11.1.2 Canada
- 11.1.3 Mexico
- 12. Europe Accountable Care Solutions Market Analysis, Insights and Forecast, 2019-2031
- 12.1. Market Analysis, Insights and Forecast - By Country/Sub-region
- 12.1.1 Germany
- 12.1.2 United Kingdom
- 12.1.3 France
- 12.1.4 Italy
- 12.1.5 Spain
- 12.1.6 Rest of Europe
- 13. Asia Pacific Accountable Care Solutions Market Analysis, Insights and Forecast, 2019-2031
- 13.1. Market Analysis, Insights and Forecast - By Country/Sub-region
- 13.1.1 China
- 13.1.2 Japan
- 13.1.3 India
- 13.1.4 Australia
- 13.1.5 South Korea
- 13.1.6 Rest of Asia Pacific
- 14. Middle East and Africa Accountable Care Solutions Market Analysis, Insights and Forecast, 2019-2031
- 14.1. Market Analysis, Insights and Forecast - By Country/Sub-region
- 14.1.1 GCC
- 14.1.2 South Africa
- 14.1.3 Rest of Middle East and Africa
- 15. South America Accountable Care Solutions Market Analysis, Insights and Forecast, 2019-2031
- 15.1. Market Analysis, Insights and Forecast - By Country/Sub-region
- 15.1.1 Brazil
- 15.1.2 Argentina
- 15.1.3 Rest of South America
- 16. Competitive Analysis
- 16.1. Global Market Share Analysis 2024
- 16.2. Company Profiles
- 16.2.1 Mckesson Corporation
- 16.2.1.1. Overview
- 16.2.1.2. Products
- 16.2.1.3. SWOT Analysis
- 16.2.1.4. Recent Developments
- 16.2.1.5. Financials (Based on Availability)
- 16.2.2 Allscripts Healthcare Solutions
- 16.2.2.1. Overview
- 16.2.2.2. Products
- 16.2.2.3. SWOT Analysis
- 16.2.2.4. Recent Developments
- 16.2.2.5. Financials (Based on Availability)
- 16.2.3 Epic Systems Corporation
- 16.2.3.1. Overview
- 16.2.3.2. Products
- 16.2.3.3. SWOT Analysis
- 16.2.3.4. Recent Developments
- 16.2.3.5. Financials (Based on Availability)
- 16.2.4 Eclinicalworks LLC
- 16.2.4.1. Overview
- 16.2.4.2. Products
- 16.2.4.3. SWOT Analysis
- 16.2.4.4. Recent Developments
- 16.2.4.5. Financials (Based on Availability)
- 16.2.5 UnitedHealth Group Incorporated
- 16.2.5.1. Overview
- 16.2.5.2. Products
- 16.2.5.3. SWOT Analysis
- 16.2.5.4. Recent Developments
- 16.2.5.5. Financials (Based on Availability)
- 16.2.6 Verisk Analytics Inc
- 16.2.6.1. Overview
- 16.2.6.2. Products
- 16.2.6.3. SWOT Analysis
- 16.2.6.4. Recent Developments
- 16.2.6.5. Financials (Based on Availability)
- 16.2.7 Constellation Software
- 16.2.7.1. Overview
- 16.2.7.2. Products
- 16.2.7.3. SWOT Analysis
- 16.2.7.4. Recent Developments
- 16.2.7.5. Financials (Based on Availability)
- 16.2.8 IBM Healthcare
- 16.2.8.1. Overview
- 16.2.8.2. Products
- 16.2.8.3. SWOT Analysis
- 16.2.8.4. Recent Developments
- 16.2.8.5. Financials (Based on Availability)
- 16.2.9 Cerner Corporation
- 16.2.9.1. Overview
- 16.2.9.2. Products
- 16.2.9.3. SWOT Analysis
- 16.2.9.4. Recent Developments
- 16.2.9.5. Financials (Based on Availability)
- 16.2.10 ZeOmega Inc
- 16.2.10.1. Overview
- 16.2.10.2. Products
- 16.2.10.3. SWOT Analysis
- 16.2.10.4. Recent Developments
- 16.2.10.5. Financials (Based on Availability)
- 16.2.11 Aetna Inc
- 16.2.11.1. Overview
- 16.2.11.2. Products
- 16.2.11.3. SWOT Analysis
- 16.2.11.4. Recent Developments
- 16.2.11.5. Financials (Based on Availability)
- 16.2.12 Athenahealth Inc
- 16.2.12.1. Overview
- 16.2.12.2. Products
- 16.2.12.3. SWOT Analysis
- 16.2.12.4. Recent Developments
- 16.2.12.5. Financials (Based on Availability)
- 16.2.1 Mckesson Corporation
List of Figures
- Figure 1: Global Accountable Care Solutions Market Revenue Breakdown (Million, %) by Region 2024 & 2032
- Figure 2: Global Accountable Care Solutions Market Volume Breakdown (K Unit, %) by Region 2024 & 2032
- Figure 3: North America Accountable Care Solutions Market Revenue (Million), by Country 2024 & 2032
- Figure 4: North America Accountable Care Solutions Market Volume (K Unit), by Country 2024 & 2032
- Figure 5: North America Accountable Care Solutions Market Revenue Share (%), by Country 2024 & 2032
- Figure 6: North America Accountable Care Solutions Market Volume Share (%), by Country 2024 & 2032
- Figure 7: Europe Accountable Care Solutions Market Revenue (Million), by Country 2024 & 2032
- Figure 8: Europe Accountable Care Solutions Market Volume (K Unit), by Country 2024 & 2032
- Figure 9: Europe Accountable Care Solutions Market Revenue Share (%), by Country 2024 & 2032
- Figure 10: Europe Accountable Care Solutions Market Volume Share (%), by Country 2024 & 2032
- Figure 11: Asia Pacific Accountable Care Solutions Market Revenue (Million), by Country 2024 & 2032
- Figure 12: Asia Pacific Accountable Care Solutions Market Volume (K Unit), by Country 2024 & 2032
- Figure 13: Asia Pacific Accountable Care Solutions Market Revenue Share (%), by Country 2024 & 2032
- Figure 14: Asia Pacific Accountable Care Solutions Market Volume Share (%), by Country 2024 & 2032
- Figure 15: Middle East and Africa Accountable Care Solutions Market Revenue (Million), by Country 2024 & 2032
- Figure 16: Middle East and Africa Accountable Care Solutions Market Volume (K Unit), by Country 2024 & 2032
- Figure 17: Middle East and Africa Accountable Care Solutions Market Revenue Share (%), by Country 2024 & 2032
- Figure 18: Middle East and Africa Accountable Care Solutions Market Volume Share (%), by Country 2024 & 2032
- Figure 19: South America Accountable Care Solutions Market Revenue (Million), by Country 2024 & 2032
- Figure 20: South America Accountable Care Solutions Market Volume (K Unit), by Country 2024 & 2032
- Figure 21: South America Accountable Care Solutions Market Revenue Share (%), by Country 2024 & 2032
- Figure 22: South America Accountable Care Solutions Market Volume Share (%), by Country 2024 & 2032
- Figure 23: North America Accountable Care Solutions Market Revenue (Million), by Product & Services 2024 & 2032
- Figure 24: North America Accountable Care Solutions Market Volume (K Unit), by Product & Services 2024 & 2032
- Figure 25: North America Accountable Care Solutions Market Revenue Share (%), by Product & Services 2024 & 2032
- Figure 26: North America Accountable Care Solutions Market Volume Share (%), by Product & Services 2024 & 2032
- Figure 27: North America Accountable Care Solutions Market Revenue (Million), by Deployment 2024 & 2032
- Figure 28: North America Accountable Care Solutions Market Volume (K Unit), by Deployment 2024 & 2032
- Figure 29: North America Accountable Care Solutions Market Revenue Share (%), by Deployment 2024 & 2032
- Figure 30: North America Accountable Care Solutions Market Volume Share (%), by Deployment 2024 & 2032
- Figure 31: North America Accountable Care Solutions Market Revenue (Million), by End User 2024 & 2032
- Figure 32: North America Accountable Care Solutions Market Volume (K Unit), by End User 2024 & 2032
- Figure 33: North America Accountable Care Solutions Market Revenue Share (%), by End User 2024 & 2032
- Figure 34: North America Accountable Care Solutions Market Volume Share (%), by End User 2024 & 2032
- Figure 35: North America Accountable Care Solutions Market Revenue (Million), by Country 2024 & 2032
- Figure 36: North America Accountable Care Solutions Market Volume (K Unit), by Country 2024 & 2032
- Figure 37: North America Accountable Care Solutions Market Revenue Share (%), by Country 2024 & 2032
- Figure 38: North America Accountable Care Solutions Market Volume Share (%), by Country 2024 & 2032
- Figure 39: Europe Accountable Care Solutions Market Revenue (Million), by Product & Services 2024 & 2032
- Figure 40: Europe Accountable Care Solutions Market Volume (K Unit), by Product & Services 2024 & 2032
- Figure 41: Europe Accountable Care Solutions Market Revenue Share (%), by Product & Services 2024 & 2032
- Figure 42: Europe Accountable Care Solutions Market Volume Share (%), by Product & Services 2024 & 2032
- Figure 43: Europe Accountable Care Solutions Market Revenue (Million), by Deployment 2024 & 2032
- Figure 44: Europe Accountable Care Solutions Market Volume (K Unit), by Deployment 2024 & 2032
- Figure 45: Europe Accountable Care Solutions Market Revenue Share (%), by Deployment 2024 & 2032
- Figure 46: Europe Accountable Care Solutions Market Volume Share (%), by Deployment 2024 & 2032
- Figure 47: Europe Accountable Care Solutions Market Revenue (Million), by End User 2024 & 2032
- Figure 48: Europe Accountable Care Solutions Market Volume (K Unit), by End User 2024 & 2032
- Figure 49: Europe Accountable Care Solutions Market Revenue Share (%), by End User 2024 & 2032
- Figure 50: Europe Accountable Care Solutions Market Volume Share (%), by End User 2024 & 2032
- Figure 51: Europe Accountable Care Solutions Market Revenue (Million), by Country 2024 & 2032
- Figure 52: Europe Accountable Care Solutions Market Volume (K Unit), by Country 2024 & 2032
- Figure 53: Europe Accountable Care Solutions Market Revenue Share (%), by Country 2024 & 2032
- Figure 54: Europe Accountable Care Solutions Market Volume Share (%), by Country 2024 & 2032
- Figure 55: Asia Pacific Accountable Care Solutions Market Revenue (Million), by Product & Services 2024 & 2032
- Figure 56: Asia Pacific Accountable Care Solutions Market Volume (K Unit), by Product & Services 2024 & 2032
- Figure 57: Asia Pacific Accountable Care Solutions Market Revenue Share (%), by Product & Services 2024 & 2032
- Figure 58: Asia Pacific Accountable Care Solutions Market Volume Share (%), by Product & Services 2024 & 2032
- Figure 59: Asia Pacific Accountable Care Solutions Market Revenue (Million), by Deployment 2024 & 2032
- Figure 60: Asia Pacific Accountable Care Solutions Market Volume (K Unit), by Deployment 2024 & 2032
- Figure 61: Asia Pacific Accountable Care Solutions Market Revenue Share (%), by Deployment 2024 & 2032
- Figure 62: Asia Pacific Accountable Care Solutions Market Volume Share (%), by Deployment 2024 & 2032
- Figure 63: Asia Pacific Accountable Care Solutions Market Revenue (Million), by End User 2024 & 2032
- Figure 64: Asia Pacific Accountable Care Solutions Market Volume (K Unit), by End User 2024 & 2032
- Figure 65: Asia Pacific Accountable Care Solutions Market Revenue Share (%), by End User 2024 & 2032
- Figure 66: Asia Pacific Accountable Care Solutions Market Volume Share (%), by End User 2024 & 2032
- Figure 67: Asia Pacific Accountable Care Solutions Market Revenue (Million), by Country 2024 & 2032
- Figure 68: Asia Pacific Accountable Care Solutions Market Volume (K Unit), by Country 2024 & 2032
- Figure 69: Asia Pacific Accountable Care Solutions Market Revenue Share (%), by Country 2024 & 2032
- Figure 70: Asia Pacific Accountable Care Solutions Market Volume Share (%), by Country 2024 & 2032
- Figure 71: Middle East and Africa Accountable Care Solutions Market Revenue (Million), by Product & Services 2024 & 2032
- Figure 72: Middle East and Africa Accountable Care Solutions Market Volume (K Unit), by Product & Services 2024 & 2032
- Figure 73: Middle East and Africa Accountable Care Solutions Market Revenue Share (%), by Product & Services 2024 & 2032
- Figure 74: Middle East and Africa Accountable Care Solutions Market Volume Share (%), by Product & Services 2024 & 2032
- Figure 75: Middle East and Africa Accountable Care Solutions Market Revenue (Million), by Deployment 2024 & 2032
- Figure 76: Middle East and Africa Accountable Care Solutions Market Volume (K Unit), by Deployment 2024 & 2032
- Figure 77: Middle East and Africa Accountable Care Solutions Market Revenue Share (%), by Deployment 2024 & 2032
- Figure 78: Middle East and Africa Accountable Care Solutions Market Volume Share (%), by Deployment 2024 & 2032
- Figure 79: Middle East and Africa Accountable Care Solutions Market Revenue (Million), by End User 2024 & 2032
- Figure 80: Middle East and Africa Accountable Care Solutions Market Volume (K Unit), by End User 2024 & 2032
- Figure 81: Middle East and Africa Accountable Care Solutions Market Revenue Share (%), by End User 2024 & 2032
- Figure 82: Middle East and Africa Accountable Care Solutions Market Volume Share (%), by End User 2024 & 2032
- Figure 83: Middle East and Africa Accountable Care Solutions Market Revenue (Million), by Country 2024 & 2032
- Figure 84: Middle East and Africa Accountable Care Solutions Market Volume (K Unit), by Country 2024 & 2032
- Figure 85: Middle East and Africa Accountable Care Solutions Market Revenue Share (%), by Country 2024 & 2032
- Figure 86: Middle East and Africa Accountable Care Solutions Market Volume Share (%), by Country 2024 & 2032
- Figure 87: South America Accountable Care Solutions Market Revenue (Million), by Product & Services 2024 & 2032
- Figure 88: South America Accountable Care Solutions Market Volume (K Unit), by Product & Services 2024 & 2032
- Figure 89: South America Accountable Care Solutions Market Revenue Share (%), by Product & Services 2024 & 2032
- Figure 90: South America Accountable Care Solutions Market Volume Share (%), by Product & Services 2024 & 2032
- Figure 91: South America Accountable Care Solutions Market Revenue (Million), by Deployment 2024 & 2032
- Figure 92: South America Accountable Care Solutions Market Volume (K Unit), by Deployment 2024 & 2032
- Figure 93: South America Accountable Care Solutions Market Revenue Share (%), by Deployment 2024 & 2032
- Figure 94: South America Accountable Care Solutions Market Volume Share (%), by Deployment 2024 & 2032
- Figure 95: South America Accountable Care Solutions Market Revenue (Million), by End User 2024 & 2032
- Figure 96: South America Accountable Care Solutions Market Volume (K Unit), by End User 2024 & 2032
- Figure 97: South America Accountable Care Solutions Market Revenue Share (%), by End User 2024 & 2032
- Figure 98: South America Accountable Care Solutions Market Volume Share (%), by End User 2024 & 2032
- Figure 99: South America Accountable Care Solutions Market Revenue (Million), by Country 2024 & 2032
- Figure 100: South America Accountable Care Solutions Market Volume (K Unit), by Country 2024 & 2032
- Figure 101: South America Accountable Care Solutions Market Revenue Share (%), by Country 2024 & 2032
- Figure 102: South America Accountable Care Solutions Market Volume Share (%), by Country 2024 & 2032
List of Tables
- Table 1: Global Accountable Care Solutions Market Revenue Million Forecast, by Region 2019 & 2032
- Table 2: Global Accountable Care Solutions Market Volume K Unit Forecast, by Region 2019 & 2032
- Table 3: Global Accountable Care Solutions Market Revenue Million Forecast, by Product & Services 2019 & 2032
- Table 4: Global Accountable Care Solutions Market Volume K Unit Forecast, by Product & Services 2019 & 2032
- Table 5: Global Accountable Care Solutions Market Revenue Million Forecast, by Deployment 2019 & 2032
- Table 6: Global Accountable Care Solutions Market Volume K Unit Forecast, by Deployment 2019 & 2032
- Table 7: Global Accountable Care Solutions Market Revenue Million Forecast, by End User 2019 & 2032
- Table 8: Global Accountable Care Solutions Market Volume K Unit Forecast, by End User 2019 & 2032
- Table 9: Global Accountable Care Solutions Market Revenue Million Forecast, by Region 2019 & 2032
- Table 10: Global Accountable Care Solutions Market Volume K Unit Forecast, by Region 2019 & 2032
- Table 11: Global Accountable Care Solutions Market Revenue Million Forecast, by Country 2019 & 2032
- Table 12: Global Accountable Care Solutions Market Volume K Unit Forecast, by Country 2019 & 2032
- Table 13: United States Accountable Care Solutions Market Revenue (Million) Forecast, by Application 2019 & 2032
- Table 14: United States Accountable Care Solutions Market Volume (K Unit) Forecast, by Application 2019 & 2032
- Table 15: Canada Accountable Care Solutions Market Revenue (Million) Forecast, by Application 2019 & 2032
- Table 16: Canada Accountable Care Solutions Market Volume (K Unit) Forecast, by Application 2019 & 2032
- Table 17: Mexico Accountable Care Solutions Market Revenue (Million) Forecast, by Application 2019 & 2032
- Table 18: Mexico Accountable Care Solutions Market Volume (K Unit) Forecast, by Application 2019 & 2032
- Table 19: Global Accountable Care Solutions Market Revenue Million Forecast, by Country 2019 & 2032
- Table 20: Global Accountable Care Solutions Market Volume K Unit Forecast, by Country 2019 & 2032
- Table 21: Germany Accountable Care Solutions Market Revenue (Million) Forecast, by Application 2019 & 2032
- Table 22: Germany Accountable Care Solutions Market Volume (K Unit) Forecast, by Application 2019 & 2032
- Table 23: United Kingdom Accountable Care Solutions Market Revenue (Million) Forecast, by Application 2019 & 2032
- Table 24: United Kingdom Accountable Care Solutions Market Volume (K Unit) Forecast, by Application 2019 & 2032
- Table 25: France Accountable Care Solutions Market Revenue (Million) Forecast, by Application 2019 & 2032
- Table 26: France Accountable Care Solutions Market Volume (K Unit) Forecast, by Application 2019 & 2032
- Table 27: Italy Accountable Care Solutions Market Revenue (Million) Forecast, by Application 2019 & 2032
- Table 28: Italy Accountable Care Solutions Market Volume (K Unit) Forecast, by Application 2019 & 2032
- Table 29: Spain Accountable Care Solutions Market Revenue (Million) Forecast, by Application 2019 & 2032
- Table 30: Spain Accountable Care Solutions Market Volume (K Unit) Forecast, by Application 2019 & 2032
- Table 31: Rest of Europe Accountable Care Solutions Market Revenue (Million) Forecast, by Application 2019 & 2032
- Table 32: Rest of Europe Accountable Care Solutions Market Volume (K Unit) Forecast, by Application 2019 & 2032
- Table 33: Global Accountable Care Solutions Market Revenue Million Forecast, by Country 2019 & 2032
- Table 34: Global Accountable Care Solutions Market Volume K Unit Forecast, by Country 2019 & 2032
- Table 35: China Accountable Care Solutions Market Revenue (Million) Forecast, by Application 2019 & 2032
- Table 36: China Accountable Care Solutions Market Volume (K Unit) Forecast, by Application 2019 & 2032
- Table 37: Japan Accountable Care Solutions Market Revenue (Million) Forecast, by Application 2019 & 2032
- Table 38: Japan Accountable Care Solutions Market Volume (K Unit) Forecast, by Application 2019 & 2032
- Table 39: India Accountable Care Solutions Market Revenue (Million) Forecast, by Application 2019 & 2032
- Table 40: India Accountable Care Solutions Market Volume (K Unit) Forecast, by Application 2019 & 2032
- Table 41: Australia Accountable Care Solutions Market Revenue (Million) Forecast, by Application 2019 & 2032
- Table 42: Australia Accountable Care Solutions Market Volume (K Unit) Forecast, by Application 2019 & 2032
- Table 43: South Korea Accountable Care Solutions Market Revenue (Million) Forecast, by Application 2019 & 2032
- Table 44: South Korea Accountable Care Solutions Market Volume (K Unit) Forecast, by Application 2019 & 2032
- Table 45: Rest of Asia Pacific Accountable Care Solutions Market Revenue (Million) Forecast, by Application 2019 & 2032
- Table 46: Rest of Asia Pacific Accountable Care Solutions Market Volume (K Unit) Forecast, by Application 2019 & 2032
- Table 47: Global Accountable Care Solutions Market Revenue Million Forecast, by Country 2019 & 2032
- Table 48: Global Accountable Care Solutions Market Volume K Unit Forecast, by Country 2019 & 2032
- Table 49: GCC Accountable Care Solutions Market Revenue (Million) Forecast, by Application 2019 & 2032
- Table 50: GCC Accountable Care Solutions Market Volume (K Unit) Forecast, by Application 2019 & 2032
- Table 51: South Africa Accountable Care Solutions Market Revenue (Million) Forecast, by Application 2019 & 2032
- Table 52: South Africa Accountable Care Solutions Market Volume (K Unit) Forecast, by Application 2019 & 2032
- Table 53: Rest of Middle East and Africa Accountable Care Solutions Market Revenue (Million) Forecast, by Application 2019 & 2032
- Table 54: Rest of Middle East and Africa Accountable Care Solutions Market Volume (K Unit) Forecast, by Application 2019 & 2032
- Table 55: Global Accountable Care Solutions Market Revenue Million Forecast, by Country 2019 & 2032
- Table 56: Global Accountable Care Solutions Market Volume K Unit Forecast, by Country 2019 & 2032
- Table 57: Brazil Accountable Care Solutions Market Revenue (Million) Forecast, by Application 2019 & 2032
- Table 58: Brazil Accountable Care Solutions Market Volume (K Unit) Forecast, by Application 2019 & 2032
- Table 59: Argentina Accountable Care Solutions Market Revenue (Million) Forecast, by Application 2019 & 2032
- Table 60: Argentina Accountable Care Solutions Market Volume (K Unit) Forecast, by Application 2019 & 2032
- Table 61: Rest of South America Accountable Care Solutions Market Revenue (Million) Forecast, by Application 2019 & 2032
- Table 62: Rest of South America Accountable Care Solutions Market Volume (K Unit) Forecast, by Application 2019 & 2032
- Table 63: Global Accountable Care Solutions Market Revenue Million Forecast, by Product & Services 2019 & 2032
- Table 64: Global Accountable Care Solutions Market Volume K Unit Forecast, by Product & Services 2019 & 2032
- Table 65: Global Accountable Care Solutions Market Revenue Million Forecast, by Deployment 2019 & 2032
- Table 66: Global Accountable Care Solutions Market Volume K Unit Forecast, by Deployment 2019 & 2032
- Table 67: Global Accountable Care Solutions Market Revenue Million Forecast, by End User 2019 & 2032
- Table 68: Global Accountable Care Solutions Market Volume K Unit Forecast, by End User 2019 & 2032
- Table 69: Global Accountable Care Solutions Market Revenue Million Forecast, by Country 2019 & 2032
- Table 70: Global Accountable Care Solutions Market Volume K Unit Forecast, by Country 2019 & 2032
- Table 71: United States Accountable Care Solutions Market Revenue (Million) Forecast, by Application 2019 & 2032
- Table 72: United States Accountable Care Solutions Market Volume (K Unit) Forecast, by Application 2019 & 2032
- Table 73: Canada Accountable Care Solutions Market Revenue (Million) Forecast, by Application 2019 & 2032
- Table 74: Canada Accountable Care Solutions Market Volume (K Unit) Forecast, by Application 2019 & 2032
- Table 75: Mexico Accountable Care Solutions Market Revenue (Million) Forecast, by Application 2019 & 2032
- Table 76: Mexico Accountable Care Solutions Market Volume (K Unit) Forecast, by Application 2019 & 2032
- Table 77: Global Accountable Care Solutions Market Revenue Million Forecast, by Product & Services 2019 & 2032
- Table 78: Global Accountable Care Solutions Market Volume K Unit Forecast, by Product & Services 2019 & 2032
- Table 79: Global Accountable Care Solutions Market Revenue Million Forecast, by Deployment 2019 & 2032
- Table 80: Global Accountable Care Solutions Market Volume K Unit Forecast, by Deployment 2019 & 2032
- Table 81: Global Accountable Care Solutions Market Revenue Million Forecast, by End User 2019 & 2032
- Table 82: Global Accountable Care Solutions Market Volume K Unit Forecast, by End User 2019 & 2032
- Table 83: Global Accountable Care Solutions Market Revenue Million Forecast, by Country 2019 & 2032
- Table 84: Global Accountable Care Solutions Market Volume K Unit Forecast, by Country 2019 & 2032
- Table 85: Germany Accountable Care Solutions Market Revenue (Million) Forecast, by Application 2019 & 2032
- Table 86: Germany Accountable Care Solutions Market Volume (K Unit) Forecast, by Application 2019 & 2032
- Table 87: United Kingdom Accountable Care Solutions Market Revenue (Million) Forecast, by Application 2019 & 2032
- Table 88: United Kingdom Accountable Care Solutions Market Volume (K Unit) Forecast, by Application 2019 & 2032
- Table 89: France Accountable Care Solutions Market Revenue (Million) Forecast, by Application 2019 & 2032
- Table 90: France Accountable Care Solutions Market Volume (K Unit) Forecast, by Application 2019 & 2032
- Table 91: Italy Accountable Care Solutions Market Revenue (Million) Forecast, by Application 2019 & 2032
- Table 92: Italy Accountable Care Solutions Market Volume (K Unit) Forecast, by Application 2019 & 2032
- Table 93: Spain Accountable Care Solutions Market Revenue (Million) Forecast, by Application 2019 & 2032
- Table 94: Spain Accountable Care Solutions Market Volume (K Unit) Forecast, by Application 2019 & 2032
- Table 95: Rest of Europe Accountable Care Solutions Market Revenue (Million) Forecast, by Application 2019 & 2032
- Table 96: Rest of Europe Accountable Care Solutions Market Volume (K Unit) Forecast, by Application 2019 & 2032
- Table 97: Global Accountable Care Solutions Market Revenue Million Forecast, by Product & Services 2019 & 2032
- Table 98: Global Accountable Care Solutions Market Volume K Unit Forecast, by Product & Services 2019 & 2032
- Table 99: Global Accountable Care Solutions Market Revenue Million Forecast, by Deployment 2019 & 2032
- Table 100: Global Accountable Care Solutions Market Volume K Unit Forecast, by Deployment 2019 & 2032
- Table 101: Global Accountable Care Solutions Market Revenue Million Forecast, by End User 2019 & 2032
- Table 102: Global Accountable Care Solutions Market Volume K Unit Forecast, by End User 2019 & 2032
- Table 103: Global Accountable Care Solutions Market Revenue Million Forecast, by Country 2019 & 2032
- Table 104: Global Accountable Care Solutions Market Volume K Unit Forecast, by Country 2019 & 2032
- Table 105: China Accountable Care Solutions Market Revenue (Million) Forecast, by Application 2019 & 2032
- Table 106: China Accountable Care Solutions Market Volume (K Unit) Forecast, by Application 2019 & 2032
- Table 107: Japan Accountable Care Solutions Market Revenue (Million) Forecast, by Application 2019 & 2032
- Table 108: Japan Accountable Care Solutions Market Volume (K Unit) Forecast, by Application 2019 & 2032
- Table 109: India Accountable Care Solutions Market Revenue (Million) Forecast, by Application 2019 & 2032
- Table 110: India Accountable Care Solutions Market Volume (K Unit) Forecast, by Application 2019 & 2032
- Table 111: Australia Accountable Care Solutions Market Revenue (Million) Forecast, by Application 2019 & 2032
- Table 112: Australia Accountable Care Solutions Market Volume (K Unit) Forecast, by Application 2019 & 2032
- Table 113: South Korea Accountable Care Solutions Market Revenue (Million) Forecast, by Application 2019 & 2032
- Table 114: South Korea Accountable Care Solutions Market Volume (K Unit) Forecast, by Application 2019 & 2032
- Table 115: Rest of Asia Pacific Accountable Care Solutions Market Revenue (Million) Forecast, by Application 2019 & 2032
- Table 116: Rest of Asia Pacific Accountable Care Solutions Market Volume (K Unit) Forecast, by Application 2019 & 2032
- Table 117: Global Accountable Care Solutions Market Revenue Million Forecast, by Product & Services 2019 & 2032
- Table 118: Global Accountable Care Solutions Market Volume K Unit Forecast, by Product & Services 2019 & 2032
- Table 119: Global Accountable Care Solutions Market Revenue Million Forecast, by Deployment 2019 & 2032
- Table 120: Global Accountable Care Solutions Market Volume K Unit Forecast, by Deployment 2019 & 2032
- Table 121: Global Accountable Care Solutions Market Revenue Million Forecast, by End User 2019 & 2032
- Table 122: Global Accountable Care Solutions Market Volume K Unit Forecast, by End User 2019 & 2032
- Table 123: Global Accountable Care Solutions Market Revenue Million Forecast, by Country 2019 & 2032
- Table 124: Global Accountable Care Solutions Market Volume K Unit Forecast, by Country 2019 & 2032
- Table 125: GCC Accountable Care Solutions Market Revenue (Million) Forecast, by Application 2019 & 2032
- Table 126: GCC Accountable Care Solutions Market Volume (K Unit) Forecast, by Application 2019 & 2032
- Table 127: South Africa Accountable Care Solutions Market Revenue (Million) Forecast, by Application 2019 & 2032
- Table 128: South Africa Accountable Care Solutions Market Volume (K Unit) Forecast, by Application 2019 & 2032
- Table 129: Rest of Middle East and Africa Accountable Care Solutions Market Revenue (Million) Forecast, by Application 2019 & 2032
- Table 130: Rest of Middle East and Africa Accountable Care Solutions Market Volume (K Unit) Forecast, by Application 2019 & 2032
- Table 131: Global Accountable Care Solutions Market Revenue Million Forecast, by Product & Services 2019 & 2032
- Table 132: Global Accountable Care Solutions Market Volume K Unit Forecast, by Product & Services 2019 & 2032
- Table 133: Global Accountable Care Solutions Market Revenue Million Forecast, by Deployment 2019 & 2032
- Table 134: Global Accountable Care Solutions Market Volume K Unit Forecast, by Deployment 2019 & 2032
- Table 135: Global Accountable Care Solutions Market Revenue Million Forecast, by End User 2019 & 2032
- Table 136: Global Accountable Care Solutions Market Volume K Unit Forecast, by End User 2019 & 2032
- Table 137: Global Accountable Care Solutions Market Revenue Million Forecast, by Country 2019 & 2032
- Table 138: Global Accountable Care Solutions Market Volume K Unit Forecast, by Country 2019 & 2032
- Table 139: Brazil Accountable Care Solutions Market Revenue (Million) Forecast, by Application 2019 & 2032
- Table 140: Brazil Accountable Care Solutions Market Volume (K Unit) Forecast, by Application 2019 & 2032
- Table 141: Argentina Accountable Care Solutions Market Revenue (Million) Forecast, by Application 2019 & 2032
- Table 142: Argentina Accountable Care Solutions Market Volume (K Unit) Forecast, by Application 2019 & 2032
- Table 143: Rest of South America Accountable Care Solutions Market Revenue (Million) Forecast, by Application 2019 & 2032
- Table 144: Rest of South America Accountable Care Solutions Market Volume (K Unit) Forecast, by Application 2019 & 2032
Frequently Asked Questions
1. What is the projected Compound Annual Growth Rate (CAGR) of the Accountable Care Solutions Market?
The projected CAGR is approximately 10.92%.
2. Which companies are prominent players in the Accountable Care Solutions Market?
Key companies in the market include Mckesson Corporation, Allscripts Healthcare Solutions, Epic Systems Corporation, Eclinicalworks LLC, UnitedHealth Group Incorporated, Verisk Analytics Inc, Constellation Software, IBM Healthcare, Cerner Corporation, ZeOmega Inc, Aetna Inc, Athenahealth Inc.
3. What are the main segments of the Accountable Care Solutions Market?
The market segments include Product & Services, Deployment, End User.
4. Can you provide details about the market size?
The market size is estimated to be USD 2.24 Million as of 2022.
5. What are some drivers contributing to market growth?
Emergence of Big Data in Healthcare; Government Regulations and Initiatives to Promote Patient-Centric Care; Increasing Demand to Curtail Healthcare Costs.
6. What are the notable trends driving market growth?
Electronic Health/Medical Records Segment is Expected to Hold a Significant Market Share Over the Forecast Period.
7. Are there any restraints impacting market growth?
Data Security and Privacy Concerns; High Investments Required for Supporting Infrastructure.
8. Can you provide examples of recent developments in the market?
In March 2022, Collaborative Health Systems, a population health management organization, and Community Care Alliance, an accountable care organization, entered into a venture.
9. What pricing options are available for accessing the report?
Pricing options include single-user, multi-user, and enterprise licenses priced at USD 4750, USD 5250, and USD 8750 respectively.
10. Is the market size provided in terms of value or volume?
The market size is provided in terms of value, measured in Million and volume, measured in K Unit.
11. Are there any specific market keywords associated with the report?
Yes, the market keyword associated with the report is "Accountable Care Solutions Market," which aids in identifying and referencing the specific market segment covered.
12. How do I determine which pricing option suits my needs best?
The pricing options vary based on user requirements and access needs. Individual users may opt for single-user licenses, while businesses requiring broader access may choose multi-user or enterprise licenses for cost-effective access to the report.
13. Are there any additional resources or data provided in the Accountable Care Solutions Market report?
While the report offers comprehensive insights, it's advisable to review the specific contents or supplementary materials provided to ascertain if additional resources or data are available.
14. How can I stay updated on further developments or reports in the Accountable Care Solutions Market?
To stay informed about further developments, trends, and reports in the Accountable Care Solutions Market, consider subscribing to industry newsletters, following relevant companies and organizations, or regularly checking reputable industry news sources and publications.
Methodology
Step 1 - Identification of Relevant Samples Size from Population Database


Step 2 - Approaches for Defining Global Market Size (Value, Volume* & Price*)

Note*: In applicable scenarios
Step 3 - Data Sources
Primary Research
- Web Analytics
- Survey Reports
- Research Institute
- Latest Research Reports
- Opinion Leaders
Secondary Research
- Annual Reports
- White Paper
- Latest Press Release
- Industry Association
- Paid Database
- Investor Presentations

Step 4 - Data Triangulation
Involves using different sources of information in order to increase the validity of a study
These sources are likely to be stakeholders in a program - participants, other researchers, program staff, other community members, and so on.
Then we put all data in single framework & apply various statistical tools to find out the dynamic on the market.
During the analysis stage, feedback from the stakeholder groups would be compared to determine areas of agreement as well as areas of divergence


