

Key Insights
The automotive 3D printing market is poised for significant expansion, projected to reach $5.93 billion by 2025, driven by a robust CAGR of 14.8%. This growth is underpinned by the increasing demand for lightweight vehicle components to enhance fuel efficiency. 3D printing's capacity to produce complex geometries from advanced materials like metal alloys, polymers, and ceramics is a key enabler. Furthermore, rapid prototyping and on-demand customized part production dramatically shorten development cycles and reduce costs, accelerating automotive innovation. The adoption of additive manufacturing techniques, including Selective Laser Melting (SLM), Selective Laser Sintering (SLS), and Fused Deposition Modeling (FDM), facilitates the creation of intricate parts unattainable with conventional methods. The market encompasses end-use part production, prototyping, and R&D, with hardware, software, and services contributing to its overall value. Prominent 3D printing firms and automotive manufacturers are actively investing in and integrating these technologies.
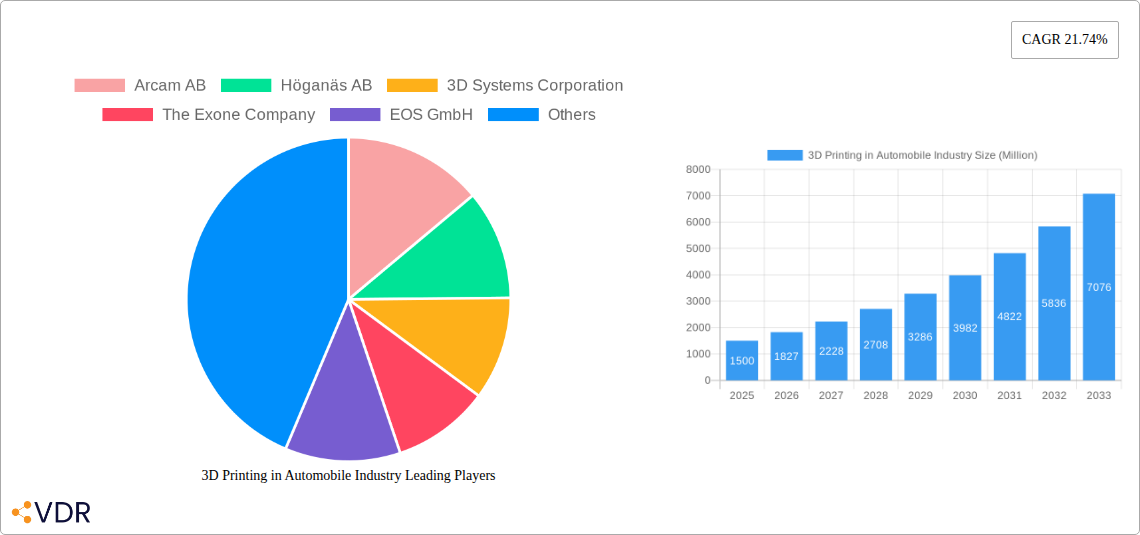
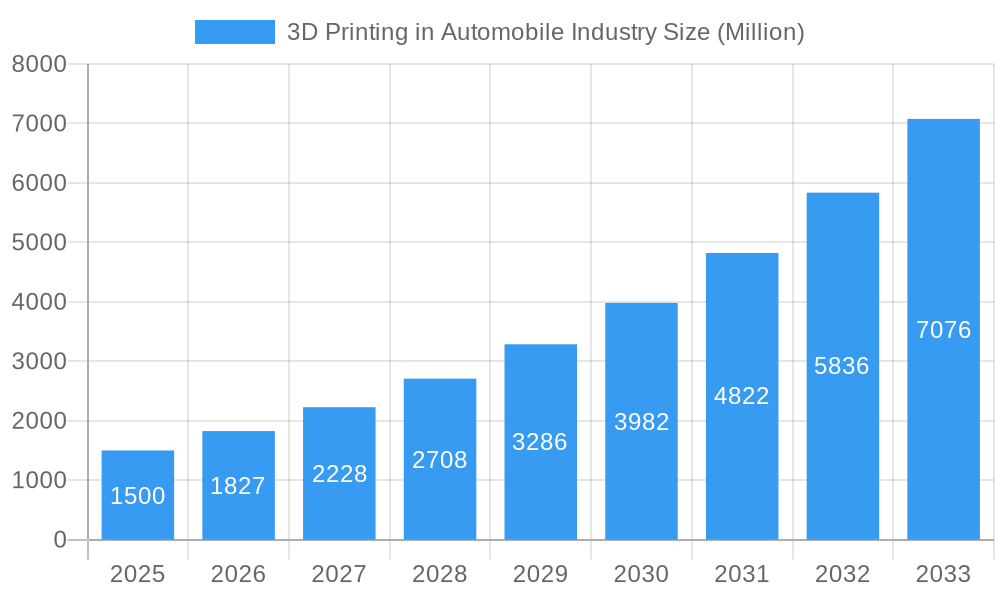
3D Printing in Automobile Industry Market Size (In Billion)
Future market expansion will be shaped by emerging trends, including the integration of 3D printing for customized and lightweight components in electric vehicles (EVs) and autonomous driving systems. Advances in material science and 3D printing technologies will unlock new levels of part complexity, functionality, and performance. While initial component costs and the requirement for skilled operators present challenges, ongoing technological advancements and economies of scale are expected to mitigate these constraints, ensuring continued market growth within the automotive sector. Key regional markets include North America, Europe, and Asia Pacific, with China and the United States being particularly significant contributors.
3D Printing in Automobile Industry Company Market Share
3D Printing in Automobile Industry: A Comprehensive Market Report (2019-2033)
This in-depth report provides a comprehensive analysis of the 3D printing market within the automotive industry, covering market dynamics, growth trends, regional dominance, product landscapes, key players, and future outlooks. The study period spans from 2019 to 2033, with 2025 serving as the base and estimated year. This report is essential for automotive manufacturers, 3D printing technology providers, material suppliers, and investors seeking to navigate this rapidly evolving landscape. The market is segmented by material type (metal, polymer, ceramic), application type (production, prototyping/R&D), technology type (SLS, SLA, DLP, EBM, SLM, FDM), and component type (hardware, software, service).
3D Printing in Automobile Industry Market Dynamics & Structure
The automotive 3D printing market exhibits a moderately concentrated structure, with key players like Stratasys Ltd, 3D Systems Corporation, and EOS GmbH holding significant market share. However, the market is witnessing increased participation from smaller, specialized firms, particularly in niche applications. Technological innovation, driven by advancements in materials science and printing technologies, is a primary growth driver. Stringent regulatory frameworks concerning safety and emissions influence adoption rates. Competitive substitutes, such as traditional manufacturing processes, present challenges, but the unique advantages of 3D printing, including design flexibility and reduced lead times, are fueling its growth. End-user demographics encompass both OEMs (Original Equipment Manufacturers) and Tier-1 suppliers, with a growing trend towards adoption across the supply chain. The market has seen significant M&A activity in recent years, exemplified by the merger of MakerBot and Ultimaker and Stratasys' acquisition of Covestro's additive materials business. These activities signal consolidation and a push towards vertical integration.
- Market Concentration: Moderately concentrated, with top players holding xx% market share in 2025.
- Technological Innovation: Rapid advancements in materials (e.g., high-strength polymers, metal alloys) and printing techniques (e.g., improved precision, faster speeds).
- Regulatory Framework: Stringent safety and emission standards influence adoption and material selection.
- Competitive Substitutes: Traditional manufacturing processes (injection molding, casting) offer competition, but 3D printing offers unique advantages.
- M&A Activity: xx major deals (acquisition/merger) recorded between 2019-2024, indicating industry consolidation.
- Innovation Barriers: High initial investment costs, skill gap in operation and maintenance, and limited material choices.
3D Printing in Automobile Industry Growth Trends & Insights
The global 3D printing in the automotive industry market is projected to experience significant growth during the forecast period (2025-2033), driven by increasing demand for lightweight components, customized designs, and on-demand manufacturing. The market size is estimated at xx million units in 2025 and is expected to reach xx million units by 2033, exhibiting a CAGR of xx%. This growth is fueled by the rising adoption of additive manufacturing across the entire automotive value chain, from prototyping and tooling to end-use part production. Technological advancements such as the development of high-performance materials and faster printing speeds are accelerating this adoption. Consumer demand for vehicle personalization and reduced production lead times also contributes to market growth. The shift towards electric vehicles and the need for complex, lightweight designs are further boosting the demand for 3D printing solutions.
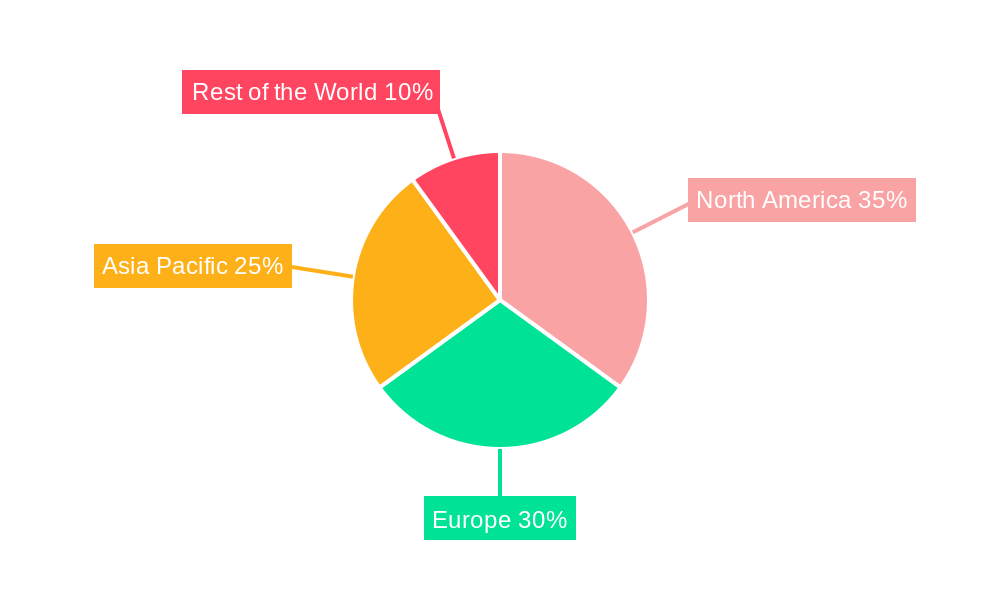
Dominant Regions, Countries, or Segments in 3D Printing in Automobile Industry
The North American and European regions currently dominate the automotive 3D printing market, driven by significant investments in research and development, a robust automotive industry, and the presence of major 3D printing technology providers. Within these regions, Germany and the United States hold leading positions due to their established automotive manufacturing bases and technological advancements. However, the Asia-Pacific region is anticipated to experience the fastest growth rate in the coming years due to increasing automotive production in countries like China and Japan, along with government support for technological innovation.
- By Material Type: Metal dominates due to its use in high-performance components. Polymer segments are growing rapidly due to its use in prototyping. Ceramic's application is limited.
- By Application Type: Production applications are experiencing higher growth than prototyping/R&D, driven by cost reduction and increased efficiency.
- By Technology Type: SLS and SLM dominate the market due to their ability to produce high-quality metal parts. FDM is popular for prototyping.
- Key Drivers: Government initiatives promoting advanced manufacturing, increasing investments in R&D, and the growing demand for lightweight vehicles.
Market Share (2025): North America (xx%), Europe (xx%), Asia-Pacific (xx%), Rest of World (xx%).
3D Printing in Automobile Industry Product Landscape
The automotive 3D printing product landscape is characterized by a wide range of materials, technologies, and software solutions. Manufacturers are focused on developing high-performance materials with improved strength, durability, and weight reduction capabilities. Advancements in printing technologies include faster printing speeds, increased precision, and larger build volumes. Software solutions are crucial for design optimization, simulation, and production management. Unique selling propositions include cost-effectiveness compared to traditional methods, customization capabilities, and design flexibility. Technological advancements are driving the creation of more complex and intricate parts for vehicles, improving functionality and performance.
Key Drivers, Barriers & Challenges in 3D Printing in Automobile Industry
Key Drivers:
- Technological advancements in materials and printing processes.
- Rising demand for customized and lightweight vehicle components.
- Government incentives and subsidies promoting advanced manufacturing.
Challenges and Restraints:
- High initial investment costs for 3D printing equipment.
- Limited material availability and compatibility with specific applications.
- Supply chain disruptions impacting material sourcing and equipment delivery.
- Skilled labor shortage hindering adoption and efficient operation. This shortage is estimated to impact production by xx% in 2025.
Emerging Opportunities in 3D Printing in Automobile Industry
- Growing demand for customized vehicle parts and personalized interiors.
- Expansion into new applications such as on-demand manufacturing of tooling and fixtures.
- Development of new materials with enhanced properties (e.g., bio-based polymers, recyclable materials).
- Integration of 3D printing into circular economy models for sustainable manufacturing.
Growth Accelerators in the 3D Printing in Automobile Industry Industry
Strategic partnerships between automotive manufacturers and 3D printing technology providers are accelerating market growth. These collaborations are fostering the development of new applications and materials, along with improving production processes. Technological advancements such as artificial intelligence (AI) for process optimization and automation are further propelling expansion. Increased adoption of cloud-based software solutions for remote monitoring and data analysis is simplifying operations and reducing costs. Expansion into new geographic markets, particularly in developing economies, offers further growth potential.
Key Players Shaping the 3D Printing in Automobile Industry Market
- Arcam AB
- Höganäs AB
- 3D Systems Corporation
- The Exone Company
- EOS GmbH
- Voxeljet AG
- Materialise NV
- Moog Inc
- Ultimaker BV
- Stratasys Ltd
- Envisiontec GmbH
Notable Milestones in 3D Printing in Automobile Industry Sector
- August 2022: Voxeljet AG signed a sale-leaseback agreement generating USD 26.78 million.
- August 2022: Stratasys Ltd. agreed to acquire Covestro AG's additive materials business.
- September 2022: Materialise N.V. acquired Identify3D, enhancing its Co-AM platform security.
- September 2022: Stratasys Ltd.'s MakerBot merged with Ultimaker, creating a new company.
- November 2022: 3D Systems and ALM partnered to expand access to 3D printing materials.
- November 2022: Desktop Metal secured a USD 9 million order for binder jet systems from a German automaker.
In-Depth 3D Printing in Automobile Industry Market Outlook
The future of 3D printing in the automotive industry is bright, with substantial growth potential driven by continuous technological advancements, expanding applications, and increasing industry collaboration. The market is poised to benefit from the growing demand for lightweight, high-performance components, along with the increasing adoption of additive manufacturing across the entire automotive value chain. Strategic partnerships and investments in R&D will further accelerate market expansion, creating significant opportunities for both established players and new entrants. The focus on sustainable manufacturing practices and the development of eco-friendly materials will also shape future market trends.
3D Printing in Automobile Industry Segmentation
-
1. Technology Type
- 1.1. Selective Laser Sintering (SLS)
- 1.2. Stereo Lithography (SLA)
- 1.3. Digital Light Processing (DLP)
- 1.4. Electronic Beam Melting (EBM)
- 1.5. Selective Laser Melting (SLM)
- 1.6. Fused Deposition Modeling (FDM)
-
2. Component Type
- 2.1. Hardware
- 2.2. Software
- 2.3. Service
-
3. Material Type
- 3.1. Metal
- 3.2. Polymer
- 3.3. Ceramic
-
4. Application Type
- 4.1. Production
- 4.2. Prototyping/R&D
3D Printing in Automobile Industry Segmentation By Geography
-
1. North America
- 1.1. United States
- 1.2. Canada
- 1.3. Rest of North America
-
2. Europe
- 2.1. Germany
- 2.2. United Kingdom
- 2.3. France
- 2.4. Rest of Europe
-
3. Asia Pacific
- 3.1. China
- 3.2. Japan
- 3.3. India
- 3.4. Rest of Asia Pacific
-
4. Rest of the World
- 4.1. Brazil
- 4.2. Argentina
- 4.3. Other Countries
3D Printing in Automobile Industry Regional Market Share
Geographic Coverage of 3D Printing in Automobile Industry
3D Printing in Automobile Industry REPORT HIGHLIGHTS
| Aspects | Details |
|---|---|
| Study Period | 2020-2034 |
| Base Year | 2025 |
| Estimated Year | 2026 |
| Forecast Period | 2026-2034 |
| Historical Period | 2020-2025 |
| Growth Rate | CAGR of 14.8% from 2020-2034 |
| Segmentation |
|
Table of Contents
- 1. Introduction
- 1.1. Research Scope
- 1.2. Market Segmentation
- 1.3. Research Objective
- 1.4. Definitions and Assumptions
- 2. Executive Summary
- 2.1. Market Snapshot
- 3. Market Dynamics
- 3.1. Market Drivers
- 3.2. Market Restrains
- 3.3. Market Trends
- 3.4. Market Opportunities
- 4. Market Factor Analysis
- 4.1. Porters Five Forces
- 4.1.1. Bargaining Power of Suppliers
- 4.1.2. Bargaining Power of Buyers
- 4.1.3. Threat of New Entrants
- 4.1.4. Threat of Substitutes
- 4.1.5. Competitive Rivalry
- 4.2. PESTEL analysis
- 4.3. BCG Analysis
- 4.3.1. Stars (High Growth, High Market Share)
- 4.3.2. Cash Cows (Low Growth, High Market Share)
- 4.3.3. Question Mark (High Growth, Low Market Share)
- 4.3.4. Dogs (Low Growth, Low Market Share)
- 4.4. Ansoff Matrix Analysis
- 4.5. Supply Chain Analysis
- 4.6. Regulatory Landscape
- 4.7. Current Market Potential and Opportunity Assessment (TAM–SAM–SOM Framework)
- 4.8. VDR Analyst Note
- 4.1. Porters Five Forces
- 5. Market Analysis, Insights and Forecast 2021-2033
- 5.1. Market Analysis, Insights and Forecast - by Technology Type
- 5.1.1. Selective Laser Sintering (SLS)
- 5.1.2. Stereo Lithography (SLA)
- 5.1.3. Digital Light Processing (DLP)
- 5.1.4. Electronic Beam Melting (EBM)
- 5.1.5. Selective Laser Melting (SLM)
- 5.1.6. Fused Deposition Modeling (FDM)
- 5.2. Market Analysis, Insights and Forecast - by Component Type
- 5.2.1. Hardware
- 5.2.2. Software
- 5.2.3. Service
- 5.3. Market Analysis, Insights and Forecast - by Material Type
- 5.3.1. Metal
- 5.3.2. Polymer
- 5.3.3. Ceramic
- 5.4. Market Analysis, Insights and Forecast - by Application Type
- 5.4.1. Production
- 5.4.2. Prototyping/R&D
- 5.5. Market Analysis, Insights and Forecast - by Region
- 5.5.1. North America
- 5.5.2. Europe
- 5.5.3. Asia Pacific
- 5.5.4. Rest of the World
- 5.1. Market Analysis, Insights and Forecast - by Technology Type
- 6. Global 3D Printing in Automobile Industry Analysis, Insights and Forecast, 2021-2033
- 6.1. Market Analysis, Insights and Forecast - by Technology Type
- 6.1.1. Selective Laser Sintering (SLS)
- 6.1.2. Stereo Lithography (SLA)
- 6.1.3. Digital Light Processing (DLP)
- 6.1.4. Electronic Beam Melting (EBM)
- 6.1.5. Selective Laser Melting (SLM)
- 6.1.6. Fused Deposition Modeling (FDM)
- 6.2. Market Analysis, Insights and Forecast - by Component Type
- 6.2.1. Hardware
- 6.2.2. Software
- 6.2.3. Service
- 6.3. Market Analysis, Insights and Forecast - by Material Type
- 6.3.1. Metal
- 6.3.2. Polymer
- 6.3.3. Ceramic
- 6.4. Market Analysis, Insights and Forecast - by Application Type
- 6.4.1. Production
- 6.4.2. Prototyping/R&D
- 6.1. Market Analysis, Insights and Forecast - by Technology Type
- 7. North America 3D Printing in Automobile Industry Analysis, Insights and Forecast, 2021-2033
- 7.1. Market Analysis, Insights and Forecast - by Technology Type
- 7.1.1. Selective Laser Sintering (SLS)
- 7.1.2. Stereo Lithography (SLA)
- 7.1.3. Digital Light Processing (DLP)
- 7.1.4. Electronic Beam Melting (EBM)
- 7.1.5. Selective Laser Melting (SLM)
- 7.1.6. Fused Deposition Modeling (FDM)
- 7.2. Market Analysis, Insights and Forecast - by Component Type
- 7.2.1. Hardware
- 7.2.2. Software
- 7.2.3. Service
- 7.3. Market Analysis, Insights and Forecast - by Material Type
- 7.3.1. Metal
- 7.3.2. Polymer
- 7.3.3. Ceramic
- 7.4. Market Analysis, Insights and Forecast - by Application Type
- 7.4.1. Production
- 7.4.2. Prototyping/R&D
- 7.1. Market Analysis, Insights and Forecast - by Technology Type
- 8. Europe 3D Printing in Automobile Industry Analysis, Insights and Forecast, 2021-2033
- 8.1. Market Analysis, Insights and Forecast - by Technology Type
- 8.1.1. Selective Laser Sintering (SLS)
- 8.1.2. Stereo Lithography (SLA)
- 8.1.3. Digital Light Processing (DLP)
- 8.1.4. Electronic Beam Melting (EBM)
- 8.1.5. Selective Laser Melting (SLM)
- 8.1.6. Fused Deposition Modeling (FDM)
- 8.2. Market Analysis, Insights and Forecast - by Component Type
- 8.2.1. Hardware
- 8.2.2. Software
- 8.2.3. Service
- 8.3. Market Analysis, Insights and Forecast - by Material Type
- 8.3.1. Metal
- 8.3.2. Polymer
- 8.3.3. Ceramic
- 8.4. Market Analysis, Insights and Forecast - by Application Type
- 8.4.1. Production
- 8.4.2. Prototyping/R&D
- 8.1. Market Analysis, Insights and Forecast - by Technology Type
- 9. Asia Pacific 3D Printing in Automobile Industry Analysis, Insights and Forecast, 2021-2033
- 9.1. Market Analysis, Insights and Forecast - by Technology Type
- 9.1.1. Selective Laser Sintering (SLS)
- 9.1.2. Stereo Lithography (SLA)
- 9.1.3. Digital Light Processing (DLP)
- 9.1.4. Electronic Beam Melting (EBM)
- 9.1.5. Selective Laser Melting (SLM)
- 9.1.6. Fused Deposition Modeling (FDM)
- 9.2. Market Analysis, Insights and Forecast - by Component Type
- 9.2.1. Hardware
- 9.2.2. Software
- 9.2.3. Service
- 9.3. Market Analysis, Insights and Forecast - by Material Type
- 9.3.1. Metal
- 9.3.2. Polymer
- 9.3.3. Ceramic
- 9.4. Market Analysis, Insights and Forecast - by Application Type
- 9.4.1. Production
- 9.4.2. Prototyping/R&D
- 9.1. Market Analysis, Insights and Forecast - by Technology Type
- 10. Rest of the World 3D Printing in Automobile Industry Analysis, Insights and Forecast, 2021-2033
- 10.1. Market Analysis, Insights and Forecast - by Technology Type
- 10.1.1. Selective Laser Sintering (SLS)
- 10.1.2. Stereo Lithography (SLA)
- 10.1.3. Digital Light Processing (DLP)
- 10.1.4. Electronic Beam Melting (EBM)
- 10.1.5. Selective Laser Melting (SLM)
- 10.1.6. Fused Deposition Modeling (FDM)
- 10.2. Market Analysis, Insights and Forecast - by Component Type
- 10.2.1. Hardware
- 10.2.2. Software
- 10.2.3. Service
- 10.3. Market Analysis, Insights and Forecast - by Material Type
- 10.3.1. Metal
- 10.3.2. Polymer
- 10.3.3. Ceramic
- 10.4. Market Analysis, Insights and Forecast - by Application Type
- 10.4.1. Production
- 10.4.2. Prototyping/R&D
- 10.1. Market Analysis, Insights and Forecast - by Technology Type
- 11. Competitive Analysis
- 11.1. Company Profiles
- 11.1.1 Arcam AB
- 11.1.1.1. Company Overview
- 11.1.1.2. Products
- 11.1.1.3. Company Financials
- 11.1.1.4. SWOT Analysis
- 11.1.2 Höganäs AB
- 11.1.2.1. Company Overview
- 11.1.2.2. Products
- 11.1.2.3. Company Financials
- 11.1.2.4. SWOT Analysis
- 11.1.3 3D Systems Corporation
- 11.1.3.1. Company Overview
- 11.1.3.2. Products
- 11.1.3.3. Company Financials
- 11.1.3.4. SWOT Analysis
- 11.1.4 The Exone Company
- 11.1.4.1. Company Overview
- 11.1.4.2. Products
- 11.1.4.3. Company Financials
- 11.1.4.4. SWOT Analysis
- 11.1.5 EOS GmbH
- 11.1.5.1. Company Overview
- 11.1.5.2. Products
- 11.1.5.3. Company Financials
- 11.1.5.4. SWOT Analysis
- 11.1.6 Voxeljet AG
- 11.1.6.1. Company Overview
- 11.1.6.2. Products
- 11.1.6.3. Company Financials
- 11.1.6.4. SWOT Analysis
- 11.1.7 Materialise NV
- 11.1.7.1. Company Overview
- 11.1.7.2. Products
- 11.1.7.3. Company Financials
- 11.1.7.4. SWOT Analysis
- 11.1.8 Moog Inc *List Not Exhaustive
- 11.1.8.1. Company Overview
- 11.1.8.2. Products
- 11.1.8.3. Company Financials
- 11.1.8.4. SWOT Analysis
- 11.1.9 Ultimaker BV
- 11.1.9.1. Company Overview
- 11.1.9.2. Products
- 11.1.9.3. Company Financials
- 11.1.9.4. SWOT Analysis
- 11.1.10 Stratasys Ltd
- 11.1.10.1. Company Overview
- 11.1.10.2. Products
- 11.1.10.3. Company Financials
- 11.1.10.4. SWOT Analysis
- 11.1.11 Envisiontec GmbH
- 11.1.11.1. Company Overview
- 11.1.11.2. Products
- 11.1.11.3. Company Financials
- 11.1.11.4. SWOT Analysis
- 11.1.1 Arcam AB
- 11.2. Market Entropy
- 11.2.1 Company's Key Areas Served
- 11.2.2 Recent Developments
- 11.3. Company Market Share Analysis 2025
- 11.3.1 Top 5 Companies Market Share Analysis
- 11.3.2 Top 3 Companies Market Share Analysis
- 11.4. List of Potential Customers
- 12. Research Methodology
List of Figures
- Figure 1: Global 3D Printing in Automobile Industry Revenue Breakdown (billion, %) by Region 2025 & 2033
- Figure 2: North America 3D Printing in Automobile Industry Revenue (billion), by Technology Type 2025 & 2033
- Figure 3: North America 3D Printing in Automobile Industry Revenue Share (%), by Technology Type 2025 & 2033
- Figure 4: North America 3D Printing in Automobile Industry Revenue (billion), by Component Type 2025 & 2033
- Figure 5: North America 3D Printing in Automobile Industry Revenue Share (%), by Component Type 2025 & 2033
- Figure 6: North America 3D Printing in Automobile Industry Revenue (billion), by Material Type 2025 & 2033
- Figure 7: North America 3D Printing in Automobile Industry Revenue Share (%), by Material Type 2025 & 2033
- Figure 8: North America 3D Printing in Automobile Industry Revenue (billion), by Application Type 2025 & 2033
- Figure 9: North America 3D Printing in Automobile Industry Revenue Share (%), by Application Type 2025 & 2033
- Figure 10: North America 3D Printing in Automobile Industry Revenue (billion), by Country 2025 & 2033
- Figure 11: North America 3D Printing in Automobile Industry Revenue Share (%), by Country 2025 & 2033
- Figure 12: Europe 3D Printing in Automobile Industry Revenue (billion), by Technology Type 2025 & 2033
- Figure 13: Europe 3D Printing in Automobile Industry Revenue Share (%), by Technology Type 2025 & 2033
- Figure 14: Europe 3D Printing in Automobile Industry Revenue (billion), by Component Type 2025 & 2033
- Figure 15: Europe 3D Printing in Automobile Industry Revenue Share (%), by Component Type 2025 & 2033
- Figure 16: Europe 3D Printing in Automobile Industry Revenue (billion), by Material Type 2025 & 2033
- Figure 17: Europe 3D Printing in Automobile Industry Revenue Share (%), by Material Type 2025 & 2033
- Figure 18: Europe 3D Printing in Automobile Industry Revenue (billion), by Application Type 2025 & 2033
- Figure 19: Europe 3D Printing in Automobile Industry Revenue Share (%), by Application Type 2025 & 2033
- Figure 20: Europe 3D Printing in Automobile Industry Revenue (billion), by Country 2025 & 2033
- Figure 21: Europe 3D Printing in Automobile Industry Revenue Share (%), by Country 2025 & 2033
- Figure 22: Asia Pacific 3D Printing in Automobile Industry Revenue (billion), by Technology Type 2025 & 2033
- Figure 23: Asia Pacific 3D Printing in Automobile Industry Revenue Share (%), by Technology Type 2025 & 2033
- Figure 24: Asia Pacific 3D Printing in Automobile Industry Revenue (billion), by Component Type 2025 & 2033
- Figure 25: Asia Pacific 3D Printing in Automobile Industry Revenue Share (%), by Component Type 2025 & 2033
- Figure 26: Asia Pacific 3D Printing in Automobile Industry Revenue (billion), by Material Type 2025 & 2033
- Figure 27: Asia Pacific 3D Printing in Automobile Industry Revenue Share (%), by Material Type 2025 & 2033
- Figure 28: Asia Pacific 3D Printing in Automobile Industry Revenue (billion), by Application Type 2025 & 2033
- Figure 29: Asia Pacific 3D Printing in Automobile Industry Revenue Share (%), by Application Type 2025 & 2033
- Figure 30: Asia Pacific 3D Printing in Automobile Industry Revenue (billion), by Country 2025 & 2033
- Figure 31: Asia Pacific 3D Printing in Automobile Industry Revenue Share (%), by Country 2025 & 2033
- Figure 32: Rest of the World 3D Printing in Automobile Industry Revenue (billion), by Technology Type 2025 & 2033
- Figure 33: Rest of the World 3D Printing in Automobile Industry Revenue Share (%), by Technology Type 2025 & 2033
- Figure 34: Rest of the World 3D Printing in Automobile Industry Revenue (billion), by Component Type 2025 & 2033
- Figure 35: Rest of the World 3D Printing in Automobile Industry Revenue Share (%), by Component Type 2025 & 2033
- Figure 36: Rest of the World 3D Printing in Automobile Industry Revenue (billion), by Material Type 2025 & 2033
- Figure 37: Rest of the World 3D Printing in Automobile Industry Revenue Share (%), by Material Type 2025 & 2033
- Figure 38: Rest of the World 3D Printing in Automobile Industry Revenue (billion), by Application Type 2025 & 2033
- Figure 39: Rest of the World 3D Printing in Automobile Industry Revenue Share (%), by Application Type 2025 & 2033
- Figure 40: Rest of the World 3D Printing in Automobile Industry Revenue (billion), by Country 2025 & 2033
- Figure 41: Rest of the World 3D Printing in Automobile Industry Revenue Share (%), by Country 2025 & 2033
List of Tables
- Table 1: Global 3D Printing in Automobile Industry Revenue billion Forecast, by Technology Type 2020 & 2033
- Table 2: Global 3D Printing in Automobile Industry Revenue billion Forecast, by Component Type 2020 & 2033
- Table 3: Global 3D Printing in Automobile Industry Revenue billion Forecast, by Material Type 2020 & 2033
- Table 4: Global 3D Printing in Automobile Industry Revenue billion Forecast, by Application Type 2020 & 2033
- Table 5: Global 3D Printing in Automobile Industry Revenue billion Forecast, by Region 2020 & 2033
- Table 6: Global 3D Printing in Automobile Industry Revenue billion Forecast, by Technology Type 2020 & 2033
- Table 7: Global 3D Printing in Automobile Industry Revenue billion Forecast, by Component Type 2020 & 2033
- Table 8: Global 3D Printing in Automobile Industry Revenue billion Forecast, by Material Type 2020 & 2033
- Table 9: Global 3D Printing in Automobile Industry Revenue billion Forecast, by Application Type 2020 & 2033
- Table 10: Global 3D Printing in Automobile Industry Revenue billion Forecast, by Country 2020 & 2033
- Table 11: United States 3D Printing in Automobile Industry Revenue (billion) Forecast, by Application 2020 & 2033
- Table 12: Canada 3D Printing in Automobile Industry Revenue (billion) Forecast, by Application 2020 & 2033
- Table 13: Rest of North America 3D Printing in Automobile Industry Revenue (billion) Forecast, by Application 2020 & 2033
- Table 14: Global 3D Printing in Automobile Industry Revenue billion Forecast, by Technology Type 2020 & 2033
- Table 15: Global 3D Printing in Automobile Industry Revenue billion Forecast, by Component Type 2020 & 2033
- Table 16: Global 3D Printing in Automobile Industry Revenue billion Forecast, by Material Type 2020 & 2033
- Table 17: Global 3D Printing in Automobile Industry Revenue billion Forecast, by Application Type 2020 & 2033
- Table 18: Global 3D Printing in Automobile Industry Revenue billion Forecast, by Country 2020 & 2033
- Table 19: Germany 3D Printing in Automobile Industry Revenue (billion) Forecast, by Application 2020 & 2033
- Table 20: United Kingdom 3D Printing in Automobile Industry Revenue (billion) Forecast, by Application 2020 & 2033
- Table 21: France 3D Printing in Automobile Industry Revenue (billion) Forecast, by Application 2020 & 2033
- Table 22: Rest of Europe 3D Printing in Automobile Industry Revenue (billion) Forecast, by Application 2020 & 2033
- Table 23: Global 3D Printing in Automobile Industry Revenue billion Forecast, by Technology Type 2020 & 2033
- Table 24: Global 3D Printing in Automobile Industry Revenue billion Forecast, by Component Type 2020 & 2033
- Table 25: Global 3D Printing in Automobile Industry Revenue billion Forecast, by Material Type 2020 & 2033
- Table 26: Global 3D Printing in Automobile Industry Revenue billion Forecast, by Application Type 2020 & 2033
- Table 27: Global 3D Printing in Automobile Industry Revenue billion Forecast, by Country 2020 & 2033
- Table 28: China 3D Printing in Automobile Industry Revenue (billion) Forecast, by Application 2020 & 2033
- Table 29: Japan 3D Printing in Automobile Industry Revenue (billion) Forecast, by Application 2020 & 2033
- Table 30: India 3D Printing in Automobile Industry Revenue (billion) Forecast, by Application 2020 & 2033
- Table 31: Rest of Asia Pacific 3D Printing in Automobile Industry Revenue (billion) Forecast, by Application 2020 & 2033
- Table 32: Global 3D Printing in Automobile Industry Revenue billion Forecast, by Technology Type 2020 & 2033
- Table 33: Global 3D Printing in Automobile Industry Revenue billion Forecast, by Component Type 2020 & 2033
- Table 34: Global 3D Printing in Automobile Industry Revenue billion Forecast, by Material Type 2020 & 2033
- Table 35: Global 3D Printing in Automobile Industry Revenue billion Forecast, by Application Type 2020 & 2033
- Table 36: Global 3D Printing in Automobile Industry Revenue billion Forecast, by Country 2020 & 2033
- Table 37: Brazil 3D Printing in Automobile Industry Revenue (billion) Forecast, by Application 2020 & 2033
- Table 38: Argentina 3D Printing in Automobile Industry Revenue (billion) Forecast, by Application 2020 & 2033
- Table 39: Other Countries 3D Printing in Automobile Industry Revenue (billion) Forecast, by Application 2020 & 2033
Frequently Asked Questions
1. What is the projected Compound Annual Growth Rate (CAGR) of the 3D Printing in Automobile Industry?
The projected CAGR is approximately 14.8%.
2. Which companies are prominent players in the 3D Printing in Automobile Industry?
Key companies in the market include Arcam AB, Höganäs AB, 3D Systems Corporation, The Exone Company, EOS GmbH, Voxeljet AG, Materialise NV, Moog Inc *List Not Exhaustive, Ultimaker BV, Stratasys Ltd, Envisiontec GmbH.
3. What are the main segments of the 3D Printing in Automobile Industry?
The market segments include Technology Type, Component Type, Material Type, Application Type.
4. Can you provide details about the market size?
The market size is estimated to be USD 5.93 billion as of 2022.
5. What are some drivers contributing to market growth?
Increasingly Focused On Lightweighting Vehicles.
6. What are the notable trends driving market growth?
Growing Adoption of Fused Deposition Modeling Technology.
7. Are there any restraints impacting market growth?
High Production Cost.
8. Can you provide examples of recent developments in the market?
November 2022- Desktop Metal, the parent company of ExOne, announced that it had won a USD 9 million order from one of the major German car manufacturers for binder jet additive manufacturing systems used for the mass production of powertrain components.
9. What pricing options are available for accessing the report?
Pricing options include single-user, multi-user, and enterprise licenses priced at USD 4750, USD 5250, and USD 8750 respectively.
10. Is the market size provided in terms of value or volume?
The market size is provided in terms of value, measured in billion.
11. Are there any specific market keywords associated with the report?
Yes, the market keyword associated with the report is "3D Printing in Automobile Industry," which aids in identifying and referencing the specific market segment covered.
12. How do I determine which pricing option suits my needs best?
The pricing options vary based on user requirements and access needs. Individual users may opt for single-user licenses, while businesses requiring broader access may choose multi-user or enterprise licenses for cost-effective access to the report.
13. Are there any additional resources or data provided in the 3D Printing in Automobile Industry report?
While the report offers comprehensive insights, it's advisable to review the specific contents or supplementary materials provided to ascertain if additional resources or data are available.
14. How can I stay updated on further developments or reports in the 3D Printing in Automobile Industry?
To stay informed about further developments, trends, and reports in the 3D Printing in Automobile Industry, consider subscribing to industry newsletters, following relevant companies and organizations, or regularly checking reputable industry news sources and publications.
Methodology
Step 1 - Identification of Relevant Samples Size from Population Database


Step 2 - Approaches for Defining Global Market Size (Value, Volume* & Price*)

Note*: In applicable scenarios
Step 3 - Data Sources
Primary Research
- Web Analytics
- Survey Reports
- Research Institute
- Latest Research Reports
- Opinion Leaders
Secondary Research
- Annual Reports
- White Paper
- Latest Press Release
- Industry Association
- Paid Database
- Investor Presentations

Step 4 - Data Triangulation
Involves using different sources of information in order to increase the validity of a study
These sources are likely to be stakeholders in a program - participants, other researchers, program staff, other community members, and so on.
Then we put all data in single framework & apply various statistical tools to find out the dynamic on the market.
During the analysis stage, feedback from the stakeholder groups would be compared to determine areas of agreement as well as areas of divergence