

Key Insights
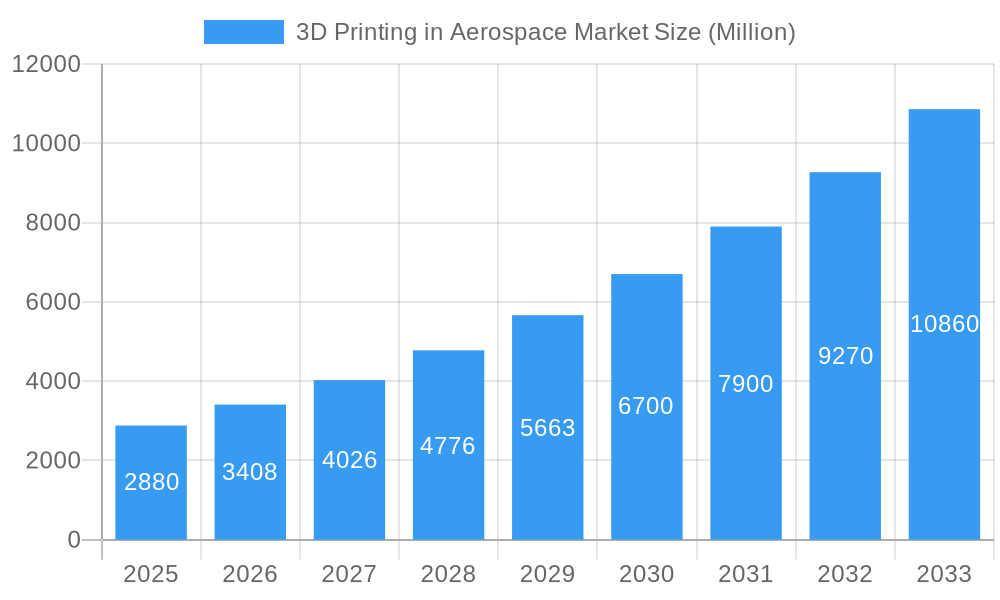
The 3D printing in aerospace market is experiencing robust growth, driven by the increasing demand for lightweight, high-performance components and the need for faster prototyping and production cycles. The market, valued at $2.88 billion in 2025, is projected to expand at a compound annual growth rate (CAGR) of 18.57% from 2025 to 2033. This significant growth is fueled by several key factors. Firstly, the adoption of additive manufacturing (AM) techniques allows for the creation of complex geometries and intricate designs that are impossible or extremely difficult to achieve using traditional manufacturing methods. This is particularly advantageous in aerospace, where lightweighting is crucial for fuel efficiency and performance. Secondly, the rising demand for unmanned aerial vehicles (UAVs) and spacecraft, both of which benefit significantly from the precision and customization capabilities of 3D printing, is a major driver. Finally, the continuous advancements in 3D printing technologies, including the development of new materials and processes, are further accelerating market expansion. The aerospace industry’s inherent need for high quality and safety standards presents a challenge, demanding rigorous material testing and qualification. However, ongoing innovations are overcoming these obstacles, paving the way for wider adoption.
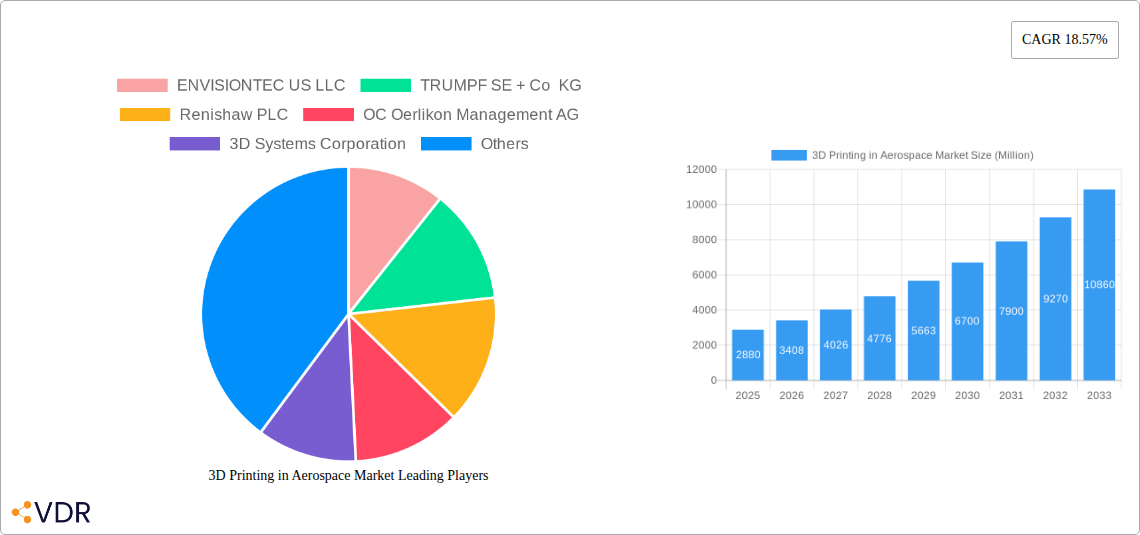
3D Printing in Aerospace Market Market Size (In Billion)
Specific segments within the market show varying growth trajectories. Aircraft components represent a significant portion of the market, with the demand for lighter and stronger parts steadily increasing. The adoption of 3D printing for UAVs is also gaining momentum, driven by the rapidly growing UAV market itself. Alloys remain the dominant material used in 3D printed aerospace components, owing to their strength and durability, but the use of special metals and other advanced materials is expected to increase as technology progresses. Regionally, North America and Europe are currently leading the market, but the Asia-Pacific region is poised for substantial growth, driven by increasing investments in aerospace manufacturing and technological advancements within the region. Key players in the market, including ENVISIONTEC, TRUMPF, Renishaw, and 3D Systems, are actively driving innovation and expanding their product portfolios to capitalize on these opportunities. The competitive landscape is dynamic, characterized by continuous technological advancements and strategic partnerships.
3D Printing in Aerospace Market Company Market Share
3D Printing in Aerospace Market: A Comprehensive Report (2019-2033)
This comprehensive report provides a detailed analysis of the 3D printing in aerospace market, encompassing market dynamics, growth trends, regional segmentation, product landscape, key players, and future outlook. The study period covers 2019-2033, with a base year of 2025 and a forecast period of 2025-2033. The report delves into the parent market of additive manufacturing and the child market of aerospace components, offering valuable insights for industry professionals, investors, and stakeholders. The market size is presented in million units.
3D Printing in Aerospace Market Dynamics & Structure
The 3D printing in aerospace market is characterized by moderate concentration, with key players like 3D Systems Corporation, Stratasys Ltd, and GE Additive (General Electric Company) holding significant market share. However, the emergence of several innovative smaller companies is increasing competition. Technological innovation, particularly in materials science and printing processes, is a major driver. Stringent regulatory frameworks and safety certifications pose challenges, while the increasing demand for lightweight, high-performance components fuels market growth. The market witnesses ongoing M&A activity, with xx deals recorded in the historical period (2019-2024). Substitute technologies, such as traditional machining, remain competitive but face increasing pressure from the cost-effectiveness and design flexibility offered by 3D printing.
- Market Concentration: Moderately concentrated, with top 5 players holding xx% market share in 2024.
- Technological Innovation: Focus on high-temperature materials, improved printing speeds, and process automation.
- Regulatory Frameworks: Stringent safety and certification requirements impacting adoption.
- Competitive Substitutes: Traditional manufacturing processes (machining, casting) offering competition.
- End-User Demographics: Primarily aerospace OEMs, Tier 1 suppliers, and research institutions.
- M&A Trends: xx M&A deals recorded between 2019 and 2024, indicating consolidation and expansion.
3D Printing in Aerospace Market Growth Trends & Insights
The 3D printing in aerospace market experienced significant growth during the historical period (2019-2024), with a CAGR of xx%. This growth is primarily driven by the increasing adoption of additive manufacturing for prototyping, tooling, and the production of end-use parts. Technological disruptions, such as the development of new materials and printing processes, have further accelerated market expansion. The shift towards lightweight designs and customized components has also contributed to increased market penetration. The market size is estimated at xx million units in 2025, projected to reach xx million units by 2033, exhibiting a CAGR of xx% during the forecast period. This growth is fueled by the rising demand for UAVs and the increasing investment in space exploration. Consumer behavior shifts, such as the preference for sustainable manufacturing practices, further support market expansion.
Dominant Regions, Countries, or Segments in 3D Printing in Aerospace Market
North America continues to lead the global 3D printing in aerospace market, underpinned by its mature aerospace ecosystem, substantial investments in research and development, and a pioneering approach to adopting additive manufacturing technologies. Europe follows closely, benefiting from robust governmental initiatives supporting aerospace innovation and the presence of major industry players. In terms of application, aircraft manufacturing commands the largest market share, with unmanned aerial vehicles (UAVs) showing significant growth, followed by spacecraft applications. Among materials, alloys remain dominant due to their superior strength, durability, and performance under extreme conditions.
- Key Drivers (North America): A well-established aerospace industry, substantial R&D expenditure, and the early integration of advanced manufacturing techniques.
- Key Drivers (Europe): Strong governmental backing for aerospace innovation, a high concentration of leading aerospace original equipment manufacturers (OEMs), and a focus on sustainable manufacturing practices.
- Application Segment Dominance: Aircraft manufacturing accounts for approximately 45% of the market share in 2024, followed by UAVs at around 25%, and spacecraft at approximately 18%. Other applications collectively make up the remaining share.
- Material Segment Dominance: Alloys represent about 55% of the market share in 2024, driven by their extensive use in critical aerospace components. Special Metals follow at around 25%, and Other Materials, including advanced polymers and ceramics, constitute the remaining 20%.
3D Printing in Aerospace Market Product Landscape
The 3D printing in aerospace market is characterized by a sophisticated and evolving product landscape, encompassing a wide array of advanced metal and polymer-based printers, specialized materials, and integrated software solutions. Ongoing innovation is intensely focused on elevating printing speed, enhancing precision and resolution, and improving the intrinsic material properties for demanding aerospace applications. Key value propositions that differentiate offerings include unparalleled design freedom for complex geometries, substantial reductions in lead times from design to production, and the capability to create single-piece components, thereby minimizing assembly and potential failure points. Recent breakthroughs include the development of novel, high-performance alloys engineered to withstand extreme temperatures and pressures, and the seamless integration of artificial intelligence (AI) powered tools for real-time process monitoring and optimization, ensuring consistent quality and efficiency.
Key Drivers, Barriers & Challenges in 3D Printing in Aerospace Market
Key Drivers:
- Technological advancements in materials and printing processes.
- Growing demand for lightweight and high-performance components.
- Increasing adoption of additive manufacturing for prototyping and tooling.
- Government initiatives and funding for aerospace research and development.
Key Challenges:
- High initial investment costs for 3D printing equipment and materials.
- Stringent quality control and certification requirements.
- Concerns about the scalability of additive manufacturing for large-scale production.
- Limited availability of skilled labor for operating and maintaining 3D printing systems. This results in an estimated xx% increase in production costs for smaller firms.
Emerging Opportunities in 3D Printing in Aerospace Market
Emerging opportunities include the application of 3D printing in the production of customized aerospace components, the development of bio-inspired designs, and the use of sustainable materials. Untapped markets exist in developing countries with growing aerospace industries. The integration of AI and machine learning in 3D printing processes holds significant potential for improving efficiency and reducing costs.
Growth Accelerators in the 3D Printing in Aerospace Market Industry
Long-term growth will be propelled by continuous technological breakthroughs in materials science, printing technologies, and process automation. Strategic partnerships between aerospace manufacturers and 3D printing companies will further accelerate market expansion. Government support for additive manufacturing research and development, coupled with market expansion into emerging economies, will play a crucial role in driving long-term growth.
Key Players Shaping the 3D Printing in Aerospace Market Market
- ENVISIONTEC US LLC
- TRUMPF SE + Co KG
- Renishaw PLC
- OC Oerlikon Management AG
- 3D Systems Corporation
- Norsk Titanium AS
- Hoganas AB
- EOS GmbH
- Ultimaker BV
- Stratasys Ltd
- MATERIALISE NV
- GE Additive (General Electric Company)
Notable Milestones in 3D Printing in Aerospace Market Sector
- 2020: Introduction of a groundbreaking high-temperature alloy by GE Additive, specifically engineered for critical aerospace engine components, significantly enhancing performance and durability.
- 2021: A strategic partnership between EOS GmbH and Renishaw PLC was established to co-develop a novel, faster, and more precise laser powder bed fusion (LPBF) process tailored for complex aerospace structures.
- 2022: Norsk Titanium AS successfully completed extensive flight testing of a next-generation UAV featuring key structural components produced via their advanced large-scale additive manufacturing process, demonstrating reduced weight and improved aerodynamic efficiency.
- 2023: The acquisition of MATERIALISE NV by Stratasys Ltd was finalized, creating a powerhouse in aerospace additive manufacturing solutions, combining expertise in software, materials, and advanced printing technologies.
- 2024: 3D Systems Corporation launched a new, AI-powered additive manufacturing software suite designed to automate process optimization, quality control, and design validation for aerospace applications, promising unprecedented efficiency and reliability.
In-Depth 3D Printing in Aerospace Market Market Outlook
The trajectory for the 3D printing in aerospace market is exceptionally promising, characterized by sustained and robust growth driven by continuous technological innovation, strategic collaborations, and an escalating demand for lightweight, high-performance, and customized aerospace components. The market is poised for further expansion through ongoing advancements in novel material development, refinement of printing processes for increased scale and complexity, and the enhancement of sophisticated software solutions for design, simulation, and quality assurance. Significant investments in research and development, coupled with targeted market strategies focusing on niche applications such as advanced propulsion systems, interior components, and satellite structures, will unlock substantial new opportunities. The market is forecasted to maintain its strong growth momentum, presenting lucrative prospects for both established industry leaders and emerging innovators.
3D Printing in Aerospace Market Segmentation
- 1. Production Analysis
- 2. Consumption Analysis
- 3. Import Market Analysis (Value & Volume)
- 4. Export Market Analysis (Value & Volume)
- 5. Price Trend Analysis
3D Printing in Aerospace Market Segmentation By Geography
-
1. North America
- 1.1. United States
- 1.2. Canada
- 1.3. Mexico
-
2. South America
- 2.1. Brazil
- 2.2. Argentina
- 2.3. Rest of South America
-
3. Europe
- 3.1. United Kingdom
- 3.2. Germany
- 3.3. France
- 3.4. Italy
- 3.5. Spain
- 3.6. Russia
- 3.7. Benelux
- 3.8. Nordics
- 3.9. Rest of Europe
-
4. Middle East & Africa
- 4.1. Turkey
- 4.2. Israel
- 4.3. GCC
- 4.4. North Africa
- 4.5. South Africa
- 4.6. Rest of Middle East & Africa
-
5. Asia Pacific
- 5.1. China
- 5.2. India
- 5.3. Japan
- 5.4. South Korea
- 5.5. ASEAN
- 5.6. Oceania
- 5.7. Rest of Asia Pacific
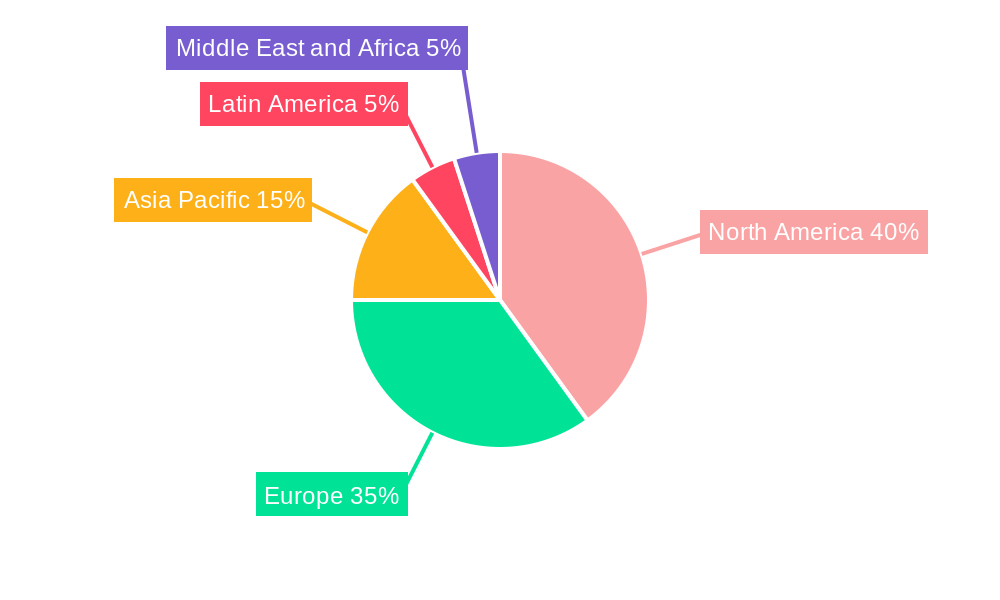
3D Printing in Aerospace Market Regional Market Share
Geographic Coverage of 3D Printing in Aerospace Market
3D Printing in Aerospace Market REPORT HIGHLIGHTS
| Aspects | Details |
|---|---|
| Study Period | 2020-2034 |
| Base Year | 2025 |
| Estimated Year | 2026 |
| Forecast Period | 2026-2034 |
| Historical Period | 2020-2025 |
| Growth Rate | CAGR of 18.57% from 2020-2034 |
| Segmentation |
|
Table of Contents
- 1. Introduction
- 1.1. Research Scope
- 1.2. Market Segmentation
- 1.3. Research Objective
- 1.4. Definitions and Assumptions
- 2. Executive Summary
- 2.1. Market Snapshot
- 3. Market Dynamics
- 3.1. Market Drivers
- 3.2. Market Restrains
- 3.3. Market Trends
- 3.4. Market Opportunities
- 4. Market Factor Analysis
- 4.1. Porters Five Forces
- 4.1.1. Bargaining Power of Suppliers
- 4.1.2. Bargaining Power of Buyers
- 4.1.3. Threat of New Entrants
- 4.1.4. Threat of Substitutes
- 4.1.5. Competitive Rivalry
- 4.2. PESTEL analysis
- 4.3. BCG Analysis
- 4.3.1. Stars (High Growth, High Market Share)
- 4.3.2. Cash Cows (Low Growth, High Market Share)
- 4.3.3. Question Mark (High Growth, Low Market Share)
- 4.3.4. Dogs (Low Growth, Low Market Share)
- 4.4. Ansoff Matrix Analysis
- 4.5. Supply Chain Analysis
- 4.6. Regulatory Landscape
- 4.7. Current Market Potential and Opportunity Assessment (TAM–SAM–SOM Framework)
- 4.8. VDR Analyst Note
- 4.1. Porters Five Forces
- 5. Market Analysis, Insights and Forecast 2021-2033
- 5.1. Market Analysis, Insights and Forecast - by Production Analysis
- 5.2. Market Analysis, Insights and Forecast - by Consumption Analysis
- 5.3. Market Analysis, Insights and Forecast - by Import Market Analysis (Value & Volume)
- 5.4. Market Analysis, Insights and Forecast - by Export Market Analysis (Value & Volume)
- 5.5. Market Analysis, Insights and Forecast - by Price Trend Analysis
- 5.6. Market Analysis, Insights and Forecast - by Region
- 5.6.1. North America
- 5.6.2. South America
- 5.6.3. Europe
- 5.6.4. Middle East & Africa
- 5.6.5. Asia Pacific
- 6. Global 3D Printing in Aerospace Market Analysis, Insights and Forecast, 2021-2033
- 6.1. Market Analysis, Insights and Forecast - by Production Analysis
- 6.2. Market Analysis, Insights and Forecast - by Consumption Analysis
- 6.3. Market Analysis, Insights and Forecast - by Import Market Analysis (Value & Volume)
- 6.4. Market Analysis, Insights and Forecast - by Export Market Analysis (Value & Volume)
- 6.5. Market Analysis, Insights and Forecast - by Price Trend Analysis
- 7. North America 3D Printing in Aerospace Market Analysis, Insights and Forecast, 2021-2033
- 7.1. Market Analysis, Insights and Forecast - by Production Analysis
- 7.2. Market Analysis, Insights and Forecast - by Consumption Analysis
- 7.3. Market Analysis, Insights and Forecast - by Import Market Analysis (Value & Volume)
- 7.4. Market Analysis, Insights and Forecast - by Export Market Analysis (Value & Volume)
- 7.5. Market Analysis, Insights and Forecast - by Price Trend Analysis
- 8. South America 3D Printing in Aerospace Market Analysis, Insights and Forecast, 2021-2033
- 8.1. Market Analysis, Insights and Forecast - by Production Analysis
- 8.2. Market Analysis, Insights and Forecast - by Consumption Analysis
- 8.3. Market Analysis, Insights and Forecast - by Import Market Analysis (Value & Volume)
- 8.4. Market Analysis, Insights and Forecast - by Export Market Analysis (Value & Volume)
- 8.5. Market Analysis, Insights and Forecast - by Price Trend Analysis
- 9. Europe 3D Printing in Aerospace Market Analysis, Insights and Forecast, 2021-2033
- 9.1. Market Analysis, Insights and Forecast - by Production Analysis
- 9.2. Market Analysis, Insights and Forecast - by Consumption Analysis
- 9.3. Market Analysis, Insights and Forecast - by Import Market Analysis (Value & Volume)
- 9.4. Market Analysis, Insights and Forecast - by Export Market Analysis (Value & Volume)
- 9.5. Market Analysis, Insights and Forecast - by Price Trend Analysis
- 10. Middle East & Africa 3D Printing in Aerospace Market Analysis, Insights and Forecast, 2021-2033
- 10.1. Market Analysis, Insights and Forecast - by Production Analysis
- 10.2. Market Analysis, Insights and Forecast - by Consumption Analysis
- 10.3. Market Analysis, Insights and Forecast - by Import Market Analysis (Value & Volume)
- 10.4. Market Analysis, Insights and Forecast - by Export Market Analysis (Value & Volume)
- 10.5. Market Analysis, Insights and Forecast - by Price Trend Analysis
- 11. Asia Pacific 3D Printing in Aerospace Market Analysis, Insights and Forecast, 2021-2033
- 11.1. Market Analysis, Insights and Forecast - by Production Analysis
- 11.2. Market Analysis, Insights and Forecast - by Consumption Analysis
- 11.3. Market Analysis, Insights and Forecast - by Import Market Analysis (Value & Volume)
- 11.4. Market Analysis, Insights and Forecast - by Export Market Analysis (Value & Volume)
- 11.5. Market Analysis, Insights and Forecast - by Price Trend Analysis
- 12. Competitive Analysis
- 12.1. Company Profiles
- 12.1.1 ENVISIONTEC US LLC
- 12.1.1.1. Company Overview
- 12.1.1.2. Products
- 12.1.1.3. Company Financials
- 12.1.1.4. SWOT Analysis
- 12.1.2 TRUMPF SE + Co KG
- 12.1.2.1. Company Overview
- 12.1.2.2. Products
- 12.1.2.3. Company Financials
- 12.1.2.4. SWOT Analysis
- 12.1.3 Renishaw PLC
- 12.1.3.1. Company Overview
- 12.1.3.2. Products
- 12.1.3.3. Company Financials
- 12.1.3.4. SWOT Analysis
- 12.1.4 OC Oerlikon Management AG
- 12.1.4.1. Company Overview
- 12.1.4.2. Products
- 12.1.4.3. Company Financials
- 12.1.4.4. SWOT Analysis
- 12.1.5 3D Systems Corporation
- 12.1.5.1. Company Overview
- 12.1.5.2. Products
- 12.1.5.3. Company Financials
- 12.1.5.4. SWOT Analysis
- 12.1.6 Norsk Titanium AS
- 12.1.6.1. Company Overview
- 12.1.6.2. Products
- 12.1.6.3. Company Financials
- 12.1.6.4. SWOT Analysis
- 12.1.7 Hoganas A
- 12.1.7.1. Company Overview
- 12.1.7.2. Products
- 12.1.7.3. Company Financials
- 12.1.7.4. SWOT Analysis
- 12.1.8 EOS GmbH
- 12.1.8.1. Company Overview
- 12.1.8.2. Products
- 12.1.8.3. Company Financials
- 12.1.8.4. SWOT Analysis
- 12.1.9 Ultimaker BV
- 12.1.9.1. Company Overview
- 12.1.9.2. Products
- 12.1.9.3. Company Financials
- 12.1.9.4. SWOT Analysis
- 12.1.10 Stratasys Ltd
- 12.1.10.1. Company Overview
- 12.1.10.2. Products
- 12.1.10.3. Company Financials
- 12.1.10.4. SWOT Analysis
- 12.1.11 MATERIALSE NV
- 12.1.11.1. Company Overview
- 12.1.11.2. Products
- 12.1.11.3. Company Financials
- 12.1.11.4. SWOT Analysis
- 12.1.12 GE Additive (General Electric Company)
- 12.1.12.1. Company Overview
- 12.1.12.2. Products
- 12.1.12.3. Company Financials
- 12.1.12.4. SWOT Analysis
- 12.1.1 ENVISIONTEC US LLC
- 12.2. Market Entropy
- 12.2.1 Company's Key Areas Served
- 12.2.2 Recent Developments
- 12.3. Company Market Share Analysis 2025
- 12.3.1 Top 5 Companies Market Share Analysis
- 12.3.2 Top 3 Companies Market Share Analysis
- 12.4. List of Potential Customers
- 13. Research Methodology
List of Figures
- Figure 1: Global 3D Printing in Aerospace Market Revenue Breakdown (Million, %) by Region 2025 & 2033
- Figure 2: North America 3D Printing in Aerospace Market Revenue (Million), by Production Analysis 2025 & 2033
- Figure 3: North America 3D Printing in Aerospace Market Revenue Share (%), by Production Analysis 2025 & 2033
- Figure 4: North America 3D Printing in Aerospace Market Revenue (Million), by Consumption Analysis 2025 & 2033
- Figure 5: North America 3D Printing in Aerospace Market Revenue Share (%), by Consumption Analysis 2025 & 2033
- Figure 6: North America 3D Printing in Aerospace Market Revenue (Million), by Import Market Analysis (Value & Volume) 2025 & 2033
- Figure 7: North America 3D Printing in Aerospace Market Revenue Share (%), by Import Market Analysis (Value & Volume) 2025 & 2033
- Figure 8: North America 3D Printing in Aerospace Market Revenue (Million), by Export Market Analysis (Value & Volume) 2025 & 2033
- Figure 9: North America 3D Printing in Aerospace Market Revenue Share (%), by Export Market Analysis (Value & Volume) 2025 & 2033
- Figure 10: North America 3D Printing in Aerospace Market Revenue (Million), by Price Trend Analysis 2025 & 2033
- Figure 11: North America 3D Printing in Aerospace Market Revenue Share (%), by Price Trend Analysis 2025 & 2033
- Figure 12: North America 3D Printing in Aerospace Market Revenue (Million), by Country 2025 & 2033
- Figure 13: North America 3D Printing in Aerospace Market Revenue Share (%), by Country 2025 & 2033
- Figure 14: South America 3D Printing in Aerospace Market Revenue (Million), by Production Analysis 2025 & 2033
- Figure 15: South America 3D Printing in Aerospace Market Revenue Share (%), by Production Analysis 2025 & 2033
- Figure 16: South America 3D Printing in Aerospace Market Revenue (Million), by Consumption Analysis 2025 & 2033
- Figure 17: South America 3D Printing in Aerospace Market Revenue Share (%), by Consumption Analysis 2025 & 2033
- Figure 18: South America 3D Printing in Aerospace Market Revenue (Million), by Import Market Analysis (Value & Volume) 2025 & 2033
- Figure 19: South America 3D Printing in Aerospace Market Revenue Share (%), by Import Market Analysis (Value & Volume) 2025 & 2033
- Figure 20: South America 3D Printing in Aerospace Market Revenue (Million), by Export Market Analysis (Value & Volume) 2025 & 2033
- Figure 21: South America 3D Printing in Aerospace Market Revenue Share (%), by Export Market Analysis (Value & Volume) 2025 & 2033
- Figure 22: South America 3D Printing in Aerospace Market Revenue (Million), by Price Trend Analysis 2025 & 2033
- Figure 23: South America 3D Printing in Aerospace Market Revenue Share (%), by Price Trend Analysis 2025 & 2033
- Figure 24: South America 3D Printing in Aerospace Market Revenue (Million), by Country 2025 & 2033
- Figure 25: South America 3D Printing in Aerospace Market Revenue Share (%), by Country 2025 & 2033
- Figure 26: Europe 3D Printing in Aerospace Market Revenue (Million), by Production Analysis 2025 & 2033
- Figure 27: Europe 3D Printing in Aerospace Market Revenue Share (%), by Production Analysis 2025 & 2033
- Figure 28: Europe 3D Printing in Aerospace Market Revenue (Million), by Consumption Analysis 2025 & 2033
- Figure 29: Europe 3D Printing in Aerospace Market Revenue Share (%), by Consumption Analysis 2025 & 2033
- Figure 30: Europe 3D Printing in Aerospace Market Revenue (Million), by Import Market Analysis (Value & Volume) 2025 & 2033
- Figure 31: Europe 3D Printing in Aerospace Market Revenue Share (%), by Import Market Analysis (Value & Volume) 2025 & 2033
- Figure 32: Europe 3D Printing in Aerospace Market Revenue (Million), by Export Market Analysis (Value & Volume) 2025 & 2033
- Figure 33: Europe 3D Printing in Aerospace Market Revenue Share (%), by Export Market Analysis (Value & Volume) 2025 & 2033
- Figure 34: Europe 3D Printing in Aerospace Market Revenue (Million), by Price Trend Analysis 2025 & 2033
- Figure 35: Europe 3D Printing in Aerospace Market Revenue Share (%), by Price Trend Analysis 2025 & 2033
- Figure 36: Europe 3D Printing in Aerospace Market Revenue (Million), by Country 2025 & 2033
- Figure 37: Europe 3D Printing in Aerospace Market Revenue Share (%), by Country 2025 & 2033
- Figure 38: Middle East & Africa 3D Printing in Aerospace Market Revenue (Million), by Production Analysis 2025 & 2033
- Figure 39: Middle East & Africa 3D Printing in Aerospace Market Revenue Share (%), by Production Analysis 2025 & 2033
- Figure 40: Middle East & Africa 3D Printing in Aerospace Market Revenue (Million), by Consumption Analysis 2025 & 2033
- Figure 41: Middle East & Africa 3D Printing in Aerospace Market Revenue Share (%), by Consumption Analysis 2025 & 2033
- Figure 42: Middle East & Africa 3D Printing in Aerospace Market Revenue (Million), by Import Market Analysis (Value & Volume) 2025 & 2033
- Figure 43: Middle East & Africa 3D Printing in Aerospace Market Revenue Share (%), by Import Market Analysis (Value & Volume) 2025 & 2033
- Figure 44: Middle East & Africa 3D Printing in Aerospace Market Revenue (Million), by Export Market Analysis (Value & Volume) 2025 & 2033
- Figure 45: Middle East & Africa 3D Printing in Aerospace Market Revenue Share (%), by Export Market Analysis (Value & Volume) 2025 & 2033
- Figure 46: Middle East & Africa 3D Printing in Aerospace Market Revenue (Million), by Price Trend Analysis 2025 & 2033
- Figure 47: Middle East & Africa 3D Printing in Aerospace Market Revenue Share (%), by Price Trend Analysis 2025 & 2033
- Figure 48: Middle East & Africa 3D Printing in Aerospace Market Revenue (Million), by Country 2025 & 2033
- Figure 49: Middle East & Africa 3D Printing in Aerospace Market Revenue Share (%), by Country 2025 & 2033
- Figure 50: Asia Pacific 3D Printing in Aerospace Market Revenue (Million), by Production Analysis 2025 & 2033
- Figure 51: Asia Pacific 3D Printing in Aerospace Market Revenue Share (%), by Production Analysis 2025 & 2033
- Figure 52: Asia Pacific 3D Printing in Aerospace Market Revenue (Million), by Consumption Analysis 2025 & 2033
- Figure 53: Asia Pacific 3D Printing in Aerospace Market Revenue Share (%), by Consumption Analysis 2025 & 2033
- Figure 54: Asia Pacific 3D Printing in Aerospace Market Revenue (Million), by Import Market Analysis (Value & Volume) 2025 & 2033
- Figure 55: Asia Pacific 3D Printing in Aerospace Market Revenue Share (%), by Import Market Analysis (Value & Volume) 2025 & 2033
- Figure 56: Asia Pacific 3D Printing in Aerospace Market Revenue (Million), by Export Market Analysis (Value & Volume) 2025 & 2033
- Figure 57: Asia Pacific 3D Printing in Aerospace Market Revenue Share (%), by Export Market Analysis (Value & Volume) 2025 & 2033
- Figure 58: Asia Pacific 3D Printing in Aerospace Market Revenue (Million), by Price Trend Analysis 2025 & 2033
- Figure 59: Asia Pacific 3D Printing in Aerospace Market Revenue Share (%), by Price Trend Analysis 2025 & 2033
- Figure 60: Asia Pacific 3D Printing in Aerospace Market Revenue (Million), by Country 2025 & 2033
- Figure 61: Asia Pacific 3D Printing in Aerospace Market Revenue Share (%), by Country 2025 & 2033
List of Tables
- Table 1: Global 3D Printing in Aerospace Market Revenue Million Forecast, by Production Analysis 2020 & 2033
- Table 2: Global 3D Printing in Aerospace Market Revenue Million Forecast, by Consumption Analysis 2020 & 2033
- Table 3: Global 3D Printing in Aerospace Market Revenue Million Forecast, by Import Market Analysis (Value & Volume) 2020 & 2033
- Table 4: Global 3D Printing in Aerospace Market Revenue Million Forecast, by Export Market Analysis (Value & Volume) 2020 & 2033
- Table 5: Global 3D Printing in Aerospace Market Revenue Million Forecast, by Price Trend Analysis 2020 & 2033
- Table 6: Global 3D Printing in Aerospace Market Revenue Million Forecast, by Region 2020 & 2033
- Table 7: Global 3D Printing in Aerospace Market Revenue Million Forecast, by Production Analysis 2020 & 2033
- Table 8: Global 3D Printing in Aerospace Market Revenue Million Forecast, by Consumption Analysis 2020 & 2033
- Table 9: Global 3D Printing in Aerospace Market Revenue Million Forecast, by Import Market Analysis (Value & Volume) 2020 & 2033
- Table 10: Global 3D Printing in Aerospace Market Revenue Million Forecast, by Export Market Analysis (Value & Volume) 2020 & 2033
- Table 11: Global 3D Printing in Aerospace Market Revenue Million Forecast, by Price Trend Analysis 2020 & 2033
- Table 12: Global 3D Printing in Aerospace Market Revenue Million Forecast, by Country 2020 & 2033
- Table 13: United States 3D Printing in Aerospace Market Revenue (Million) Forecast, by Application 2020 & 2033
- Table 14: Canada 3D Printing in Aerospace Market Revenue (Million) Forecast, by Application 2020 & 2033
- Table 15: Mexico 3D Printing in Aerospace Market Revenue (Million) Forecast, by Application 2020 & 2033
- Table 16: Global 3D Printing in Aerospace Market Revenue Million Forecast, by Production Analysis 2020 & 2033
- Table 17: Global 3D Printing in Aerospace Market Revenue Million Forecast, by Consumption Analysis 2020 & 2033
- Table 18: Global 3D Printing in Aerospace Market Revenue Million Forecast, by Import Market Analysis (Value & Volume) 2020 & 2033
- Table 19: Global 3D Printing in Aerospace Market Revenue Million Forecast, by Export Market Analysis (Value & Volume) 2020 & 2033
- Table 20: Global 3D Printing in Aerospace Market Revenue Million Forecast, by Price Trend Analysis 2020 & 2033
- Table 21: Global 3D Printing in Aerospace Market Revenue Million Forecast, by Country 2020 & 2033
- Table 22: Brazil 3D Printing in Aerospace Market Revenue (Million) Forecast, by Application 2020 & 2033
- Table 23: Argentina 3D Printing in Aerospace Market Revenue (Million) Forecast, by Application 2020 & 2033
- Table 24: Rest of South America 3D Printing in Aerospace Market Revenue (Million) Forecast, by Application 2020 & 2033
- Table 25: Global 3D Printing in Aerospace Market Revenue Million Forecast, by Production Analysis 2020 & 2033
- Table 26: Global 3D Printing in Aerospace Market Revenue Million Forecast, by Consumption Analysis 2020 & 2033
- Table 27: Global 3D Printing in Aerospace Market Revenue Million Forecast, by Import Market Analysis (Value & Volume) 2020 & 2033
- Table 28: Global 3D Printing in Aerospace Market Revenue Million Forecast, by Export Market Analysis (Value & Volume) 2020 & 2033
- Table 29: Global 3D Printing in Aerospace Market Revenue Million Forecast, by Price Trend Analysis 2020 & 2033
- Table 30: Global 3D Printing in Aerospace Market Revenue Million Forecast, by Country 2020 & 2033
- Table 31: United Kingdom 3D Printing in Aerospace Market Revenue (Million) Forecast, by Application 2020 & 2033
- Table 32: Germany 3D Printing in Aerospace Market Revenue (Million) Forecast, by Application 2020 & 2033
- Table 33: France 3D Printing in Aerospace Market Revenue (Million) Forecast, by Application 2020 & 2033
- Table 34: Italy 3D Printing in Aerospace Market Revenue (Million) Forecast, by Application 2020 & 2033
- Table 35: Spain 3D Printing in Aerospace Market Revenue (Million) Forecast, by Application 2020 & 2033
- Table 36: Russia 3D Printing in Aerospace Market Revenue (Million) Forecast, by Application 2020 & 2033
- Table 37: Benelux 3D Printing in Aerospace Market Revenue (Million) Forecast, by Application 2020 & 2033
- Table 38: Nordics 3D Printing in Aerospace Market Revenue (Million) Forecast, by Application 2020 & 2033
- Table 39: Rest of Europe 3D Printing in Aerospace Market Revenue (Million) Forecast, by Application 2020 & 2033
- Table 40: Global 3D Printing in Aerospace Market Revenue Million Forecast, by Production Analysis 2020 & 2033
- Table 41: Global 3D Printing in Aerospace Market Revenue Million Forecast, by Consumption Analysis 2020 & 2033
- Table 42: Global 3D Printing in Aerospace Market Revenue Million Forecast, by Import Market Analysis (Value & Volume) 2020 & 2033
- Table 43: Global 3D Printing in Aerospace Market Revenue Million Forecast, by Export Market Analysis (Value & Volume) 2020 & 2033
- Table 44: Global 3D Printing in Aerospace Market Revenue Million Forecast, by Price Trend Analysis 2020 & 2033
- Table 45: Global 3D Printing in Aerospace Market Revenue Million Forecast, by Country 2020 & 2033
- Table 46: Turkey 3D Printing in Aerospace Market Revenue (Million) Forecast, by Application 2020 & 2033
- Table 47: Israel 3D Printing in Aerospace Market Revenue (Million) Forecast, by Application 2020 & 2033
- Table 48: GCC 3D Printing in Aerospace Market Revenue (Million) Forecast, by Application 2020 & 2033
- Table 49: North Africa 3D Printing in Aerospace Market Revenue (Million) Forecast, by Application 2020 & 2033
- Table 50: South Africa 3D Printing in Aerospace Market Revenue (Million) Forecast, by Application 2020 & 2033
- Table 51: Rest of Middle East & Africa 3D Printing in Aerospace Market Revenue (Million) Forecast, by Application 2020 & 2033
- Table 52: Global 3D Printing in Aerospace Market Revenue Million Forecast, by Production Analysis 2020 & 2033
- Table 53: Global 3D Printing in Aerospace Market Revenue Million Forecast, by Consumption Analysis 2020 & 2033
- Table 54: Global 3D Printing in Aerospace Market Revenue Million Forecast, by Import Market Analysis (Value & Volume) 2020 & 2033
- Table 55: Global 3D Printing in Aerospace Market Revenue Million Forecast, by Export Market Analysis (Value & Volume) 2020 & 2033
- Table 56: Global 3D Printing in Aerospace Market Revenue Million Forecast, by Price Trend Analysis 2020 & 2033
- Table 57: Global 3D Printing in Aerospace Market Revenue Million Forecast, by Country 2020 & 2033
- Table 58: China 3D Printing in Aerospace Market Revenue (Million) Forecast, by Application 2020 & 2033
- Table 59: India 3D Printing in Aerospace Market Revenue (Million) Forecast, by Application 2020 & 2033
- Table 60: Japan 3D Printing in Aerospace Market Revenue (Million) Forecast, by Application 2020 & 2033
- Table 61: South Korea 3D Printing in Aerospace Market Revenue (Million) Forecast, by Application 2020 & 2033
- Table 62: ASEAN 3D Printing in Aerospace Market Revenue (Million) Forecast, by Application 2020 & 2033
- Table 63: Oceania 3D Printing in Aerospace Market Revenue (Million) Forecast, by Application 2020 & 2033
- Table 64: Rest of Asia Pacific 3D Printing in Aerospace Market Revenue (Million) Forecast, by Application 2020 & 2033
Frequently Asked Questions
1. What is the projected Compound Annual Growth Rate (CAGR) of the 3D Printing in Aerospace Market?
The projected CAGR is approximately 18.57%.
2. Which companies are prominent players in the 3D Printing in Aerospace Market?
Key companies in the market include ENVISIONTEC US LLC, TRUMPF SE + Co KG, Renishaw PLC, OC Oerlikon Management AG, 3D Systems Corporation, Norsk Titanium AS, Hoganas A, EOS GmbH, Ultimaker BV, Stratasys Ltd, MATERIALSE NV, GE Additive (General Electric Company).
3. What are the main segments of the 3D Printing in Aerospace Market?
The market segments include Production Analysis, Consumption Analysis, Import Market Analysis (Value & Volume), Export Market Analysis (Value & Volume), Price Trend Analysis.
4. Can you provide details about the market size?
The market size is estimated to be USD 2.88 Million as of 2022.
5. What are some drivers contributing to market growth?
N/A
6. What are the notable trends driving market growth?
The Aircraft Segment is Projected to Witness Highest Growth During the Forecast Period.
7. Are there any restraints impacting market growth?
N/A
8. Can you provide examples of recent developments in the market?
N/A
9. What pricing options are available for accessing the report?
Pricing options include single-user, multi-user, and enterprise licenses priced at USD 4750, USD 5250, and USD 8750 respectively.
10. Is the market size provided in terms of value or volume?
The market size is provided in terms of value, measured in Million.
11. Are there any specific market keywords associated with the report?
Yes, the market keyword associated with the report is "3D Printing in Aerospace Market," which aids in identifying and referencing the specific market segment covered.
12. How do I determine which pricing option suits my needs best?
The pricing options vary based on user requirements and access needs. Individual users may opt for single-user licenses, while businesses requiring broader access may choose multi-user or enterprise licenses for cost-effective access to the report.
13. Are there any additional resources or data provided in the 3D Printing in Aerospace Market report?
While the report offers comprehensive insights, it's advisable to review the specific contents or supplementary materials provided to ascertain if additional resources or data are available.
14. How can I stay updated on further developments or reports in the 3D Printing in Aerospace Market?
To stay informed about further developments, trends, and reports in the 3D Printing in Aerospace Market, consider subscribing to industry newsletters, following relevant companies and organizations, or regularly checking reputable industry news sources and publications.
Methodology
Step 1 - Identification of Relevant Samples Size from Population Database


Step 2 - Approaches for Defining Global Market Size (Value, Volume* & Price*)

Note*: In applicable scenarios
Step 3 - Data Sources
Primary Research
- Web Analytics
- Survey Reports
- Research Institute
- Latest Research Reports
- Opinion Leaders
Secondary Research
- Annual Reports
- White Paper
- Latest Press Release
- Industry Association
- Paid Database
- Investor Presentations

Step 4 - Data Triangulation
Involves using different sources of information in order to increase the validity of a study
These sources are likely to be stakeholders in a program - participants, other researchers, program staff, other community members, and so on.
Then we put all data in single framework & apply various statistical tools to find out the dynamic on the market.
During the analysis stage, feedback from the stakeholder groups would be compared to determine areas of agreement as well as areas of divergence