

Key Insights
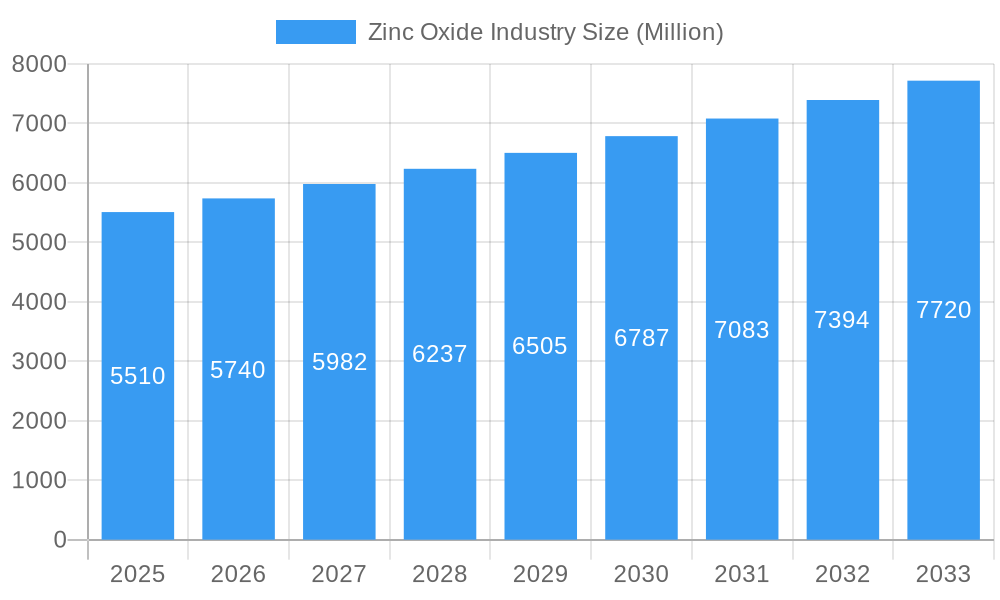
The global Zinc Oxide market, valued at $5.51 billion in 2025, is poised for significant expansion. Projected to grow at a Compound Annual Growth Rate (CAGR) of 3.81% from 2025 to 2033, this market's growth is propelled by increasing demand across key sectors. The rubber and tire industry, a primary consumer for its reinforcing and vulcanization properties, is a major contributor. The ceramics and glass sectors leverage zinc oxide for opacity and UV protection, driving further demand. Growth in pharmaceuticals and cosmetics, utilizing zinc oxide for its sunscreen and wound healing benefits, also plays a crucial role. The paints and coatings industry, benefiting from zinc oxide’s anti-corrosive and pigment characteristics, represents another significant driver. While the French and American processes are dominant production methods, the wet process is gaining traction for its environmental advantages and cost-efficiency. The Asia Pacific region, led by China and India, is expected to dominate due to rapid industrialization and manufacturing growth. North America and Europe will also experience substantial growth, supported by mature industrial bases and advancements in material technology. Potential market restraints include fluctuating zinc prices, environmental regulations, and the availability of substitutes. However, ongoing innovation in production technologies and a focus on sustainability are expected to mitigate these challenges.
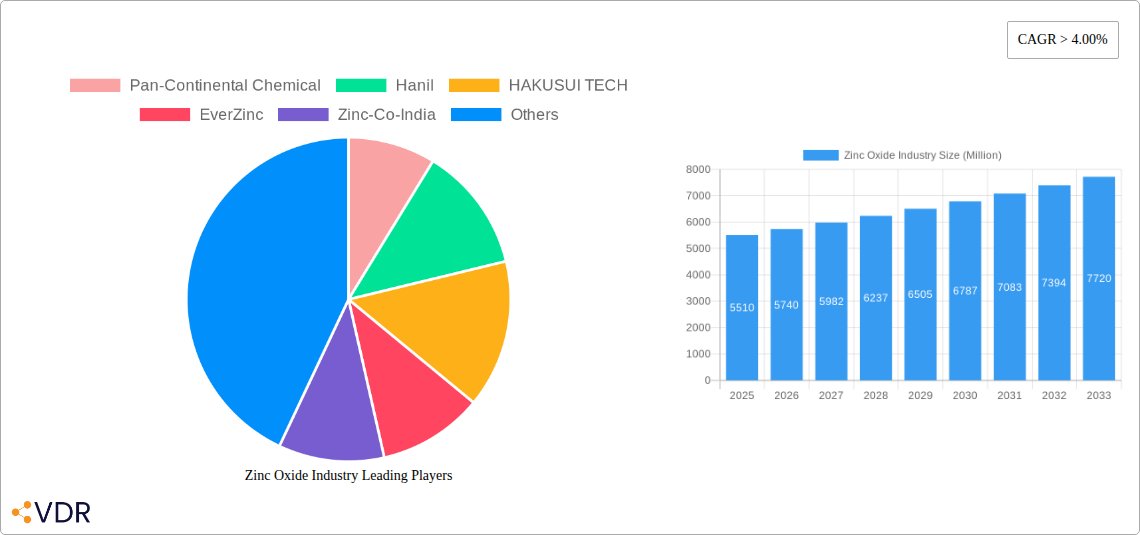
Zinc Oxide Industry Market Size (In Million)
The competitive landscape features a blend of global corporations and regional manufacturers. Key industry players are actively pursuing research and development, capacity enhancements, and strategic collaborations to strengthen their market presence. There is a discernible shift towards eco-friendly production methods and the development of high-purity zinc oxide products to address evolving application requirements. The long-term outlook for the Zinc Oxide market remains robust, with sustained demand across all major application segments and geographic regions, fueled by industrial needs and continuous technological innovation.
Zinc Oxide Industry Company Market Share
Zinc Oxide Industry Market Report: 2019-2033
This comprehensive report provides a detailed analysis of the global zinc oxide industry, encompassing market dynamics, growth trends, regional insights, competitive landscape, and future outlook. Covering the historical period (2019-2024), base year (2025), and forecast period (2025-2033), this report is an indispensable resource for industry professionals, investors, and strategic decision-makers. The report meticulously examines the parent market (industrial chemicals) and dives deep into the child market (zinc oxide). The projected market size reaches xx Million by 2033.
Zinc Oxide Industry Market Dynamics & Structure
The zinc oxide market is characterized by moderate concentration, with several key players commanding significant market share. Technological innovation, particularly in production processes (Direct Process, Indirect Process, Wet Process) and application-specific formulations, plays a crucial role in shaping market competition. Stringent environmental regulations influence production methods and drive the adoption of sustainable practices. Competitive pressures from substitute materials like titanium dioxide necessitate continuous product improvement and cost optimization. End-user demographics, primarily driven by the construction, rubber, and pharmaceutical sectors, dictate market demand fluctuations. M&A activity, as evidenced by the recent merger of U.S. Zinc and EverZinc, signifies industry consolidation and a quest for scale and diversification.
- Market Concentration: Moderately concentrated, with top 10 players holding approximately xx% market share (2024).
- Technological Innovation: Focus on improving process efficiency, reducing energy consumption, and enhancing product quality.
- Regulatory Framework: Stringent environmental regulations influence production methods and waste management practices.
- Competitive Substitutes: Titanium dioxide and other metal oxides pose competitive threats.
- End-User Demographics: Significant demand from rubber & tires, paints & coatings, and pharmaceuticals industries.
- M&A Trends: Consolidation is driven by achieving economies of scale and expanding geographical reach. Recent deal volume estimates at xx Million in 2024.
Zinc Oxide Industry Growth Trends & Insights
The global zinc oxide market has witnessed consistent growth over the past few years, driven by increasing demand across diverse sectors. The market size reached xx Million in 2024 and is projected to expand at a CAGR of xx% during the forecast period (2025-2033). This growth is fueled by factors such as rising construction activity, expanding automotive production, and escalating demand for zinc oxide in sunscreens and other personal care products. Technological advancements in production techniques, leading to cost reductions and improved product quality, have further boosted market expansion. Shifts in consumer behavior toward sustainable and eco-friendly products are influencing the demand for zinc oxide produced using more environmentally benign methods. The market penetration rate is currently at xx% and is expected to increase to xx% by 2033.
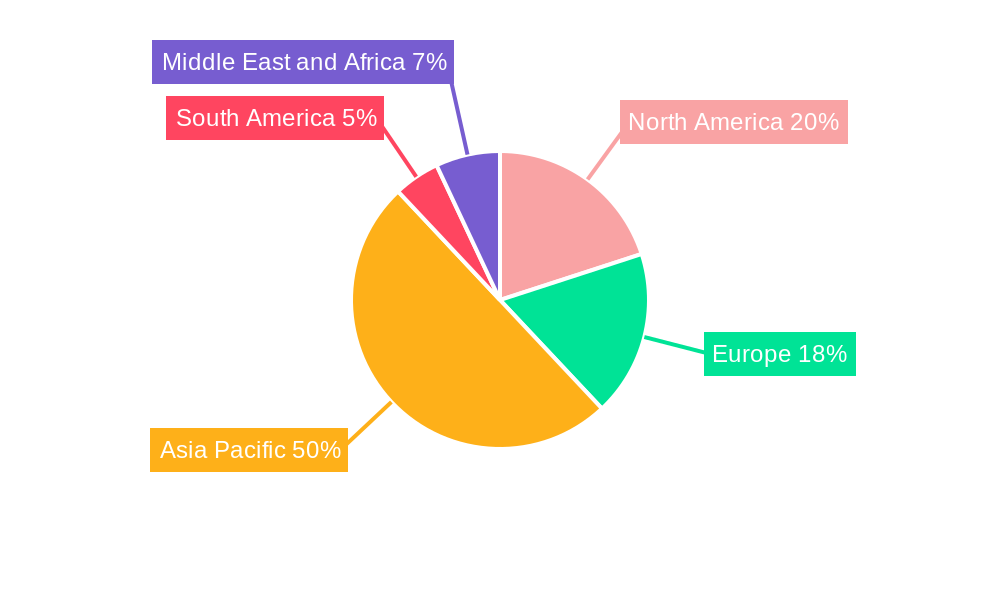
Dominant Regions, Countries, or Segments in Zinc Oxide Industry
The Asia-Pacific region dominates the global zinc oxide market, driven by robust economic growth, burgeoning construction activities, and a vast manufacturing base. China, India, and other Southeast Asian countries are key contributors to this regional dominance. Within the application segments, rubber and tires, paints and coatings, and pharmaceuticals and cosmetics constitute significant portions of the market. The indirect process (French process) remains the dominant production method, although the wet process is gaining traction due to its environmental advantages.
- Key Regional Drivers: Rapid industrialization and urbanization in Asia-Pacific, robust infrastructure development in North America and Europe.
- Leading Countries: China, India, the United States, and Germany hold significant market shares.
- Dominant Segments: Rubber and Tires, Paints and Coatings, and Pharmaceuticals & Cosmetics contribute the highest revenue.
- Production Methods: Indirect process (French Process) holds the largest market share, followed by the Direct process (American Process) and Wet process.
Zinc Oxide Industry Product Landscape
Zinc oxide products are categorized based on particle size, purity, and surface treatment. Innovations focus on developing high-purity grades for specialized applications and nanoparticles for enhanced performance. The unique selling propositions include superior UV blocking capabilities, excellent pigment properties, and antimicrobial characteristics. Technological advancements are centered on enhancing the production process efficiency and reducing the environmental impact of zinc oxide manufacturing.
Key Drivers, Barriers & Challenges in Zinc Oxide Industry
Key Drivers: Rising demand from key end-use industries (construction, rubber, pharmaceuticals), technological advancements improving production efficiency and product quality, supportive government policies in certain regions promoting the use of zinc oxide in sustainable applications.
Challenges: Fluctuations in zinc prices impact production costs, stringent environmental regulations pose challenges to producers, intense competition from substitutes and alternative materials can constrain market growth, and supply chain disruptions can create instability in the market. The impact of these challenges is estimated to reduce market growth by approximately xx% during the forecast period.
Emerging Opportunities in Zinc Oxide Industry
Emerging trends and opportunities in the zinc oxide market include growing demand for high-purity grades in electronics and solar energy applications, the expansion into new markets (e.g., food packaging, agriculture), and increasing preference for environmentally friendly production methods.
Growth Accelerators in the Zinc Oxide Industry
Technological advancements such as nanotechnology and improved process efficiency will continue to drive market growth. Strategic partnerships and collaborations to expand into new geographical markets or applications will also contribute significantly.
Key Players Shaping the Zinc Oxide Industry Market
- Pan-Continental Chemical
- Hanil
- HAKUSUI TECH
- EverZinc
- Zinc-Co-India
- Rubamin
- Weifang Longda Zinc Industry Co Ltd
- Suraj Udyog
- Hindustan Zinc Limited
- Zochem Inc
- Zinc Nacional SA
- Silox SA
- Akrochem Corporation
- ZM SILESIA SA
Notable Milestones in Zinc Oxide Industry Sector
- June 2022: Aterian Investment Partners merged U.S. Zinc and EverZinc, creating the world's leading zinc chemistry company. This significantly altered the competitive landscape.
- February 2022: Zochem expanded its zinc oxide production capacity by 15,000 metric tons, increasing market supply.
In-Depth Zinc Oxide Industry Market Outlook
The zinc oxide market is poised for continued growth driven by technological advancements, expanding applications, and increasing demand from key industries. Strategic investments in R&D, sustainable production methods, and expansion into emerging markets will shape future market dynamics. The market presents significant opportunities for both established players and new entrants.
Zinc Oxide Industry Segmentation
-
1. Process
- 1.1. Indirect Process (French Process)
- 1.2. Direct Process (American Process)
- 1.3. Wet Process
-
2. Application
- 2.1. Rubber and Tires
- 2.2. Ceramics and Glass
- 2.3. Pharmaceuticals and Cosmetics
- 2.4. Agriculture
- 2.5. Paints and Coatings
- 2.6. Other Applications (Chemicals and Food)
Zinc Oxide Industry Segmentation By Geography
-
1. Asia Pacific
- 1.1. China
- 1.2. India
- 1.3. Japan
- 1.4. South Korea
- 1.5. Rest of Asia Pacific
-
2. North America
- 2.1. United States
- 2.2. Canada
- 2.3. Mexico
-
3. Europe
- 3.1. Germany
- 3.2. United Kingdom
- 3.3. France
- 3.4. Italy
- 3.5. Rest of Europe
-
4. South America
- 4.1. Brazil
- 4.2. Argentina
- 4.3. Rest of South America
-
5. Middle East and Africa
- 5.1. Saudi Arabia
- 5.2. South Africa
- 5.3. Rest of Middle East and Africa
Zinc Oxide Industry Regional Market Share
Geographic Coverage of Zinc Oxide Industry
Zinc Oxide Industry REPORT HIGHLIGHTS
| Aspects | Details |
|---|---|
| Study Period | 2020-2034 |
| Base Year | 2025 |
| Estimated Year | 2026 |
| Forecast Period | 2026-2034 |
| Historical Period | 2020-2025 |
| Growth Rate | CAGR of 3.81% from 2020-2034 |
| Segmentation |
|
Table of Contents
- 1. Introduction
- 1.1. Research Scope
- 1.2. Market Segmentation
- 1.3. Research Objective
- 1.4. Definitions and Assumptions
- 2. Executive Summary
- 2.1. Market Snapshot
- 3. Market Dynamics
- 3.1. Market Drivers
- 3.2. Market Restrains
- 3.3. Market Trends
- 3.4. Market Opportunities
- 4. Market Factor Analysis
- 4.1. Porters Five Forces
- 4.1.1. Bargaining Power of Suppliers
- 4.1.2. Bargaining Power of Buyers
- 4.1.3. Threat of New Entrants
- 4.1.4. Threat of Substitutes
- 4.1.5. Competitive Rivalry
- 4.2. PESTEL analysis
- 4.3. BCG Analysis
- 4.3.1. Stars (High Growth, High Market Share)
- 4.3.2. Cash Cows (Low Growth, High Market Share)
- 4.3.3. Question Mark (High Growth, Low Market Share)
- 4.3.4. Dogs (Low Growth, Low Market Share)
- 4.4. Ansoff Matrix Analysis
- 4.5. Supply Chain Analysis
- 4.6. Regulatory Landscape
- 4.7. Current Market Potential and Opportunity Assessment (TAM–SAM–SOM Framework)
- 4.8. VDR Analyst Note
- 4.1. Porters Five Forces
- 5. Market Analysis, Insights and Forecast 2021-2033
- 5.1. Market Analysis, Insights and Forecast - by Process
- 5.1.1. Indirect Process (French Process)
- 5.1.2. Direct Process (American Process)
- 5.1.3. Wet Process
- 5.2. Market Analysis, Insights and Forecast - by Application
- 5.2.1. Rubber and Tires
- 5.2.2. Ceramics and Glass
- 5.2.3. Pharmaceuticals and Cosmetics
- 5.2.4. Agriculture
- 5.2.5. Paints and Coatings
- 5.2.6. Other Applications (Chemicals and Food)
- 5.3. Market Analysis, Insights and Forecast - by Region
- 5.3.1. Asia Pacific
- 5.3.2. North America
- 5.3.3. Europe
- 5.3.4. South America
- 5.3.5. Middle East and Africa
- 5.1. Market Analysis, Insights and Forecast - by Process
- 6. Global Zinc Oxide Industry Analysis, Insights and Forecast, 2021-2033
- 6.1. Market Analysis, Insights and Forecast - by Process
- 6.1.1. Indirect Process (French Process)
- 6.1.2. Direct Process (American Process)
- 6.1.3. Wet Process
- 6.2. Market Analysis, Insights and Forecast - by Application
- 6.2.1. Rubber and Tires
- 6.2.2. Ceramics and Glass
- 6.2.3. Pharmaceuticals and Cosmetics
- 6.2.4. Agriculture
- 6.2.5. Paints and Coatings
- 6.2.6. Other Applications (Chemicals and Food)
- 6.1. Market Analysis, Insights and Forecast - by Process
- 7. Asia Pacific Zinc Oxide Industry Analysis, Insights and Forecast, 2021-2033
- 7.1. Market Analysis, Insights and Forecast - by Process
- 7.1.1. Indirect Process (French Process)
- 7.1.2. Direct Process (American Process)
- 7.1.3. Wet Process
- 7.2. Market Analysis, Insights and Forecast - by Application
- 7.2.1. Rubber and Tires
- 7.2.2. Ceramics and Glass
- 7.2.3. Pharmaceuticals and Cosmetics
- 7.2.4. Agriculture
- 7.2.5. Paints and Coatings
- 7.2.6. Other Applications (Chemicals and Food)
- 7.1. Market Analysis, Insights and Forecast - by Process
- 8. North America Zinc Oxide Industry Analysis, Insights and Forecast, 2021-2033
- 8.1. Market Analysis, Insights and Forecast - by Process
- 8.1.1. Indirect Process (French Process)
- 8.1.2. Direct Process (American Process)
- 8.1.3. Wet Process
- 8.2. Market Analysis, Insights and Forecast - by Application
- 8.2.1. Rubber and Tires
- 8.2.2. Ceramics and Glass
- 8.2.3. Pharmaceuticals and Cosmetics
- 8.2.4. Agriculture
- 8.2.5. Paints and Coatings
- 8.2.6. Other Applications (Chemicals and Food)
- 8.1. Market Analysis, Insights and Forecast - by Process
- 9. Europe Zinc Oxide Industry Analysis, Insights and Forecast, 2021-2033
- 9.1. Market Analysis, Insights and Forecast - by Process
- 9.1.1. Indirect Process (French Process)
- 9.1.2. Direct Process (American Process)
- 9.1.3. Wet Process
- 9.2. Market Analysis, Insights and Forecast - by Application
- 9.2.1. Rubber and Tires
- 9.2.2. Ceramics and Glass
- 9.2.3. Pharmaceuticals and Cosmetics
- 9.2.4. Agriculture
- 9.2.5. Paints and Coatings
- 9.2.6. Other Applications (Chemicals and Food)
- 9.1. Market Analysis, Insights and Forecast - by Process
- 10. South America Zinc Oxide Industry Analysis, Insights and Forecast, 2021-2033
- 10.1. Market Analysis, Insights and Forecast - by Process
- 10.1.1. Indirect Process (French Process)
- 10.1.2. Direct Process (American Process)
- 10.1.3. Wet Process
- 10.2. Market Analysis, Insights and Forecast - by Application
- 10.2.1. Rubber and Tires
- 10.2.2. Ceramics and Glass
- 10.2.3. Pharmaceuticals and Cosmetics
- 10.2.4. Agriculture
- 10.2.5. Paints and Coatings
- 10.2.6. Other Applications (Chemicals and Food)
- 10.1. Market Analysis, Insights and Forecast - by Process
- 11. Middle East and Africa Zinc Oxide Industry Analysis, Insights and Forecast, 2021-2033
- 11.1. Market Analysis, Insights and Forecast - by Process
- 11.1.1. Indirect Process (French Process)
- 11.1.2. Direct Process (American Process)
- 11.1.3. Wet Process
- 11.2. Market Analysis, Insights and Forecast - by Application
- 11.2.1. Rubber and Tires
- 11.2.2. Ceramics and Glass
- 11.2.3. Pharmaceuticals and Cosmetics
- 11.2.4. Agriculture
- 11.2.5. Paints and Coatings
- 11.2.6. Other Applications (Chemicals and Food)
- 11.1. Market Analysis, Insights and Forecast - by Process
- 12. Competitive Analysis
- 12.1. Company Profiles
- 12.1.1 Pan-Continental Chemical
- 12.1.1.1. Company Overview
- 12.1.1.2. Products
- 12.1.1.3. Company Financials
- 12.1.1.4. SWOT Analysis
- 12.1.2 Hanil
- 12.1.2.1. Company Overview
- 12.1.2.2. Products
- 12.1.2.3. Company Financials
- 12.1.2.4. SWOT Analysis
- 12.1.3 HAKUSUI TECH
- 12.1.3.1. Company Overview
- 12.1.3.2. Products
- 12.1.3.3. Company Financials
- 12.1.3.4. SWOT Analysis
- 12.1.4 EverZinc
- 12.1.4.1. Company Overview
- 12.1.4.2. Products
- 12.1.4.3. Company Financials
- 12.1.4.4. SWOT Analysis
- 12.1.5 Zinc-Co-India
- 12.1.5.1. Company Overview
- 12.1.5.2. Products
- 12.1.5.3. Company Financials
- 12.1.5.4. SWOT Analysis
- 12.1.6 Rubamin
- 12.1.6.1. Company Overview
- 12.1.6.2. Products
- 12.1.6.3. Company Financials
- 12.1.6.4. SWOT Analysis
- 12.1.7 Weifang Longda Zinc Industry Co Ltd
- 12.1.7.1. Company Overview
- 12.1.7.2. Products
- 12.1.7.3. Company Financials
- 12.1.7.4. SWOT Analysis
- 12.1.8 Suraj Udyog
- 12.1.8.1. Company Overview
- 12.1.8.2. Products
- 12.1.8.3. Company Financials
- 12.1.8.4. SWOT Analysis
- 12.1.9 Hindustan Zinc Limited
- 12.1.9.1. Company Overview
- 12.1.9.2. Products
- 12.1.9.3. Company Financials
- 12.1.9.4. SWOT Analysis
- 12.1.10 Zochem Inc *List Not Exhaustive
- 12.1.10.1. Company Overview
- 12.1.10.2. Products
- 12.1.10.3. Company Financials
- 12.1.10.4. SWOT Analysis
- 12.1.11 Zinc Nacional SA
- 12.1.11.1. Company Overview
- 12.1.11.2. Products
- 12.1.11.3. Company Financials
- 12.1.11.4. SWOT Analysis
- 12.1.12 Silox SA
- 12.1.12.1. Company Overview
- 12.1.12.2. Products
- 12.1.12.3. Company Financials
- 12.1.12.4. SWOT Analysis
- 12.1.13 Akrochem Corporation
- 12.1.13.1. Company Overview
- 12.1.13.2. Products
- 12.1.13.3. Company Financials
- 12.1.13.4. SWOT Analysis
- 12.1.14 ZM SILESIA SA
- 12.1.14.1. Company Overview
- 12.1.14.2. Products
- 12.1.14.3. Company Financials
- 12.1.14.4. SWOT Analysis
- 12.1.1 Pan-Continental Chemical
- 12.2. Market Entropy
- 12.2.1 Company's Key Areas Served
- 12.2.2 Recent Developments
- 12.3. Company Market Share Analysis 2025
- 12.3.1 Top 5 Companies Market Share Analysis
- 12.3.2 Top 3 Companies Market Share Analysis
- 12.4. List of Potential Customers
- 13. Research Methodology
List of Figures
- Figure 1: Global Zinc Oxide Industry Revenue Breakdown (million, %) by Region 2025 & 2033
- Figure 2: Global Zinc Oxide Industry Volume Breakdown (K Tons, %) by Region 2025 & 2033
- Figure 3: Asia Pacific Zinc Oxide Industry Revenue (million), by Process 2025 & 2033
- Figure 4: Asia Pacific Zinc Oxide Industry Volume (K Tons), by Process 2025 & 2033
- Figure 5: Asia Pacific Zinc Oxide Industry Revenue Share (%), by Process 2025 & 2033
- Figure 6: Asia Pacific Zinc Oxide Industry Volume Share (%), by Process 2025 & 2033
- Figure 7: Asia Pacific Zinc Oxide Industry Revenue (million), by Application 2025 & 2033
- Figure 8: Asia Pacific Zinc Oxide Industry Volume (K Tons), by Application 2025 & 2033
- Figure 9: Asia Pacific Zinc Oxide Industry Revenue Share (%), by Application 2025 & 2033
- Figure 10: Asia Pacific Zinc Oxide Industry Volume Share (%), by Application 2025 & 2033
- Figure 11: Asia Pacific Zinc Oxide Industry Revenue (million), by Country 2025 & 2033
- Figure 12: Asia Pacific Zinc Oxide Industry Volume (K Tons), by Country 2025 & 2033
- Figure 13: Asia Pacific Zinc Oxide Industry Revenue Share (%), by Country 2025 & 2033
- Figure 14: Asia Pacific Zinc Oxide Industry Volume Share (%), by Country 2025 & 2033
- Figure 15: North America Zinc Oxide Industry Revenue (million), by Process 2025 & 2033
- Figure 16: North America Zinc Oxide Industry Volume (K Tons), by Process 2025 & 2033
- Figure 17: North America Zinc Oxide Industry Revenue Share (%), by Process 2025 & 2033
- Figure 18: North America Zinc Oxide Industry Volume Share (%), by Process 2025 & 2033
- Figure 19: North America Zinc Oxide Industry Revenue (million), by Application 2025 & 2033
- Figure 20: North America Zinc Oxide Industry Volume (K Tons), by Application 2025 & 2033
- Figure 21: North America Zinc Oxide Industry Revenue Share (%), by Application 2025 & 2033
- Figure 22: North America Zinc Oxide Industry Volume Share (%), by Application 2025 & 2033
- Figure 23: North America Zinc Oxide Industry Revenue (million), by Country 2025 & 2033
- Figure 24: North America Zinc Oxide Industry Volume (K Tons), by Country 2025 & 2033
- Figure 25: North America Zinc Oxide Industry Revenue Share (%), by Country 2025 & 2033
- Figure 26: North America Zinc Oxide Industry Volume Share (%), by Country 2025 & 2033
- Figure 27: Europe Zinc Oxide Industry Revenue (million), by Process 2025 & 2033
- Figure 28: Europe Zinc Oxide Industry Volume (K Tons), by Process 2025 & 2033
- Figure 29: Europe Zinc Oxide Industry Revenue Share (%), by Process 2025 & 2033
- Figure 30: Europe Zinc Oxide Industry Volume Share (%), by Process 2025 & 2033
- Figure 31: Europe Zinc Oxide Industry Revenue (million), by Application 2025 & 2033
- Figure 32: Europe Zinc Oxide Industry Volume (K Tons), by Application 2025 & 2033
- Figure 33: Europe Zinc Oxide Industry Revenue Share (%), by Application 2025 & 2033
- Figure 34: Europe Zinc Oxide Industry Volume Share (%), by Application 2025 & 2033
- Figure 35: Europe Zinc Oxide Industry Revenue (million), by Country 2025 & 2033
- Figure 36: Europe Zinc Oxide Industry Volume (K Tons), by Country 2025 & 2033
- Figure 37: Europe Zinc Oxide Industry Revenue Share (%), by Country 2025 & 2033
- Figure 38: Europe Zinc Oxide Industry Volume Share (%), by Country 2025 & 2033
- Figure 39: South America Zinc Oxide Industry Revenue (million), by Process 2025 & 2033
- Figure 40: South America Zinc Oxide Industry Volume (K Tons), by Process 2025 & 2033
- Figure 41: South America Zinc Oxide Industry Revenue Share (%), by Process 2025 & 2033
- Figure 42: South America Zinc Oxide Industry Volume Share (%), by Process 2025 & 2033
- Figure 43: South America Zinc Oxide Industry Revenue (million), by Application 2025 & 2033
- Figure 44: South America Zinc Oxide Industry Volume (K Tons), by Application 2025 & 2033
- Figure 45: South America Zinc Oxide Industry Revenue Share (%), by Application 2025 & 2033
- Figure 46: South America Zinc Oxide Industry Volume Share (%), by Application 2025 & 2033
- Figure 47: South America Zinc Oxide Industry Revenue (million), by Country 2025 & 2033
- Figure 48: South America Zinc Oxide Industry Volume (K Tons), by Country 2025 & 2033
- Figure 49: South America Zinc Oxide Industry Revenue Share (%), by Country 2025 & 2033
- Figure 50: South America Zinc Oxide Industry Volume Share (%), by Country 2025 & 2033
- Figure 51: Middle East and Africa Zinc Oxide Industry Revenue (million), by Process 2025 & 2033
- Figure 52: Middle East and Africa Zinc Oxide Industry Volume (K Tons), by Process 2025 & 2033
- Figure 53: Middle East and Africa Zinc Oxide Industry Revenue Share (%), by Process 2025 & 2033
- Figure 54: Middle East and Africa Zinc Oxide Industry Volume Share (%), by Process 2025 & 2033
- Figure 55: Middle East and Africa Zinc Oxide Industry Revenue (million), by Application 2025 & 2033
- Figure 56: Middle East and Africa Zinc Oxide Industry Volume (K Tons), by Application 2025 & 2033
- Figure 57: Middle East and Africa Zinc Oxide Industry Revenue Share (%), by Application 2025 & 2033
- Figure 58: Middle East and Africa Zinc Oxide Industry Volume Share (%), by Application 2025 & 2033
- Figure 59: Middle East and Africa Zinc Oxide Industry Revenue (million), by Country 2025 & 2033
- Figure 60: Middle East and Africa Zinc Oxide Industry Volume (K Tons), by Country 2025 & 2033
- Figure 61: Middle East and Africa Zinc Oxide Industry Revenue Share (%), by Country 2025 & 2033
- Figure 62: Middle East and Africa Zinc Oxide Industry Volume Share (%), by Country 2025 & 2033
List of Tables
- Table 1: Global Zinc Oxide Industry Revenue million Forecast, by Process 2020 & 2033
- Table 2: Global Zinc Oxide Industry Volume K Tons Forecast, by Process 2020 & 2033
- Table 3: Global Zinc Oxide Industry Revenue million Forecast, by Application 2020 & 2033
- Table 4: Global Zinc Oxide Industry Volume K Tons Forecast, by Application 2020 & 2033
- Table 5: Global Zinc Oxide Industry Revenue million Forecast, by Region 2020 & 2033
- Table 6: Global Zinc Oxide Industry Volume K Tons Forecast, by Region 2020 & 2033
- Table 7: Global Zinc Oxide Industry Revenue million Forecast, by Process 2020 & 2033
- Table 8: Global Zinc Oxide Industry Volume K Tons Forecast, by Process 2020 & 2033
- Table 9: Global Zinc Oxide Industry Revenue million Forecast, by Application 2020 & 2033
- Table 10: Global Zinc Oxide Industry Volume K Tons Forecast, by Application 2020 & 2033
- Table 11: Global Zinc Oxide Industry Revenue million Forecast, by Country 2020 & 2033
- Table 12: Global Zinc Oxide Industry Volume K Tons Forecast, by Country 2020 & 2033
- Table 13: China Zinc Oxide Industry Revenue (million) Forecast, by Application 2020 & 2033
- Table 14: China Zinc Oxide Industry Volume (K Tons) Forecast, by Application 2020 & 2033
- Table 15: India Zinc Oxide Industry Revenue (million) Forecast, by Application 2020 & 2033
- Table 16: India Zinc Oxide Industry Volume (K Tons) Forecast, by Application 2020 & 2033
- Table 17: Japan Zinc Oxide Industry Revenue (million) Forecast, by Application 2020 & 2033
- Table 18: Japan Zinc Oxide Industry Volume (K Tons) Forecast, by Application 2020 & 2033
- Table 19: South Korea Zinc Oxide Industry Revenue (million) Forecast, by Application 2020 & 2033
- Table 20: South Korea Zinc Oxide Industry Volume (K Tons) Forecast, by Application 2020 & 2033
- Table 21: Rest of Asia Pacific Zinc Oxide Industry Revenue (million) Forecast, by Application 2020 & 2033
- Table 22: Rest of Asia Pacific Zinc Oxide Industry Volume (K Tons) Forecast, by Application 2020 & 2033
- Table 23: Global Zinc Oxide Industry Revenue million Forecast, by Process 2020 & 2033
- Table 24: Global Zinc Oxide Industry Volume K Tons Forecast, by Process 2020 & 2033
- Table 25: Global Zinc Oxide Industry Revenue million Forecast, by Application 2020 & 2033
- Table 26: Global Zinc Oxide Industry Volume K Tons Forecast, by Application 2020 & 2033
- Table 27: Global Zinc Oxide Industry Revenue million Forecast, by Country 2020 & 2033
- Table 28: Global Zinc Oxide Industry Volume K Tons Forecast, by Country 2020 & 2033
- Table 29: United States Zinc Oxide Industry Revenue (million) Forecast, by Application 2020 & 2033
- Table 30: United States Zinc Oxide Industry Volume (K Tons) Forecast, by Application 2020 & 2033
- Table 31: Canada Zinc Oxide Industry Revenue (million) Forecast, by Application 2020 & 2033
- Table 32: Canada Zinc Oxide Industry Volume (K Tons) Forecast, by Application 2020 & 2033
- Table 33: Mexico Zinc Oxide Industry Revenue (million) Forecast, by Application 2020 & 2033
- Table 34: Mexico Zinc Oxide Industry Volume (K Tons) Forecast, by Application 2020 & 2033
- Table 35: Global Zinc Oxide Industry Revenue million Forecast, by Process 2020 & 2033
- Table 36: Global Zinc Oxide Industry Volume K Tons Forecast, by Process 2020 & 2033
- Table 37: Global Zinc Oxide Industry Revenue million Forecast, by Application 2020 & 2033
- Table 38: Global Zinc Oxide Industry Volume K Tons Forecast, by Application 2020 & 2033
- Table 39: Global Zinc Oxide Industry Revenue million Forecast, by Country 2020 & 2033
- Table 40: Global Zinc Oxide Industry Volume K Tons Forecast, by Country 2020 & 2033
- Table 41: Germany Zinc Oxide Industry Revenue (million) Forecast, by Application 2020 & 2033
- Table 42: Germany Zinc Oxide Industry Volume (K Tons) Forecast, by Application 2020 & 2033
- Table 43: United Kingdom Zinc Oxide Industry Revenue (million) Forecast, by Application 2020 & 2033
- Table 44: United Kingdom Zinc Oxide Industry Volume (K Tons) Forecast, by Application 2020 & 2033
- Table 45: France Zinc Oxide Industry Revenue (million) Forecast, by Application 2020 & 2033
- Table 46: France Zinc Oxide Industry Volume (K Tons) Forecast, by Application 2020 & 2033
- Table 47: Italy Zinc Oxide Industry Revenue (million) Forecast, by Application 2020 & 2033
- Table 48: Italy Zinc Oxide Industry Volume (K Tons) Forecast, by Application 2020 & 2033
- Table 49: Rest of Europe Zinc Oxide Industry Revenue (million) Forecast, by Application 2020 & 2033
- Table 50: Rest of Europe Zinc Oxide Industry Volume (K Tons) Forecast, by Application 2020 & 2033
- Table 51: Global Zinc Oxide Industry Revenue million Forecast, by Process 2020 & 2033
- Table 52: Global Zinc Oxide Industry Volume K Tons Forecast, by Process 2020 & 2033
- Table 53: Global Zinc Oxide Industry Revenue million Forecast, by Application 2020 & 2033
- Table 54: Global Zinc Oxide Industry Volume K Tons Forecast, by Application 2020 & 2033
- Table 55: Global Zinc Oxide Industry Revenue million Forecast, by Country 2020 & 2033
- Table 56: Global Zinc Oxide Industry Volume K Tons Forecast, by Country 2020 & 2033
- Table 57: Brazil Zinc Oxide Industry Revenue (million) Forecast, by Application 2020 & 2033
- Table 58: Brazil Zinc Oxide Industry Volume (K Tons) Forecast, by Application 2020 & 2033
- Table 59: Argentina Zinc Oxide Industry Revenue (million) Forecast, by Application 2020 & 2033
- Table 60: Argentina Zinc Oxide Industry Volume (K Tons) Forecast, by Application 2020 & 2033
- Table 61: Rest of South America Zinc Oxide Industry Revenue (million) Forecast, by Application 2020 & 2033
- Table 62: Rest of South America Zinc Oxide Industry Volume (K Tons) Forecast, by Application 2020 & 2033
- Table 63: Global Zinc Oxide Industry Revenue million Forecast, by Process 2020 & 2033
- Table 64: Global Zinc Oxide Industry Volume K Tons Forecast, by Process 2020 & 2033
- Table 65: Global Zinc Oxide Industry Revenue million Forecast, by Application 2020 & 2033
- Table 66: Global Zinc Oxide Industry Volume K Tons Forecast, by Application 2020 & 2033
- Table 67: Global Zinc Oxide Industry Revenue million Forecast, by Country 2020 & 2033
- Table 68: Global Zinc Oxide Industry Volume K Tons Forecast, by Country 2020 & 2033
- Table 69: Saudi Arabia Zinc Oxide Industry Revenue (million) Forecast, by Application 2020 & 2033
- Table 70: Saudi Arabia Zinc Oxide Industry Volume (K Tons) Forecast, by Application 2020 & 2033
- Table 71: South Africa Zinc Oxide Industry Revenue (million) Forecast, by Application 2020 & 2033
- Table 72: South Africa Zinc Oxide Industry Volume (K Tons) Forecast, by Application 2020 & 2033
- Table 73: Rest of Middle East and Africa Zinc Oxide Industry Revenue (million) Forecast, by Application 2020 & 2033
- Table 74: Rest of Middle East and Africa Zinc Oxide Industry Volume (K Tons) Forecast, by Application 2020 & 2033
Frequently Asked Questions
1. What is the projected Compound Annual Growth Rate (CAGR) of the Zinc Oxide Industry?
The projected CAGR is approximately 3.81%.
2. Which companies are prominent players in the Zinc Oxide Industry?
Key companies in the market include Pan-Continental Chemical, Hanil, HAKUSUI TECH, EverZinc, Zinc-Co-India, Rubamin, Weifang Longda Zinc Industry Co Ltd, Suraj Udyog, Hindustan Zinc Limited, Zochem Inc *List Not Exhaustive, Zinc Nacional SA, Silox SA, Akrochem Corporation, ZM SILESIA SA.
3. What are the main segments of the Zinc Oxide Industry?
The market segments include Process, Application.
4. Can you provide details about the market size?
The market size is estimated to be USD 2.36 million as of 2022.
5. What are some drivers contributing to market growth?
Growing Demand from the Rubber and Tire Industry; Other Drivers.
6. What are the notable trends driving market growth?
The Rubber and Tire Industry Dominate the Market.
7. Are there any restraints impacting market growth?
Fluctuation in Raw Material Prices; Other Restraints.
8. Can you provide examples of recent developments in the market?
June 2022: Aterian Investment Partners merged U.S. Zinc and EverZinc, two of the world's largest producers of zinc chemical products, to form the world's leading zinc chemistry company.
9. What pricing options are available for accessing the report?
Pricing options include single-user, multi-user, and enterprise licenses priced at USD 4750, USD 5250, and USD 8750 respectively.
10. Is the market size provided in terms of value or volume?
The market size is provided in terms of value, measured in million and volume, measured in K Tons.
11. Are there any specific market keywords associated with the report?
Yes, the market keyword associated with the report is "Zinc Oxide Industry," which aids in identifying and referencing the specific market segment covered.
12. How do I determine which pricing option suits my needs best?
The pricing options vary based on user requirements and access needs. Individual users may opt for single-user licenses, while businesses requiring broader access may choose multi-user or enterprise licenses for cost-effective access to the report.
13. Are there any additional resources or data provided in the Zinc Oxide Industry report?
While the report offers comprehensive insights, it's advisable to review the specific contents or supplementary materials provided to ascertain if additional resources or data are available.
14. How can I stay updated on further developments or reports in the Zinc Oxide Industry?
To stay informed about further developments, trends, and reports in the Zinc Oxide Industry, consider subscribing to industry newsletters, following relevant companies and organizations, or regularly checking reputable industry news sources and publications.
Methodology
Step 1 - Identification of Relevant Samples Size from Population Database


Step 2 - Approaches for Defining Global Market Size (Value, Volume* & Price*)

Note*: In applicable scenarios
Step 3 - Data Sources
Primary Research
- Web Analytics
- Survey Reports
- Research Institute
- Latest Research Reports
- Opinion Leaders
Secondary Research
- Annual Reports
- White Paper
- Latest Press Release
- Industry Association
- Paid Database
- Investor Presentations

Step 4 - Data Triangulation
Involves using different sources of information in order to increase the validity of a study
These sources are likely to be stakeholders in a program - participants, other researchers, program staff, other community members, and so on.
Then we put all data in single framework & apply various statistical tools to find out the dynamic on the market.
During the analysis stage, feedback from the stakeholder groups would be compared to determine areas of agreement as well as areas of divergence