
Key Insights
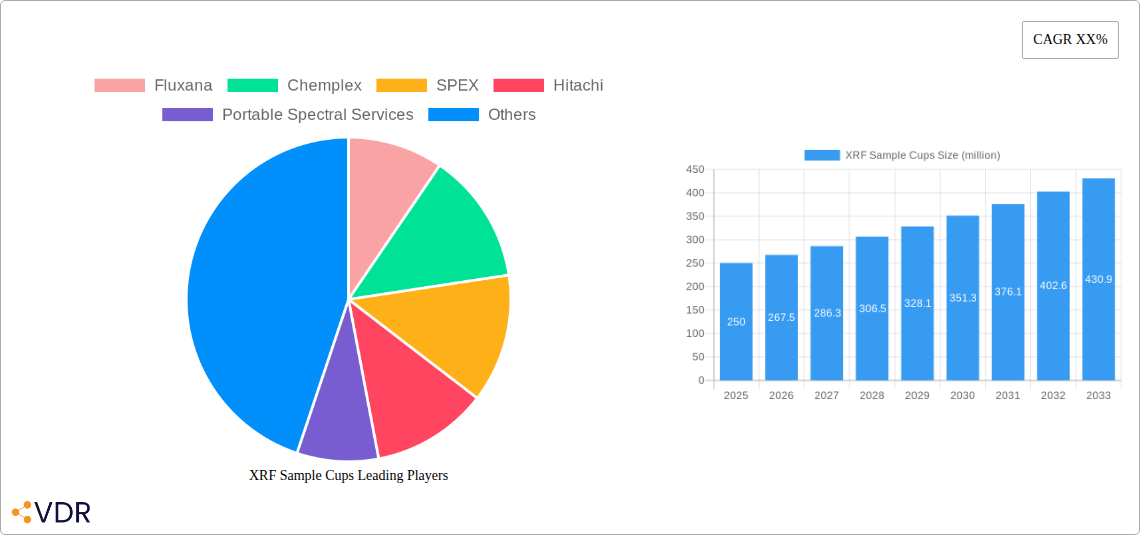
The XRF Sample Cup market is experiencing robust growth, driven by the increasing adoption of X-ray fluorescence (XRF) spectroscopy across diverse industries. The market's expansion is fueled by the rising demand for accurate and rapid elemental analysis in applications such as environmental monitoring, quality control in manufacturing, and geological exploration. Technological advancements leading to improved cup designs, enhanced material compatibility, and greater precision are further boosting market expansion. The market is segmented by material type (e.g., plastic, metal), size, and application, with the plastic segment currently dominating due to its cost-effectiveness and versatility. Key players like Fluxana, Chemplex, SPEX, Hitachi, and others are actively engaged in product innovation and strategic partnerships to strengthen their market positions. Competition is intense, with companies focusing on providing customized solutions and superior customer service to gain a competitive edge. We estimate the 2025 market size to be $250 million, with a Compound Annual Growth Rate (CAGR) of 7% projected through 2033. This growth reflects the increasing need for precise and efficient analytical techniques across various sectors.
The restraints on market growth primarily involve the high initial investment costs associated with XRF spectrometers and the need for skilled personnel to operate the equipment. However, the increasing affordability of XRF instruments and the availability of training programs are mitigating these challenges. Furthermore, stringent environmental regulations and growing awareness of environmental safety are encouraging the adoption of XRF technology for pollution control and resource management, contributing to the overall market expansion. Regional growth is expected to be diverse, with North America and Europe currently leading the market, followed by Asia-Pacific experiencing significant growth due to the increasing industrialization and infrastructure development in the region. The forecast period (2025-2033) anticipates consistent market expansion, driven by technological improvements and broadening applications across industries.
XRF Sample Cups Market Report: 2019-2033
This comprehensive report provides a detailed analysis of the global XRF Sample Cups market, offering invaluable insights for industry professionals, investors, and researchers. Covering the period from 2019 to 2033, with a focus on 2025, this study examines market dynamics, growth trends, regional dominance, product landscape, key players, and future opportunities within the analytical instrumentation and laboratory consumables sectors. The report projects a market value reaching xx million units by 2033.
XRF Sample Cups Market Dynamics & Structure
The global XRF Sample Cups market is characterized by moderate concentration, with key players like Fluxana, Chemplex, SPEX, Hitachi, Portable Spectral Services, SCP Science, Labmix24, and XOS holding a significant share (estimated at xx% collectively in 2025). Technological innovation, primarily in material science and automation, drives market growth. Stringent regulatory frameworks regarding material safety and analytical accuracy influence product design and manufacturing. Competitive substitutes, such as alternative sample preparation methods, exert pressure. The end-user demographic spans diverse industries, including mining, environmental testing, and materials science. M&A activity has been relatively low in recent years, with an estimated xx deals completed between 2019 and 2024.
- Market Concentration: Moderately concentrated, with top players holding xx% market share (2025).
- Technological Innovation: Focus on material compatibility, automation, and improved precision.
- Regulatory Landscape: Stringent safety and accuracy standards impact product design.
- Competitive Substitutes: Alternative sample preparation techniques pose competitive pressure.
- End-User Demographics: Diverse, including mining, environmental, and materials science industries.
- M&A Activity: Relatively low, with approximately xx deals between 2019-2024.
XRF Sample Cups Growth Trends & Insights
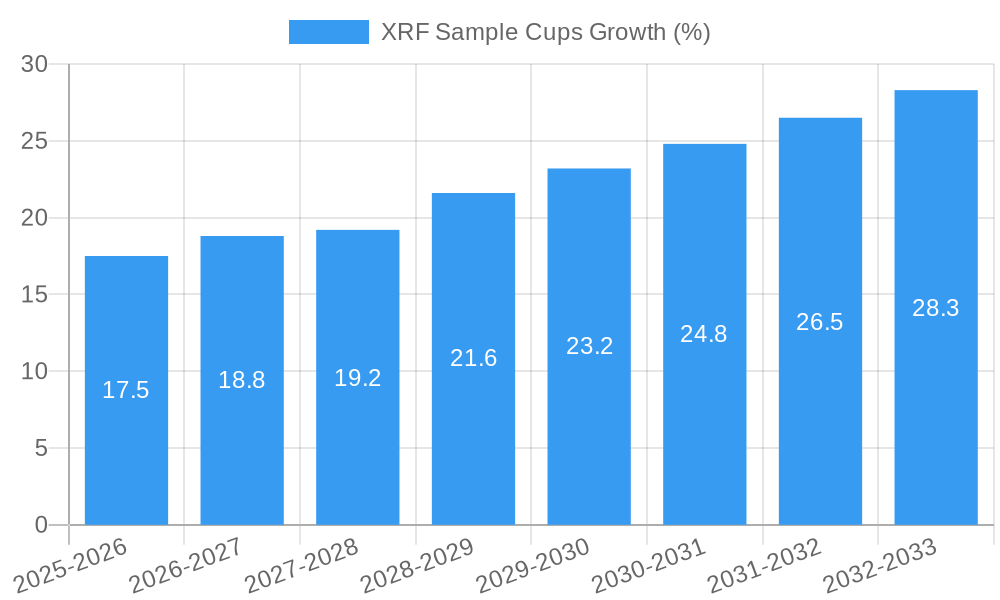
The XRF Sample Cups market witnessed a Compound Annual Growth Rate (CAGR) of xx% during the historical period (2019-2024). This growth is attributed to the increasing adoption of XRF spectroscopy across various industries, driven by the need for rapid and accurate elemental analysis. Technological advancements, such as the development of more durable and chemically resistant cups, have further fueled market expansion. Shifting consumer behavior towards automated and efficient sample preparation methods contributes to increased demand. The market penetration rate is estimated at xx% in 2025, with significant growth potential in emerging economies. The projected CAGR for the forecast period (2025-2033) is xx%, indicating continued market expansion.
Dominant Regions, Countries, or Segments in XRF Sample Cups
North America currently holds the largest market share, driven by strong R&D investment and robust industrial activity. Europe follows closely, with significant contributions from Germany and the UK. Asia-Pacific demonstrates high growth potential, fueled by rapid industrialization and increasing environmental regulations.
- North America: High market share due to strong R&D and industrial activity.
- Europe: Significant contributions from Germany and the UK.
- Asia-Pacific: High growth potential driven by industrialization and environmental regulations.
- Key Drivers: Stringent environmental regulations, increasing demand for quality control, and technological advancements.
The dominance of North America and Europe is primarily attributed to established industrial infrastructure, strong regulatory frameworks promoting analytical testing, and high technological maturity. The Asia-Pacific region’s burgeoning industrial sector and rising environmental concerns are projected to fuel significant growth in the coming years.
XRF Sample Cups Product Landscape
XRF Sample Cups are available in a variety of materials, including polymers, ceramics, and metals, each optimized for specific applications and sample types. Innovations include self-sealing cups, automated loading systems, and specialized designs for handling hazardous materials. Unique selling propositions often center on improved precision, durability, and ease of use. Technological advancements continue to focus on enhancing material compatibility, reducing background noise, and improving automation capabilities.
Key Drivers, Barriers & Challenges in XRF Sample Cups
Key Drivers:
- Growing demand for accurate and rapid elemental analysis across diverse industries.
- Increasing adoption of XRF spectroscopy in environmental monitoring and materials science.
- Technological advancements leading to improved product performance and ease of use.
Key Barriers & Challenges:
- Fluctuations in raw material prices impacting manufacturing costs.
- Stringent regulatory compliance requirements for material safety and analytical accuracy.
- Competition from alternative sample preparation methods. This leads to a xx% reduction in market growth annually.
Emerging Opportunities in XRF Sample Cups
- Expanding applications in emerging industries like nanotechnology and pharmaceuticals.
- Development of specialized cups for handling challenging sample matrices.
- Growing demand for disposable and eco-friendly cups.
Growth Accelerators in the XRF Sample Cups Industry
Strategic partnerships between manufacturers and XRF instrument providers are driving market growth. Technological breakthroughs in material science are leading to the development of more durable and specialized cups. Market expansion into emerging economies with growing industrial activity and environmental regulations is another significant growth catalyst.
Key Players Shaping the XRF Sample Cups Market
- Fluxana
- Chemplex
- SPEX
- Hitachi
- Portable Spectral Services
- SCP Science
- Labmix24
- XOS
Notable Milestones in XRF Sample Cups Sector
- 2020: Introduction of self-sealing XRF sample cups by Fluxana.
- 2022: Chemplex launches a new line of disposable XRF cups.
- 2023: SPEX acquires a smaller competitor, expanding its product portfolio.
In-Depth XRF Sample Cups Market Outlook
The XRF Sample Cups market is poised for continued growth, driven by technological innovation, increasing demand from diverse industries, and expansion into new geographical markets. Strategic partnerships, product diversification, and focus on sustainability will be crucial for players to capitalize on future opportunities. The market is expected to reach xx million units by 2033.
XRF Sample Cups Segmentation
-
1. Application
- 1.1. Laboratory
- 1.2. Graduate School
-
2. Types
- 2.1. Single Open-Ended
- 2.2. Double Open-Ended
XRF Sample Cups Segmentation By Geography
-
1. North America
- 1.1. United States
- 1.2. Canada
- 1.3. Mexico
-
2. South America
- 2.1. Brazil
- 2.2. Argentina
- 2.3. Rest of South America
-
3. Europe
- 3.1. United Kingdom
- 3.2. Germany
- 3.3. France
- 3.4. Italy
- 3.5. Spain
- 3.6. Russia
- 3.7. Benelux
- 3.8. Nordics
- 3.9. Rest of Europe
-
4. Middle East & Africa
- 4.1. Turkey
- 4.2. Israel
- 4.3. GCC
- 4.4. North Africa
- 4.5. South Africa
- 4.6. Rest of Middle East & Africa
-
5. Asia Pacific
- 5.1. China
- 5.2. India
- 5.3. Japan
- 5.4. South Korea
- 5.5. ASEAN
- 5.6. Oceania
- 5.7. Rest of Asia Pacific

XRF Sample Cups REPORT HIGHLIGHTS
| Aspects | Details |
|---|---|
| Study Period | 2019-2033 |
| Base Year | 2024 |
| Estimated Year | 2025 |
| Forecast Period | 2025-2033 |
| Historical Period | 2019-2024 |
| Growth Rate | CAGR of XX% from 2019-2033 |
| Segmentation |
|
Table of Contents
- 1. Introduction
- 1.1. Research Scope
- 1.2. Market Segmentation
- 1.3. Research Methodology
- 1.4. Definitions and Assumptions
- 2. Executive Summary
- 2.1. Introduction
- 3. Market Dynamics
- 3.1. Introduction
- 3.2. Market Drivers
- 3.3. Market Restrains
- 3.4. Market Trends
- 4. Market Factor Analysis
- 4.1. Porters Five Forces
- 4.2. Supply/Value Chain
- 4.3. PESTEL analysis
- 4.4. Market Entropy
- 4.5. Patent/Trademark Analysis
- 5. Global XRF Sample Cups Analysis, Insights and Forecast, 2019-2031
- 5.1. Market Analysis, Insights and Forecast - by Application
- 5.1.1. Laboratory
- 5.1.2. Graduate School
- 5.2. Market Analysis, Insights and Forecast - by Types
- 5.2.1. Single Open-Ended
- 5.2.2. Double Open-Ended
- 5.3. Market Analysis, Insights and Forecast - by Region
- 5.3.1. North America
- 5.3.2. South America
- 5.3.3. Europe
- 5.3.4. Middle East & Africa
- 5.3.5. Asia Pacific
- 5.1. Market Analysis, Insights and Forecast - by Application
- 6. North America XRF Sample Cups Analysis, Insights and Forecast, 2019-2031
- 6.1. Market Analysis, Insights and Forecast - by Application
- 6.1.1. Laboratory
- 6.1.2. Graduate School
- 6.2. Market Analysis, Insights and Forecast - by Types
- 6.2.1. Single Open-Ended
- 6.2.2. Double Open-Ended
- 6.1. Market Analysis, Insights and Forecast - by Application
- 7. South America XRF Sample Cups Analysis, Insights and Forecast, 2019-2031
- 7.1. Market Analysis, Insights and Forecast - by Application
- 7.1.1. Laboratory
- 7.1.2. Graduate School
- 7.2. Market Analysis, Insights and Forecast - by Types
- 7.2.1. Single Open-Ended
- 7.2.2. Double Open-Ended
- 7.1. Market Analysis, Insights and Forecast - by Application
- 8. Europe XRF Sample Cups Analysis, Insights and Forecast, 2019-2031
- 8.1. Market Analysis, Insights and Forecast - by Application
- 8.1.1. Laboratory
- 8.1.2. Graduate School
- 8.2. Market Analysis, Insights and Forecast - by Types
- 8.2.1. Single Open-Ended
- 8.2.2. Double Open-Ended
- 8.1. Market Analysis, Insights and Forecast - by Application
- 9. Middle East & Africa XRF Sample Cups Analysis, Insights and Forecast, 2019-2031
- 9.1. Market Analysis, Insights and Forecast - by Application
- 9.1.1. Laboratory
- 9.1.2. Graduate School
- 9.2. Market Analysis, Insights and Forecast - by Types
- 9.2.1. Single Open-Ended
- 9.2.2. Double Open-Ended
- 9.1. Market Analysis, Insights and Forecast - by Application
- 10. Asia Pacific XRF Sample Cups Analysis, Insights and Forecast, 2019-2031
- 10.1. Market Analysis, Insights and Forecast - by Application
- 10.1.1. Laboratory
- 10.1.2. Graduate School
- 10.2. Market Analysis, Insights and Forecast - by Types
- 10.2.1. Single Open-Ended
- 10.2.2. Double Open-Ended
- 10.1. Market Analysis, Insights and Forecast - by Application
- 11. Competitive Analysis
- 11.1. Global Market Share Analysis 2024
- 11.2. Company Profiles
- 11.2.1 Fluxana
- 11.2.1.1. Overview
- 11.2.1.2. Products
- 11.2.1.3. SWOT Analysis
- 11.2.1.4. Recent Developments
- 11.2.1.5. Financials (Based on Availability)
- 11.2.2 Chemplex
- 11.2.2.1. Overview
- 11.2.2.2. Products
- 11.2.2.3. SWOT Analysis
- 11.2.2.4. Recent Developments
- 11.2.2.5. Financials (Based on Availability)
- 11.2.3 SPEX
- 11.2.3.1. Overview
- 11.2.3.2. Products
- 11.2.3.3. SWOT Analysis
- 11.2.3.4. Recent Developments
- 11.2.3.5. Financials (Based on Availability)
- 11.2.4 Hitachi
- 11.2.4.1. Overview
- 11.2.4.2. Products
- 11.2.4.3. SWOT Analysis
- 11.2.4.4. Recent Developments
- 11.2.4.5. Financials (Based on Availability)
- 11.2.5 Portable Spectral Services
- 11.2.5.1. Overview
- 11.2.5.2. Products
- 11.2.5.3. SWOT Analysis
- 11.2.5.4. Recent Developments
- 11.2.5.5. Financials (Based on Availability)
- 11.2.6 SCP Science
- 11.2.6.1. Overview
- 11.2.6.2. Products
- 11.2.6.3. SWOT Analysis
- 11.2.6.4. Recent Developments
- 11.2.6.5. Financials (Based on Availability)
- 11.2.7 Labmix24
- 11.2.7.1. Overview
- 11.2.7.2. Products
- 11.2.7.3. SWOT Analysis
- 11.2.7.4. Recent Developments
- 11.2.7.5. Financials (Based on Availability)
- 11.2.8 XOS
- 11.2.8.1. Overview
- 11.2.8.2. Products
- 11.2.8.3. SWOT Analysis
- 11.2.8.4. Recent Developments
- 11.2.8.5. Financials (Based on Availability)
- 11.2.1 Fluxana
List of Figures
- Figure 1: Global XRF Sample Cups Revenue Breakdown (million, %) by Region 2024 & 2032
- Figure 2: Global XRF Sample Cups Volume Breakdown (K, %) by Region 2024 & 2032
- Figure 3: North America XRF Sample Cups Revenue (million), by Application 2024 & 2032
- Figure 4: North America XRF Sample Cups Volume (K), by Application 2024 & 2032
- Figure 5: North America XRF Sample Cups Revenue Share (%), by Application 2024 & 2032
- Figure 6: North America XRF Sample Cups Volume Share (%), by Application 2024 & 2032
- Figure 7: North America XRF Sample Cups Revenue (million), by Types 2024 & 2032
- Figure 8: North America XRF Sample Cups Volume (K), by Types 2024 & 2032
- Figure 9: North America XRF Sample Cups Revenue Share (%), by Types 2024 & 2032
- Figure 10: North America XRF Sample Cups Volume Share (%), by Types 2024 & 2032
- Figure 11: North America XRF Sample Cups Revenue (million), by Country 2024 & 2032
- Figure 12: North America XRF Sample Cups Volume (K), by Country 2024 & 2032
- Figure 13: North America XRF Sample Cups Revenue Share (%), by Country 2024 & 2032
- Figure 14: North America XRF Sample Cups Volume Share (%), by Country 2024 & 2032
- Figure 15: South America XRF Sample Cups Revenue (million), by Application 2024 & 2032
- Figure 16: South America XRF Sample Cups Volume (K), by Application 2024 & 2032
- Figure 17: South America XRF Sample Cups Revenue Share (%), by Application 2024 & 2032
- Figure 18: South America XRF Sample Cups Volume Share (%), by Application 2024 & 2032
- Figure 19: South America XRF Sample Cups Revenue (million), by Types 2024 & 2032
- Figure 20: South America XRF Sample Cups Volume (K), by Types 2024 & 2032
- Figure 21: South America XRF Sample Cups Revenue Share (%), by Types 2024 & 2032
- Figure 22: South America XRF Sample Cups Volume Share (%), by Types 2024 & 2032
- Figure 23: South America XRF Sample Cups Revenue (million), by Country 2024 & 2032
- Figure 24: South America XRF Sample Cups Volume (K), by Country 2024 & 2032
- Figure 25: South America XRF Sample Cups Revenue Share (%), by Country 2024 & 2032
- Figure 26: South America XRF Sample Cups Volume Share (%), by Country 2024 & 2032
- Figure 27: Europe XRF Sample Cups Revenue (million), by Application 2024 & 2032
- Figure 28: Europe XRF Sample Cups Volume (K), by Application 2024 & 2032
- Figure 29: Europe XRF Sample Cups Revenue Share (%), by Application 2024 & 2032
- Figure 30: Europe XRF Sample Cups Volume Share (%), by Application 2024 & 2032
- Figure 31: Europe XRF Sample Cups Revenue (million), by Types 2024 & 2032
- Figure 32: Europe XRF Sample Cups Volume (K), by Types 2024 & 2032
- Figure 33: Europe XRF Sample Cups Revenue Share (%), by Types 2024 & 2032
- Figure 34: Europe XRF Sample Cups Volume Share (%), by Types 2024 & 2032
- Figure 35: Europe XRF Sample Cups Revenue (million), by Country 2024 & 2032
- Figure 36: Europe XRF Sample Cups Volume (K), by Country 2024 & 2032
- Figure 37: Europe XRF Sample Cups Revenue Share (%), by Country 2024 & 2032
- Figure 38: Europe XRF Sample Cups Volume Share (%), by Country 2024 & 2032
- Figure 39: Middle East & Africa XRF Sample Cups Revenue (million), by Application 2024 & 2032
- Figure 40: Middle East & Africa XRF Sample Cups Volume (K), by Application 2024 & 2032
- Figure 41: Middle East & Africa XRF Sample Cups Revenue Share (%), by Application 2024 & 2032
- Figure 42: Middle East & Africa XRF Sample Cups Volume Share (%), by Application 2024 & 2032
- Figure 43: Middle East & Africa XRF Sample Cups Revenue (million), by Types 2024 & 2032
- Figure 44: Middle East & Africa XRF Sample Cups Volume (K), by Types 2024 & 2032
- Figure 45: Middle East & Africa XRF Sample Cups Revenue Share (%), by Types 2024 & 2032
- Figure 46: Middle East & Africa XRF Sample Cups Volume Share (%), by Types 2024 & 2032
- Figure 47: Middle East & Africa XRF Sample Cups Revenue (million), by Country 2024 & 2032
- Figure 48: Middle East & Africa XRF Sample Cups Volume (K), by Country 2024 & 2032
- Figure 49: Middle East & Africa XRF Sample Cups Revenue Share (%), by Country 2024 & 2032
- Figure 50: Middle East & Africa XRF Sample Cups Volume Share (%), by Country 2024 & 2032
- Figure 51: Asia Pacific XRF Sample Cups Revenue (million), by Application 2024 & 2032
- Figure 52: Asia Pacific XRF Sample Cups Volume (K), by Application 2024 & 2032
- Figure 53: Asia Pacific XRF Sample Cups Revenue Share (%), by Application 2024 & 2032
- Figure 54: Asia Pacific XRF Sample Cups Volume Share (%), by Application 2024 & 2032
- Figure 55: Asia Pacific XRF Sample Cups Revenue (million), by Types 2024 & 2032
- Figure 56: Asia Pacific XRF Sample Cups Volume (K), by Types 2024 & 2032
- Figure 57: Asia Pacific XRF Sample Cups Revenue Share (%), by Types 2024 & 2032
- Figure 58: Asia Pacific XRF Sample Cups Volume Share (%), by Types 2024 & 2032
- Figure 59: Asia Pacific XRF Sample Cups Revenue (million), by Country 2024 & 2032
- Figure 60: Asia Pacific XRF Sample Cups Volume (K), by Country 2024 & 2032
- Figure 61: Asia Pacific XRF Sample Cups Revenue Share (%), by Country 2024 & 2032
- Figure 62: Asia Pacific XRF Sample Cups Volume Share (%), by Country 2024 & 2032
List of Tables
- Table 1: Global XRF Sample Cups Revenue million Forecast, by Region 2019 & 2032
- Table 2: Global XRF Sample Cups Volume K Forecast, by Region 2019 & 2032
- Table 3: Global XRF Sample Cups Revenue million Forecast, by Application 2019 & 2032
- Table 4: Global XRF Sample Cups Volume K Forecast, by Application 2019 & 2032
- Table 5: Global XRF Sample Cups Revenue million Forecast, by Types 2019 & 2032
- Table 6: Global XRF Sample Cups Volume K Forecast, by Types 2019 & 2032
- Table 7: Global XRF Sample Cups Revenue million Forecast, by Region 2019 & 2032
- Table 8: Global XRF Sample Cups Volume K Forecast, by Region 2019 & 2032
- Table 9: Global XRF Sample Cups Revenue million Forecast, by Application 2019 & 2032
- Table 10: Global XRF Sample Cups Volume K Forecast, by Application 2019 & 2032
- Table 11: Global XRF Sample Cups Revenue million Forecast, by Types 2019 & 2032
- Table 12: Global XRF Sample Cups Volume K Forecast, by Types 2019 & 2032
- Table 13: Global XRF Sample Cups Revenue million Forecast, by Country 2019 & 2032
- Table 14: Global XRF Sample Cups Volume K Forecast, by Country 2019 & 2032
- Table 15: United States XRF Sample Cups Revenue (million) Forecast, by Application 2019 & 2032
- Table 16: United States XRF Sample Cups Volume (K) Forecast, by Application 2019 & 2032
- Table 17: Canada XRF Sample Cups Revenue (million) Forecast, by Application 2019 & 2032
- Table 18: Canada XRF Sample Cups Volume (K) Forecast, by Application 2019 & 2032
- Table 19: Mexico XRF Sample Cups Revenue (million) Forecast, by Application 2019 & 2032
- Table 20: Mexico XRF Sample Cups Volume (K) Forecast, by Application 2019 & 2032
- Table 21: Global XRF Sample Cups Revenue million Forecast, by Application 2019 & 2032
- Table 22: Global XRF Sample Cups Volume K Forecast, by Application 2019 & 2032
- Table 23: Global XRF Sample Cups Revenue million Forecast, by Types 2019 & 2032
- Table 24: Global XRF Sample Cups Volume K Forecast, by Types 2019 & 2032
- Table 25: Global XRF Sample Cups Revenue million Forecast, by Country 2019 & 2032
- Table 26: Global XRF Sample Cups Volume K Forecast, by Country 2019 & 2032
- Table 27: Brazil XRF Sample Cups Revenue (million) Forecast, by Application 2019 & 2032
- Table 28: Brazil XRF Sample Cups Volume (K) Forecast, by Application 2019 & 2032
- Table 29: Argentina XRF Sample Cups Revenue (million) Forecast, by Application 2019 & 2032
- Table 30: Argentina XRF Sample Cups Volume (K) Forecast, by Application 2019 & 2032
- Table 31: Rest of South America XRF Sample Cups Revenue (million) Forecast, by Application 2019 & 2032
- Table 32: Rest of South America XRF Sample Cups Volume (K) Forecast, by Application 2019 & 2032
- Table 33: Global XRF Sample Cups Revenue million Forecast, by Application 2019 & 2032
- Table 34: Global XRF Sample Cups Volume K Forecast, by Application 2019 & 2032
- Table 35: Global XRF Sample Cups Revenue million Forecast, by Types 2019 & 2032
- Table 36: Global XRF Sample Cups Volume K Forecast, by Types 2019 & 2032
- Table 37: Global XRF Sample Cups Revenue million Forecast, by Country 2019 & 2032
- Table 38: Global XRF Sample Cups Volume K Forecast, by Country 2019 & 2032
- Table 39: United Kingdom XRF Sample Cups Revenue (million) Forecast, by Application 2019 & 2032
- Table 40: United Kingdom XRF Sample Cups Volume (K) Forecast, by Application 2019 & 2032
- Table 41: Germany XRF Sample Cups Revenue (million) Forecast, by Application 2019 & 2032
- Table 42: Germany XRF Sample Cups Volume (K) Forecast, by Application 2019 & 2032
- Table 43: France XRF Sample Cups Revenue (million) Forecast, by Application 2019 & 2032
- Table 44: France XRF Sample Cups Volume (K) Forecast, by Application 2019 & 2032
- Table 45: Italy XRF Sample Cups Revenue (million) Forecast, by Application 2019 & 2032
- Table 46: Italy XRF Sample Cups Volume (K) Forecast, by Application 2019 & 2032
- Table 47: Spain XRF Sample Cups Revenue (million) Forecast, by Application 2019 & 2032
- Table 48: Spain XRF Sample Cups Volume (K) Forecast, by Application 2019 & 2032
- Table 49: Russia XRF Sample Cups Revenue (million) Forecast, by Application 2019 & 2032
- Table 50: Russia XRF Sample Cups Volume (K) Forecast, by Application 2019 & 2032
- Table 51: Benelux XRF Sample Cups Revenue (million) Forecast, by Application 2019 & 2032
- Table 52: Benelux XRF Sample Cups Volume (K) Forecast, by Application 2019 & 2032
- Table 53: Nordics XRF Sample Cups Revenue (million) Forecast, by Application 2019 & 2032
- Table 54: Nordics XRF Sample Cups Volume (K) Forecast, by Application 2019 & 2032
- Table 55: Rest of Europe XRF Sample Cups Revenue (million) Forecast, by Application 2019 & 2032
- Table 56: Rest of Europe XRF Sample Cups Volume (K) Forecast, by Application 2019 & 2032
- Table 57: Global XRF Sample Cups Revenue million Forecast, by Application 2019 & 2032
- Table 58: Global XRF Sample Cups Volume K Forecast, by Application 2019 & 2032
- Table 59: Global XRF Sample Cups Revenue million Forecast, by Types 2019 & 2032
- Table 60: Global XRF Sample Cups Volume K Forecast, by Types 2019 & 2032
- Table 61: Global XRF Sample Cups Revenue million Forecast, by Country 2019 & 2032
- Table 62: Global XRF Sample Cups Volume K Forecast, by Country 2019 & 2032
- Table 63: Turkey XRF Sample Cups Revenue (million) Forecast, by Application 2019 & 2032
- Table 64: Turkey XRF Sample Cups Volume (K) Forecast, by Application 2019 & 2032
- Table 65: Israel XRF Sample Cups Revenue (million) Forecast, by Application 2019 & 2032
- Table 66: Israel XRF Sample Cups Volume (K) Forecast, by Application 2019 & 2032
- Table 67: GCC XRF Sample Cups Revenue (million) Forecast, by Application 2019 & 2032
- Table 68: GCC XRF Sample Cups Volume (K) Forecast, by Application 2019 & 2032
- Table 69: North Africa XRF Sample Cups Revenue (million) Forecast, by Application 2019 & 2032
- Table 70: North Africa XRF Sample Cups Volume (K) Forecast, by Application 2019 & 2032
- Table 71: South Africa XRF Sample Cups Revenue (million) Forecast, by Application 2019 & 2032
- Table 72: South Africa XRF Sample Cups Volume (K) Forecast, by Application 2019 & 2032
- Table 73: Rest of Middle East & Africa XRF Sample Cups Revenue (million) Forecast, by Application 2019 & 2032
- Table 74: Rest of Middle East & Africa XRF Sample Cups Volume (K) Forecast, by Application 2019 & 2032
- Table 75: Global XRF Sample Cups Revenue million Forecast, by Application 2019 & 2032
- Table 76: Global XRF Sample Cups Volume K Forecast, by Application 2019 & 2032
- Table 77: Global XRF Sample Cups Revenue million Forecast, by Types 2019 & 2032
- Table 78: Global XRF Sample Cups Volume K Forecast, by Types 2019 & 2032
- Table 79: Global XRF Sample Cups Revenue million Forecast, by Country 2019 & 2032
- Table 80: Global XRF Sample Cups Volume K Forecast, by Country 2019 & 2032
- Table 81: China XRF Sample Cups Revenue (million) Forecast, by Application 2019 & 2032
- Table 82: China XRF Sample Cups Volume (K) Forecast, by Application 2019 & 2032
- Table 83: India XRF Sample Cups Revenue (million) Forecast, by Application 2019 & 2032
- Table 84: India XRF Sample Cups Volume (K) Forecast, by Application 2019 & 2032
- Table 85: Japan XRF Sample Cups Revenue (million) Forecast, by Application 2019 & 2032
- Table 86: Japan XRF Sample Cups Volume (K) Forecast, by Application 2019 & 2032
- Table 87: South Korea XRF Sample Cups Revenue (million) Forecast, by Application 2019 & 2032
- Table 88: South Korea XRF Sample Cups Volume (K) Forecast, by Application 2019 & 2032
- Table 89: ASEAN XRF Sample Cups Revenue (million) Forecast, by Application 2019 & 2032
- Table 90: ASEAN XRF Sample Cups Volume (K) Forecast, by Application 2019 & 2032
- Table 91: Oceania XRF Sample Cups Revenue (million) Forecast, by Application 2019 & 2032
- Table 92: Oceania XRF Sample Cups Volume (K) Forecast, by Application 2019 & 2032
- Table 93: Rest of Asia Pacific XRF Sample Cups Revenue (million) Forecast, by Application 2019 & 2032
- Table 94: Rest of Asia Pacific XRF Sample Cups Volume (K) Forecast, by Application 2019 & 2032
Frequently Asked Questions
1. What is the projected Compound Annual Growth Rate (CAGR) of the XRF Sample Cups?
The projected CAGR is approximately XX%.
2. Which companies are prominent players in the XRF Sample Cups?
Key companies in the market include Fluxana, Chemplex, SPEX, Hitachi, Portable Spectral Services, SCP Science, Labmix24, XOS.
3. What are the main segments of the XRF Sample Cups?
The market segments include Application, Types.
4. Can you provide details about the market size?
The market size is estimated to be USD XXX million as of 2022.
5. What are some drivers contributing to market growth?
N/A
6. What are the notable trends driving market growth?
N/A
7. Are there any restraints impacting market growth?
N/A
8. Can you provide examples of recent developments in the market?
N/A
9. What pricing options are available for accessing the report?
Pricing options include single-user, multi-user, and enterprise licenses priced at USD 4350.00, USD 6525.00, and USD 8700.00 respectively.
10. Is the market size provided in terms of value or volume?
The market size is provided in terms of value, measured in million and volume, measured in K.
11. Are there any specific market keywords associated with the report?
Yes, the market keyword associated with the report is "XRF Sample Cups," which aids in identifying and referencing the specific market segment covered.
12. How do I determine which pricing option suits my needs best?
The pricing options vary based on user requirements and access needs. Individual users may opt for single-user licenses, while businesses requiring broader access may choose multi-user or enterprise licenses for cost-effective access to the report.
13. Are there any additional resources or data provided in the XRF Sample Cups report?
While the report offers comprehensive insights, it's advisable to review the specific contents or supplementary materials provided to ascertain if additional resources or data are available.
14. How can I stay updated on further developments or reports in the XRF Sample Cups?
To stay informed about further developments, trends, and reports in the XRF Sample Cups, consider subscribing to industry newsletters, following relevant companies and organizations, or regularly checking reputable industry news sources and publications.
Methodology
Step 1 - Identification of Relevant Samples Size from Population Database


Step 2 - Approaches for Defining Global Market Size (Value, Volume* & Price*)

Note*: In applicable scenarios
Step 3 - Data Sources
Primary Research
- Web Analytics
- Survey Reports
- Research Institute
- Latest Research Reports
- Opinion Leaders
Secondary Research
- Annual Reports
- White Paper
- Latest Press Release
- Industry Association
- Paid Database
- Investor Presentations

Step 4 - Data Triangulation
Involves using different sources of information in order to increase the validity of a study
These sources are likely to be stakeholders in a program - participants, other researchers, program staff, other community members, and so on.
Then we put all data in single framework & apply various statistical tools to find out the dynamic on the market.
During the analysis stage, feedback from the stakeholder groups would be compared to determine areas of agreement as well as areas of divergence


