

Key Insights
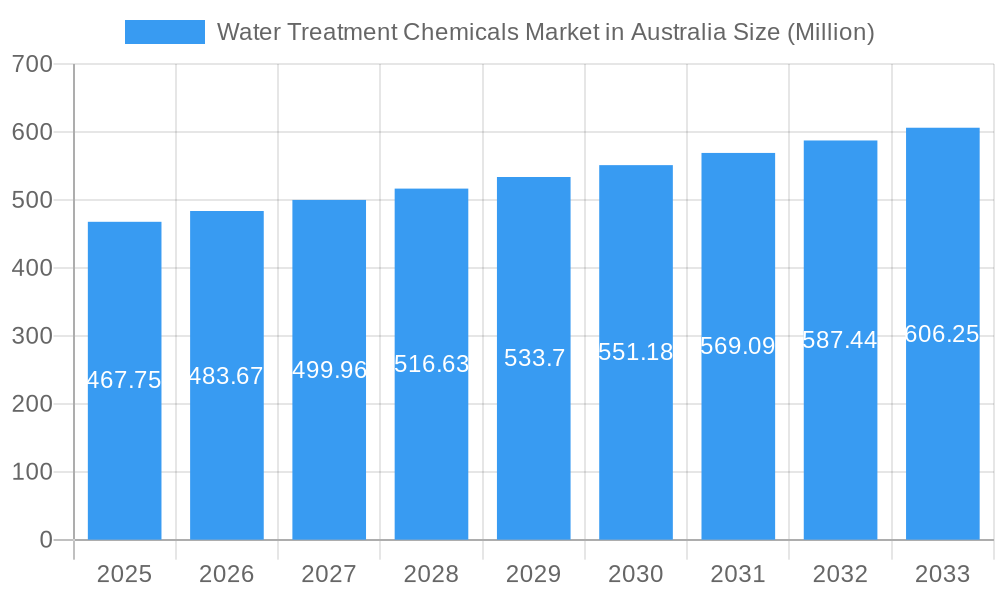
The Australian water treatment chemicals market, valued at $467.75 million in 2025, is projected to experience steady growth, driven by increasing industrialization, stringent environmental regulations, and a growing focus on water conservation. The market's Compound Annual Growth Rate (CAGR) of 3.17% from 2019 to 2024 indicates a consistent demand for effective water treatment solutions. Key market segments include biocides and disinfectants, coagulants and flocculants, and corrosion inhibitors, largely driven by the power generation, mining, and municipal sectors. The robust growth is further fueled by rising concerns regarding waterborne diseases and the need for efficient water purification across diverse industries, including food and beverage processing and pulp and paper manufacturing. Competition is intense, with major players like Kemira Oyj, Ecolab, and SNF vying for market share through technological innovation and strategic partnerships. Growth opportunities lie in the development of sustainable and environmentally friendly water treatment chemicals, tailored solutions for specific industry needs, and expanding into emerging sectors. Challenges include fluctuating raw material prices and the need for continuous technological advancements to meet evolving regulatory requirements. The forecast period of 2025-2033 suggests continued expansion, albeit at a moderate pace, reflecting the ongoing need for water treatment solutions in a growing and increasingly environmentally conscious Australian economy. Future growth will likely be influenced by government investment in water infrastructure and initiatives promoting water resource management.
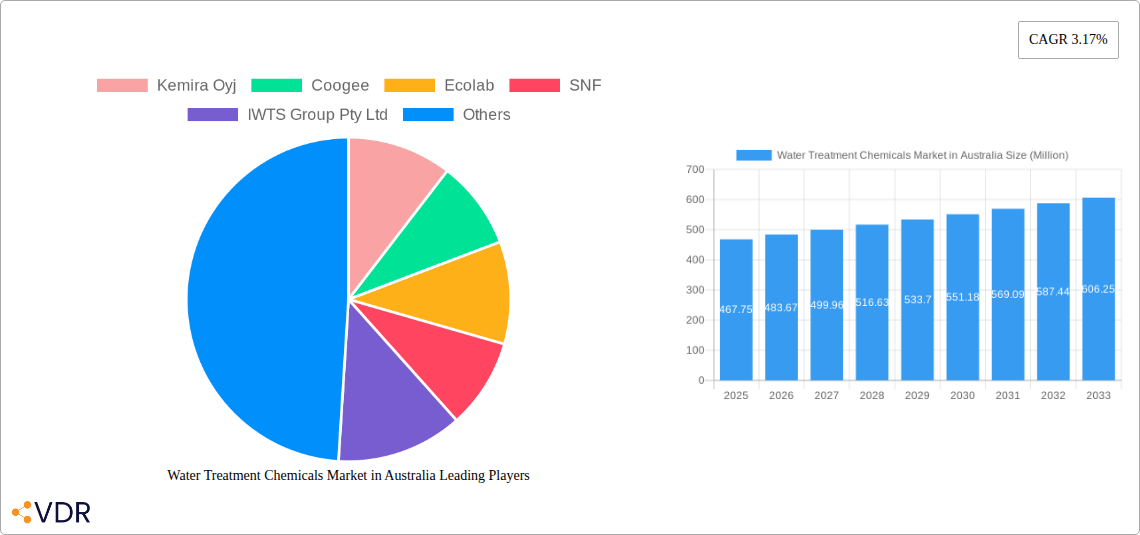
Water Treatment Chemicals Market in Australia Market Size (In Million)
The Australian water treatment chemicals market displays strong potential for further expansion, particularly within the mining and energy sectors which are anticipated to experience continued investment. The market’s segmentation, including product types like biocides and coagulants and end-user industries like power generation and mining, reveals diverse application opportunities. The presence of established international players alongside local businesses highlights the competitiveness of the market and underlines the importance of innovation and strategic partnerships for success. This includes developing specialized solutions for addressing unique water quality challenges faced in diverse Australian environments. Growth will hinge on adapting to evolving regulatory landscapes, leveraging technological advancements, and meeting the demand for sustainable and cost-effective solutions. The market's trajectory is expected to remain positive, reflecting the long-term need for clean and safe water across various sectors in Australia.
Water Treatment Chemicals Market in Australia Company Market Share
Water Treatment Chemicals Market in Australia: A Comprehensive Report (2019-2033)
This in-depth report provides a comprehensive analysis of the Australian water treatment chemicals market, encompassing market dynamics, growth trends, dominant segments, and key players. The study period covers 2019-2033, with 2025 as the base year and a forecast period of 2025-2033. This report is invaluable for industry professionals, investors, and researchers seeking a thorough understanding of this vital sector. The market is segmented by product type (Biocides and Disinfectants, Coagulants and Flocculants, Corrosion and Scale Inhibitors, Defoamers and Defoaming Agents, pH Conditioners/Adjusters, Other Product Types) and end-user industry (Power Generation, Oil and Gas, Chemical Manufacturing, Mining and Mineral Processing, Municipal, Food and Beverage, Pulp and Paper, Other End-user Industries). The total market value in 2025 is estimated at xx Million.
Water Treatment Chemicals Market in Australia Market Dynamics & Structure
The Australian water treatment chemicals market is characterized by moderate concentration, with several multinational and domestic players vying for market share. Technological innovation, driven by stricter environmental regulations and the need for sustainable water management, plays a crucial role. The market faces a dynamic regulatory landscape impacting product approvals and usage. Competitive pressures arise from both established players and new entrants, often offering innovative substitutes. The end-user demographics are diverse, reflecting the country's varied industrial and geographical landscape. M&A activity is relatively frequent, with larger players seeking to expand their product portfolios and market reach.
- Market Concentration: Moderately concentrated, with the top 5 players holding approximately xx% market share in 2025.
- Technological Innovation: Significant investments in advanced treatment technologies like membrane filtration and advanced oxidation processes are driving demand.
- Regulatory Framework: Stringent water quality standards and environmental regulations are influencing product development and adoption.
- Competitive Substitutes: Bio-based and other sustainable alternatives are gaining traction, posing challenges to traditional chemical solutions.
- M&A Trends: A moderate level of mergers and acquisitions, with an estimated xx deals in the last 5 years, reflecting consolidation and expansion strategies.
Water Treatment Chemicals Market in Australia Growth Trends & Insights
The Australian water treatment chemicals market is experiencing steady growth, driven by factors such as increasing industrialization, stricter environmental regulations, and growing urbanization. The market size has shown a CAGR of xx% during the historical period (2019-2024) and is projected to maintain a CAGR of xx% during the forecast period (2025-2033). This growth is further fueled by technological advancements in water treatment technologies and increasing adoption rates across various end-user segments. Consumer behavior is shifting towards environmentally friendly and sustainable solutions, creating new opportunities for eco-friendly chemical alternatives.
Dominant Regions, Countries, or Segments in Water Treatment Chemicals Market in Australia
The Municipal and Industrial segments, particularly Mining and Mineral Processing, Power Generation, and Oil & Gas, are the primary drivers of market growth. New South Wales and Victoria lead in terms of market size and growth, driven by robust industrial activity and stringent water management policies. Within product types, Coagulants and Flocculants, Biocides and Disinfectants hold significant market share due to their widespread applications across various industries.
- Key Growth Drivers:
- Increasing urbanization and industrialization.
- Stringent environmental regulations.
- Rising demand for efficient and sustainable water treatment solutions.
- Government investments in water infrastructure projects.
- Dominant Segments:
- Product Type: Coagulants and Flocculants, Biocides and Disinfectants.
- End-user Industry: Municipal, Mining and Mineral Processing, Power Generation, and Oil & Gas.
- Region: New South Wales and Victoria.
Water Treatment Chemicals Market in Australia Product Landscape
The Australian market witnesses continuous innovation in water treatment chemicals, focusing on enhanced efficacy, sustainability, and reduced environmental impact. New products boast improved performance metrics, such as higher treatment efficiency and reduced sludge generation. Companies are actively developing bio-based and environmentally friendly alternatives to reduce the carbon footprint and enhance the safety of their products. Unique selling propositions often involve specialized formulations catering to niche industry needs.
Key Drivers, Barriers & Challenges in Water Treatment Chemicals Market in Australia
Key Drivers: Stringent water quality regulations, growing industrialization, and increasing demand for sustainable water management solutions.
Key Challenges: Fluctuations in raw material prices, stringent regulatory compliance requirements, and intense competition from both domestic and international players. Supply chain disruptions can also significantly impact market availability and pricing.
Emerging Opportunities in Water Treatment Chemicals Market in Australia
Emerging opportunities lie in the development and adoption of eco-friendly water treatment chemicals, advanced oxidation processes, and specialized solutions for wastewater treatment. Untapped market segments include small-scale industrial water treatment and residential applications. The increasing focus on circular economy principles creates opportunities for resource recovery technologies, especially in treating industrial wastewater.
Growth Accelerators in the Water Treatment Chemicals Market in Australia Industry
Technological advancements, strategic partnerships, and market expansion strategies are key catalysts for long-term growth. The development of innovative, sustainable products and the expansion into new geographic regions and market segments will continue to propel the market forward. Strong government support for water infrastructure projects and investment in R&D will also contribute to market growth.
Key Players Shaping the Water Treatment Chemicals Market in Australia Market
- Kemira Oyj
- Coogee
- Ecolab
- SNF
- IWTS Group Pty Ltd
- Solvay
- Buckman
- Aquasol
- Dow
- Solenis
- Ixom
- Albemarle Corporation
- Veolia (Veolia Water Technologies)
Notable Milestones in Water Treatment Chemicals Market in Australia Sector
- June 2022: Kemira Oyj and Veolia launch ViviMag technology for phosphorus recovery from sewage sludge.
- April 2022: Veolia Group partners with Sydney Water to explore circular economy opportunities in water services.
In-Depth Water Treatment Chemicals Market in Australia Market Outlook
The Australian water treatment chemicals market is poised for significant growth in the coming years, driven by continuous innovation, increasing environmental awareness, and supportive government policies. Strategic partnerships, investments in R&D, and the development of sustainable solutions will further unlock the market's potential. The focus on circular economy principles and resource recovery will create new opportunities for growth and innovation within the sector.
Water Treatment Chemicals Market in Australia Segmentation
-
1. Product Type
- 1.1. Biocides and Disinfectants
- 1.2. Coagulants and Flocculants
- 1.3. Corrosion and Scale Inhibitors
- 1.4. Defoamers and Defoaming Agents
- 1.5. pH Conditioners/Adjusters
- 1.6. Other Product Types
-
2. End-user Industry
- 2.1. Power Generation
- 2.2. Oil and Gas
- 2.3. Chemical Manufacturing
- 2.4. Mining and Mineral Processing
- 2.5. Municipal
- 2.6. Food and Beverage
- 2.7. Pulp and Paper
- 2.8. Other End-user Industries
Water Treatment Chemicals Market in Australia Segmentation By Geography
-
1. North America
- 1.1. United States
- 1.2. Canada
- 1.3. Mexico
-
2. South America
- 2.1. Brazil
- 2.2. Argentina
- 2.3. Rest of South America
-
3. Europe
- 3.1. United Kingdom
- 3.2. Germany
- 3.3. France
- 3.4. Italy
- 3.5. Spain
- 3.6. Russia
- 3.7. Benelux
- 3.8. Nordics
- 3.9. Rest of Europe
-
4. Middle East & Africa
- 4.1. Turkey
- 4.2. Israel
- 4.3. GCC
- 4.4. North Africa
- 4.5. South Africa
- 4.6. Rest of Middle East & Africa
-
5. Asia Pacific
- 5.1. China
- 5.2. India
- 5.3. Japan
- 5.4. South Korea
- 5.5. ASEAN
- 5.6. Oceania
- 5.7. Rest of Asia Pacific
Water Treatment Chemicals Market in Australia Regional Market Share
Geographic Coverage of Water Treatment Chemicals Market in Australia
Water Treatment Chemicals Market in Australia REPORT HIGHLIGHTS
| Aspects | Details |
|---|---|
| Study Period | 2020-2034 |
| Base Year | 2025 |
| Estimated Year | 2026 |
| Forecast Period | 2026-2034 |
| Historical Period | 2020-2025 |
| Growth Rate | CAGR of 3.17% from 2020-2034 |
| Segmentation |
|
Table of Contents
- 1. Introduction
- 1.1. Research Scope
- 1.2. Market Segmentation
- 1.3. Research Objective
- 1.4. Definitions and Assumptions
- 2. Executive Summary
- 2.1. Market Snapshot
- 3. Market Dynamics
- 3.1. Market Drivers
- 3.2. Market Restrains
- 3.3. Market Trends
- 3.4. Market Opportunities
- 4. Market Factor Analysis
- 4.1. Porters Five Forces
- 4.1.1. Bargaining Power of Suppliers
- 4.1.2. Bargaining Power of Buyers
- 4.1.3. Threat of New Entrants
- 4.1.4. Threat of Substitutes
- 4.1.5. Competitive Rivalry
- 4.2. PESTEL analysis
- 4.3. BCG Analysis
- 4.3.1. Stars (High Growth, High Market Share)
- 4.3.2. Cash Cows (Low Growth, High Market Share)
- 4.3.3. Question Mark (High Growth, Low Market Share)
- 4.3.4. Dogs (Low Growth, Low Market Share)
- 4.4. Ansoff Matrix Analysis
- 4.5. Supply Chain Analysis
- 4.6. Regulatory Landscape
- 4.7. Current Market Potential and Opportunity Assessment (TAM–SAM–SOM Framework)
- 4.8. VDR Analyst Note
- 4.1. Porters Five Forces
- 5. Market Analysis, Insights and Forecast 2021-2033
- 5.1. Market Analysis, Insights and Forecast - by Product Type
- 5.1.1. Biocides and Disinfectants
- 5.1.2. Coagulants and Flocculants
- 5.1.3. Corrosion and Scale Inhibitors
- 5.1.4. Defoamers and Defoaming Agents
- 5.1.5. pH Conditioners/Adjusters
- 5.1.6. Other Product Types
- 5.2. Market Analysis, Insights and Forecast - by End-user Industry
- 5.2.1. Power Generation
- 5.2.2. Oil and Gas
- 5.2.3. Chemical Manufacturing
- 5.2.4. Mining and Mineral Processing
- 5.2.5. Municipal
- 5.2.6. Food and Beverage
- 5.2.7. Pulp and Paper
- 5.2.8. Other End-user Industries
- 5.3. Market Analysis, Insights and Forecast - by Region
- 5.3.1. North America
- 5.3.2. South America
- 5.3.3. Europe
- 5.3.4. Middle East & Africa
- 5.3.5. Asia Pacific
- 5.1. Market Analysis, Insights and Forecast - by Product Type
- 6. Global Water Treatment Chemicals Market in Australia Analysis, Insights and Forecast, 2021-2033
- 6.1. Market Analysis, Insights and Forecast - by Product Type
- 6.1.1. Biocides and Disinfectants
- 6.1.2. Coagulants and Flocculants
- 6.1.3. Corrosion and Scale Inhibitors
- 6.1.4. Defoamers and Defoaming Agents
- 6.1.5. pH Conditioners/Adjusters
- 6.1.6. Other Product Types
- 6.2. Market Analysis, Insights and Forecast - by End-user Industry
- 6.2.1. Power Generation
- 6.2.2. Oil and Gas
- 6.2.3. Chemical Manufacturing
- 6.2.4. Mining and Mineral Processing
- 6.2.5. Municipal
- 6.2.6. Food and Beverage
- 6.2.7. Pulp and Paper
- 6.2.8. Other End-user Industries
- 6.1. Market Analysis, Insights and Forecast - by Product Type
- 7. North America Water Treatment Chemicals Market in Australia Analysis, Insights and Forecast, 2021-2033
- 7.1. Market Analysis, Insights and Forecast - by Product Type
- 7.1.1. Biocides and Disinfectants
- 7.1.2. Coagulants and Flocculants
- 7.1.3. Corrosion and Scale Inhibitors
- 7.1.4. Defoamers and Defoaming Agents
- 7.1.5. pH Conditioners/Adjusters
- 7.1.6. Other Product Types
- 7.2. Market Analysis, Insights and Forecast - by End-user Industry
- 7.2.1. Power Generation
- 7.2.2. Oil and Gas
- 7.2.3. Chemical Manufacturing
- 7.2.4. Mining and Mineral Processing
- 7.2.5. Municipal
- 7.2.6. Food and Beverage
- 7.2.7. Pulp and Paper
- 7.2.8. Other End-user Industries
- 7.1. Market Analysis, Insights and Forecast - by Product Type
- 8. South America Water Treatment Chemicals Market in Australia Analysis, Insights and Forecast, 2021-2033
- 8.1. Market Analysis, Insights and Forecast - by Product Type
- 8.1.1. Biocides and Disinfectants
- 8.1.2. Coagulants and Flocculants
- 8.1.3. Corrosion and Scale Inhibitors
- 8.1.4. Defoamers and Defoaming Agents
- 8.1.5. pH Conditioners/Adjusters
- 8.1.6. Other Product Types
- 8.2. Market Analysis, Insights and Forecast - by End-user Industry
- 8.2.1. Power Generation
- 8.2.2. Oil and Gas
- 8.2.3. Chemical Manufacturing
- 8.2.4. Mining and Mineral Processing
- 8.2.5. Municipal
- 8.2.6. Food and Beverage
- 8.2.7. Pulp and Paper
- 8.2.8. Other End-user Industries
- 8.1. Market Analysis, Insights and Forecast - by Product Type
- 9. Europe Water Treatment Chemicals Market in Australia Analysis, Insights and Forecast, 2021-2033
- 9.1. Market Analysis, Insights and Forecast - by Product Type
- 9.1.1. Biocides and Disinfectants
- 9.1.2. Coagulants and Flocculants
- 9.1.3. Corrosion and Scale Inhibitors
- 9.1.4. Defoamers and Defoaming Agents
- 9.1.5. pH Conditioners/Adjusters
- 9.1.6. Other Product Types
- 9.2. Market Analysis, Insights and Forecast - by End-user Industry
- 9.2.1. Power Generation
- 9.2.2. Oil and Gas
- 9.2.3. Chemical Manufacturing
- 9.2.4. Mining and Mineral Processing
- 9.2.5. Municipal
- 9.2.6. Food and Beverage
- 9.2.7. Pulp and Paper
- 9.2.8. Other End-user Industries
- 9.1. Market Analysis, Insights and Forecast - by Product Type
- 10. Middle East & Africa Water Treatment Chemicals Market in Australia Analysis, Insights and Forecast, 2021-2033
- 10.1. Market Analysis, Insights and Forecast - by Product Type
- 10.1.1. Biocides and Disinfectants
- 10.1.2. Coagulants and Flocculants
- 10.1.3. Corrosion and Scale Inhibitors
- 10.1.4. Defoamers and Defoaming Agents
- 10.1.5. pH Conditioners/Adjusters
- 10.1.6. Other Product Types
- 10.2. Market Analysis, Insights and Forecast - by End-user Industry
- 10.2.1. Power Generation
- 10.2.2. Oil and Gas
- 10.2.3. Chemical Manufacturing
- 10.2.4. Mining and Mineral Processing
- 10.2.5. Municipal
- 10.2.6. Food and Beverage
- 10.2.7. Pulp and Paper
- 10.2.8. Other End-user Industries
- 10.1. Market Analysis, Insights and Forecast - by Product Type
- 11. Asia Pacific Water Treatment Chemicals Market in Australia Analysis, Insights and Forecast, 2021-2033
- 11.1. Market Analysis, Insights and Forecast - by Product Type
- 11.1.1. Biocides and Disinfectants
- 11.1.2. Coagulants and Flocculants
- 11.1.3. Corrosion and Scale Inhibitors
- 11.1.4. Defoamers and Defoaming Agents
- 11.1.5. pH Conditioners/Adjusters
- 11.1.6. Other Product Types
- 11.2. Market Analysis, Insights and Forecast - by End-user Industry
- 11.2.1. Power Generation
- 11.2.2. Oil and Gas
- 11.2.3. Chemical Manufacturing
- 11.2.4. Mining and Mineral Processing
- 11.2.5. Municipal
- 11.2.6. Food and Beverage
- 11.2.7. Pulp and Paper
- 11.2.8. Other End-user Industries
- 11.1. Market Analysis, Insights and Forecast - by Product Type
- 12. Competitive Analysis
- 12.1. Company Profiles
- 12.1.1 Kemira Oyj
- 12.1.1.1. Company Overview
- 12.1.1.2. Products
- 12.1.1.3. Company Financials
- 12.1.1.4. SWOT Analysis
- 12.1.2 Coogee
- 12.1.2.1. Company Overview
- 12.1.2.2. Products
- 12.1.2.3. Company Financials
- 12.1.2.4. SWOT Analysis
- 12.1.3 Ecolab
- 12.1.3.1. Company Overview
- 12.1.3.2. Products
- 12.1.3.3. Company Financials
- 12.1.3.4. SWOT Analysis
- 12.1.4 SNF
- 12.1.4.1. Company Overview
- 12.1.4.2. Products
- 12.1.4.3. Company Financials
- 12.1.4.4. SWOT Analysis
- 12.1.5 IWTS Group Pty Ltd
- 12.1.5.1. Company Overview
- 12.1.5.2. Products
- 12.1.5.3. Company Financials
- 12.1.5.4. SWOT Analysis
- 12.1.6 Solvay
- 12.1.6.1. Company Overview
- 12.1.6.2. Products
- 12.1.6.3. Company Financials
- 12.1.6.4. SWOT Analysis
- 12.1.7 Buckman
- 12.1.7.1. Company Overview
- 12.1.7.2. Products
- 12.1.7.3. Company Financials
- 12.1.7.4. SWOT Analysis
- 12.1.8 Aquasol
- 12.1.8.1. Company Overview
- 12.1.8.2. Products
- 12.1.8.3. Company Financials
- 12.1.8.4. SWOT Analysis
- 12.1.9 Dow
- 12.1.9.1. Company Overview
- 12.1.9.2. Products
- 12.1.9.3. Company Financials
- 12.1.9.4. SWOT Analysis
- 12.1.10 Solenis
- 12.1.10.1. Company Overview
- 12.1.10.2. Products
- 12.1.10.3. Company Financials
- 12.1.10.4. SWOT Analysis
- 12.1.11 Ixom
- 12.1.11.1. Company Overview
- 12.1.11.2. Products
- 12.1.11.3. Company Financials
- 12.1.11.4. SWOT Analysis
- 12.1.12 Albemarle Corporation
- 12.1.12.1. Company Overview
- 12.1.12.2. Products
- 12.1.12.3. Company Financials
- 12.1.12.4. SWOT Analysis
- 12.1.13 Veolia (Veolia Water Technologies)
- 12.1.13.1. Company Overview
- 12.1.13.2. Products
- 12.1.13.3. Company Financials
- 12.1.13.4. SWOT Analysis
- 12.1.1 Kemira Oyj
- 12.2. Market Entropy
- 12.2.1 Company's Key Areas Served
- 12.2.2 Recent Developments
- 12.3. Company Market Share Analysis 2025
- 12.3.1 Top 5 Companies Market Share Analysis
- 12.3.2 Top 3 Companies Market Share Analysis
- 12.4. List of Potential Customers
- 13. Research Methodology
List of Figures
- Figure 1: Global Water Treatment Chemicals Market in Australia Revenue Breakdown (Million, %) by Region 2025 & 2033
- Figure 2: Global Water Treatment Chemicals Market in Australia Volume Breakdown (K Tons, %) by Region 2025 & 2033
- Figure 3: North America Water Treatment Chemicals Market in Australia Revenue (Million), by Product Type 2025 & 2033
- Figure 4: North America Water Treatment Chemicals Market in Australia Volume (K Tons), by Product Type 2025 & 2033
- Figure 5: North America Water Treatment Chemicals Market in Australia Revenue Share (%), by Product Type 2025 & 2033
- Figure 6: North America Water Treatment Chemicals Market in Australia Volume Share (%), by Product Type 2025 & 2033
- Figure 7: North America Water Treatment Chemicals Market in Australia Revenue (Million), by End-user Industry 2025 & 2033
- Figure 8: North America Water Treatment Chemicals Market in Australia Volume (K Tons), by End-user Industry 2025 & 2033
- Figure 9: North America Water Treatment Chemicals Market in Australia Revenue Share (%), by End-user Industry 2025 & 2033
- Figure 10: North America Water Treatment Chemicals Market in Australia Volume Share (%), by End-user Industry 2025 & 2033
- Figure 11: North America Water Treatment Chemicals Market in Australia Revenue (Million), by Country 2025 & 2033
- Figure 12: North America Water Treatment Chemicals Market in Australia Volume (K Tons), by Country 2025 & 2033
- Figure 13: North America Water Treatment Chemicals Market in Australia Revenue Share (%), by Country 2025 & 2033
- Figure 14: North America Water Treatment Chemicals Market in Australia Volume Share (%), by Country 2025 & 2033
- Figure 15: South America Water Treatment Chemicals Market in Australia Revenue (Million), by Product Type 2025 & 2033
- Figure 16: South America Water Treatment Chemicals Market in Australia Volume (K Tons), by Product Type 2025 & 2033
- Figure 17: South America Water Treatment Chemicals Market in Australia Revenue Share (%), by Product Type 2025 & 2033
- Figure 18: South America Water Treatment Chemicals Market in Australia Volume Share (%), by Product Type 2025 & 2033
- Figure 19: South America Water Treatment Chemicals Market in Australia Revenue (Million), by End-user Industry 2025 & 2033
- Figure 20: South America Water Treatment Chemicals Market in Australia Volume (K Tons), by End-user Industry 2025 & 2033
- Figure 21: South America Water Treatment Chemicals Market in Australia Revenue Share (%), by End-user Industry 2025 & 2033
- Figure 22: South America Water Treatment Chemicals Market in Australia Volume Share (%), by End-user Industry 2025 & 2033
- Figure 23: South America Water Treatment Chemicals Market in Australia Revenue (Million), by Country 2025 & 2033
- Figure 24: South America Water Treatment Chemicals Market in Australia Volume (K Tons), by Country 2025 & 2033
- Figure 25: South America Water Treatment Chemicals Market in Australia Revenue Share (%), by Country 2025 & 2033
- Figure 26: South America Water Treatment Chemicals Market in Australia Volume Share (%), by Country 2025 & 2033
- Figure 27: Europe Water Treatment Chemicals Market in Australia Revenue (Million), by Product Type 2025 & 2033
- Figure 28: Europe Water Treatment Chemicals Market in Australia Volume (K Tons), by Product Type 2025 & 2033
- Figure 29: Europe Water Treatment Chemicals Market in Australia Revenue Share (%), by Product Type 2025 & 2033
- Figure 30: Europe Water Treatment Chemicals Market in Australia Volume Share (%), by Product Type 2025 & 2033
- Figure 31: Europe Water Treatment Chemicals Market in Australia Revenue (Million), by End-user Industry 2025 & 2033
- Figure 32: Europe Water Treatment Chemicals Market in Australia Volume (K Tons), by End-user Industry 2025 & 2033
- Figure 33: Europe Water Treatment Chemicals Market in Australia Revenue Share (%), by End-user Industry 2025 & 2033
- Figure 34: Europe Water Treatment Chemicals Market in Australia Volume Share (%), by End-user Industry 2025 & 2033
- Figure 35: Europe Water Treatment Chemicals Market in Australia Revenue (Million), by Country 2025 & 2033
- Figure 36: Europe Water Treatment Chemicals Market in Australia Volume (K Tons), by Country 2025 & 2033
- Figure 37: Europe Water Treatment Chemicals Market in Australia Revenue Share (%), by Country 2025 & 2033
- Figure 38: Europe Water Treatment Chemicals Market in Australia Volume Share (%), by Country 2025 & 2033
- Figure 39: Middle East & Africa Water Treatment Chemicals Market in Australia Revenue (Million), by Product Type 2025 & 2033
- Figure 40: Middle East & Africa Water Treatment Chemicals Market in Australia Volume (K Tons), by Product Type 2025 & 2033
- Figure 41: Middle East & Africa Water Treatment Chemicals Market in Australia Revenue Share (%), by Product Type 2025 & 2033
- Figure 42: Middle East & Africa Water Treatment Chemicals Market in Australia Volume Share (%), by Product Type 2025 & 2033
- Figure 43: Middle East & Africa Water Treatment Chemicals Market in Australia Revenue (Million), by End-user Industry 2025 & 2033
- Figure 44: Middle East & Africa Water Treatment Chemicals Market in Australia Volume (K Tons), by End-user Industry 2025 & 2033
- Figure 45: Middle East & Africa Water Treatment Chemicals Market in Australia Revenue Share (%), by End-user Industry 2025 & 2033
- Figure 46: Middle East & Africa Water Treatment Chemicals Market in Australia Volume Share (%), by End-user Industry 2025 & 2033
- Figure 47: Middle East & Africa Water Treatment Chemicals Market in Australia Revenue (Million), by Country 2025 & 2033
- Figure 48: Middle East & Africa Water Treatment Chemicals Market in Australia Volume (K Tons), by Country 2025 & 2033
- Figure 49: Middle East & Africa Water Treatment Chemicals Market in Australia Revenue Share (%), by Country 2025 & 2033
- Figure 50: Middle East & Africa Water Treatment Chemicals Market in Australia Volume Share (%), by Country 2025 & 2033
- Figure 51: Asia Pacific Water Treatment Chemicals Market in Australia Revenue (Million), by Product Type 2025 & 2033
- Figure 52: Asia Pacific Water Treatment Chemicals Market in Australia Volume (K Tons), by Product Type 2025 & 2033
- Figure 53: Asia Pacific Water Treatment Chemicals Market in Australia Revenue Share (%), by Product Type 2025 & 2033
- Figure 54: Asia Pacific Water Treatment Chemicals Market in Australia Volume Share (%), by Product Type 2025 & 2033
- Figure 55: Asia Pacific Water Treatment Chemicals Market in Australia Revenue (Million), by End-user Industry 2025 & 2033
- Figure 56: Asia Pacific Water Treatment Chemicals Market in Australia Volume (K Tons), by End-user Industry 2025 & 2033
- Figure 57: Asia Pacific Water Treatment Chemicals Market in Australia Revenue Share (%), by End-user Industry 2025 & 2033
- Figure 58: Asia Pacific Water Treatment Chemicals Market in Australia Volume Share (%), by End-user Industry 2025 & 2033
- Figure 59: Asia Pacific Water Treatment Chemicals Market in Australia Revenue (Million), by Country 2025 & 2033
- Figure 60: Asia Pacific Water Treatment Chemicals Market in Australia Volume (K Tons), by Country 2025 & 2033
- Figure 61: Asia Pacific Water Treatment Chemicals Market in Australia Revenue Share (%), by Country 2025 & 2033
- Figure 62: Asia Pacific Water Treatment Chemicals Market in Australia Volume Share (%), by Country 2025 & 2033
List of Tables
- Table 1: Global Water Treatment Chemicals Market in Australia Revenue Million Forecast, by Product Type 2020 & 2033
- Table 2: Global Water Treatment Chemicals Market in Australia Volume K Tons Forecast, by Product Type 2020 & 2033
- Table 3: Global Water Treatment Chemicals Market in Australia Revenue Million Forecast, by End-user Industry 2020 & 2033
- Table 4: Global Water Treatment Chemicals Market in Australia Volume K Tons Forecast, by End-user Industry 2020 & 2033
- Table 5: Global Water Treatment Chemicals Market in Australia Revenue Million Forecast, by Region 2020 & 2033
- Table 6: Global Water Treatment Chemicals Market in Australia Volume K Tons Forecast, by Region 2020 & 2033
- Table 7: Global Water Treatment Chemicals Market in Australia Revenue Million Forecast, by Product Type 2020 & 2033
- Table 8: Global Water Treatment Chemicals Market in Australia Volume K Tons Forecast, by Product Type 2020 & 2033
- Table 9: Global Water Treatment Chemicals Market in Australia Revenue Million Forecast, by End-user Industry 2020 & 2033
- Table 10: Global Water Treatment Chemicals Market in Australia Volume K Tons Forecast, by End-user Industry 2020 & 2033
- Table 11: Global Water Treatment Chemicals Market in Australia Revenue Million Forecast, by Country 2020 & 2033
- Table 12: Global Water Treatment Chemicals Market in Australia Volume K Tons Forecast, by Country 2020 & 2033
- Table 13: United States Water Treatment Chemicals Market in Australia Revenue (Million) Forecast, by Application 2020 & 2033
- Table 14: United States Water Treatment Chemicals Market in Australia Volume (K Tons) Forecast, by Application 2020 & 2033
- Table 15: Canada Water Treatment Chemicals Market in Australia Revenue (Million) Forecast, by Application 2020 & 2033
- Table 16: Canada Water Treatment Chemicals Market in Australia Volume (K Tons) Forecast, by Application 2020 & 2033
- Table 17: Mexico Water Treatment Chemicals Market in Australia Revenue (Million) Forecast, by Application 2020 & 2033
- Table 18: Mexico Water Treatment Chemicals Market in Australia Volume (K Tons) Forecast, by Application 2020 & 2033
- Table 19: Global Water Treatment Chemicals Market in Australia Revenue Million Forecast, by Product Type 2020 & 2033
- Table 20: Global Water Treatment Chemicals Market in Australia Volume K Tons Forecast, by Product Type 2020 & 2033
- Table 21: Global Water Treatment Chemicals Market in Australia Revenue Million Forecast, by End-user Industry 2020 & 2033
- Table 22: Global Water Treatment Chemicals Market in Australia Volume K Tons Forecast, by End-user Industry 2020 & 2033
- Table 23: Global Water Treatment Chemicals Market in Australia Revenue Million Forecast, by Country 2020 & 2033
- Table 24: Global Water Treatment Chemicals Market in Australia Volume K Tons Forecast, by Country 2020 & 2033
- Table 25: Brazil Water Treatment Chemicals Market in Australia Revenue (Million) Forecast, by Application 2020 & 2033
- Table 26: Brazil Water Treatment Chemicals Market in Australia Volume (K Tons) Forecast, by Application 2020 & 2033
- Table 27: Argentina Water Treatment Chemicals Market in Australia Revenue (Million) Forecast, by Application 2020 & 2033
- Table 28: Argentina Water Treatment Chemicals Market in Australia Volume (K Tons) Forecast, by Application 2020 & 2033
- Table 29: Rest of South America Water Treatment Chemicals Market in Australia Revenue (Million) Forecast, by Application 2020 & 2033
- Table 30: Rest of South America Water Treatment Chemicals Market in Australia Volume (K Tons) Forecast, by Application 2020 & 2033
- Table 31: Global Water Treatment Chemicals Market in Australia Revenue Million Forecast, by Product Type 2020 & 2033
- Table 32: Global Water Treatment Chemicals Market in Australia Volume K Tons Forecast, by Product Type 2020 & 2033
- Table 33: Global Water Treatment Chemicals Market in Australia Revenue Million Forecast, by End-user Industry 2020 & 2033
- Table 34: Global Water Treatment Chemicals Market in Australia Volume K Tons Forecast, by End-user Industry 2020 & 2033
- Table 35: Global Water Treatment Chemicals Market in Australia Revenue Million Forecast, by Country 2020 & 2033
- Table 36: Global Water Treatment Chemicals Market in Australia Volume K Tons Forecast, by Country 2020 & 2033
- Table 37: United Kingdom Water Treatment Chemicals Market in Australia Revenue (Million) Forecast, by Application 2020 & 2033
- Table 38: United Kingdom Water Treatment Chemicals Market in Australia Volume (K Tons) Forecast, by Application 2020 & 2033
- Table 39: Germany Water Treatment Chemicals Market in Australia Revenue (Million) Forecast, by Application 2020 & 2033
- Table 40: Germany Water Treatment Chemicals Market in Australia Volume (K Tons) Forecast, by Application 2020 & 2033
- Table 41: France Water Treatment Chemicals Market in Australia Revenue (Million) Forecast, by Application 2020 & 2033
- Table 42: France Water Treatment Chemicals Market in Australia Volume (K Tons) Forecast, by Application 2020 & 2033
- Table 43: Italy Water Treatment Chemicals Market in Australia Revenue (Million) Forecast, by Application 2020 & 2033
- Table 44: Italy Water Treatment Chemicals Market in Australia Volume (K Tons) Forecast, by Application 2020 & 2033
- Table 45: Spain Water Treatment Chemicals Market in Australia Revenue (Million) Forecast, by Application 2020 & 2033
- Table 46: Spain Water Treatment Chemicals Market in Australia Volume (K Tons) Forecast, by Application 2020 & 2033
- Table 47: Russia Water Treatment Chemicals Market in Australia Revenue (Million) Forecast, by Application 2020 & 2033
- Table 48: Russia Water Treatment Chemicals Market in Australia Volume (K Tons) Forecast, by Application 2020 & 2033
- Table 49: Benelux Water Treatment Chemicals Market in Australia Revenue (Million) Forecast, by Application 2020 & 2033
- Table 50: Benelux Water Treatment Chemicals Market in Australia Volume (K Tons) Forecast, by Application 2020 & 2033
- Table 51: Nordics Water Treatment Chemicals Market in Australia Revenue (Million) Forecast, by Application 2020 & 2033
- Table 52: Nordics Water Treatment Chemicals Market in Australia Volume (K Tons) Forecast, by Application 2020 & 2033
- Table 53: Rest of Europe Water Treatment Chemicals Market in Australia Revenue (Million) Forecast, by Application 2020 & 2033
- Table 54: Rest of Europe Water Treatment Chemicals Market in Australia Volume (K Tons) Forecast, by Application 2020 & 2033
- Table 55: Global Water Treatment Chemicals Market in Australia Revenue Million Forecast, by Product Type 2020 & 2033
- Table 56: Global Water Treatment Chemicals Market in Australia Volume K Tons Forecast, by Product Type 2020 & 2033
- Table 57: Global Water Treatment Chemicals Market in Australia Revenue Million Forecast, by End-user Industry 2020 & 2033
- Table 58: Global Water Treatment Chemicals Market in Australia Volume K Tons Forecast, by End-user Industry 2020 & 2033
- Table 59: Global Water Treatment Chemicals Market in Australia Revenue Million Forecast, by Country 2020 & 2033
- Table 60: Global Water Treatment Chemicals Market in Australia Volume K Tons Forecast, by Country 2020 & 2033
- Table 61: Turkey Water Treatment Chemicals Market in Australia Revenue (Million) Forecast, by Application 2020 & 2033
- Table 62: Turkey Water Treatment Chemicals Market in Australia Volume (K Tons) Forecast, by Application 2020 & 2033
- Table 63: Israel Water Treatment Chemicals Market in Australia Revenue (Million) Forecast, by Application 2020 & 2033
- Table 64: Israel Water Treatment Chemicals Market in Australia Volume (K Tons) Forecast, by Application 2020 & 2033
- Table 65: GCC Water Treatment Chemicals Market in Australia Revenue (Million) Forecast, by Application 2020 & 2033
- Table 66: GCC Water Treatment Chemicals Market in Australia Volume (K Tons) Forecast, by Application 2020 & 2033
- Table 67: North Africa Water Treatment Chemicals Market in Australia Revenue (Million) Forecast, by Application 2020 & 2033
- Table 68: North Africa Water Treatment Chemicals Market in Australia Volume (K Tons) Forecast, by Application 2020 & 2033
- Table 69: South Africa Water Treatment Chemicals Market in Australia Revenue (Million) Forecast, by Application 2020 & 2033
- Table 70: South Africa Water Treatment Chemicals Market in Australia Volume (K Tons) Forecast, by Application 2020 & 2033
- Table 71: Rest of Middle East & Africa Water Treatment Chemicals Market in Australia Revenue (Million) Forecast, by Application 2020 & 2033
- Table 72: Rest of Middle East & Africa Water Treatment Chemicals Market in Australia Volume (K Tons) Forecast, by Application 2020 & 2033
- Table 73: Global Water Treatment Chemicals Market in Australia Revenue Million Forecast, by Product Type 2020 & 2033
- Table 74: Global Water Treatment Chemicals Market in Australia Volume K Tons Forecast, by Product Type 2020 & 2033
- Table 75: Global Water Treatment Chemicals Market in Australia Revenue Million Forecast, by End-user Industry 2020 & 2033
- Table 76: Global Water Treatment Chemicals Market in Australia Volume K Tons Forecast, by End-user Industry 2020 & 2033
- Table 77: Global Water Treatment Chemicals Market in Australia Revenue Million Forecast, by Country 2020 & 2033
- Table 78: Global Water Treatment Chemicals Market in Australia Volume K Tons Forecast, by Country 2020 & 2033
- Table 79: China Water Treatment Chemicals Market in Australia Revenue (Million) Forecast, by Application 2020 & 2033
- Table 80: China Water Treatment Chemicals Market in Australia Volume (K Tons) Forecast, by Application 2020 & 2033
- Table 81: India Water Treatment Chemicals Market in Australia Revenue (Million) Forecast, by Application 2020 & 2033
- Table 82: India Water Treatment Chemicals Market in Australia Volume (K Tons) Forecast, by Application 2020 & 2033
- Table 83: Japan Water Treatment Chemicals Market in Australia Revenue (Million) Forecast, by Application 2020 & 2033
- Table 84: Japan Water Treatment Chemicals Market in Australia Volume (K Tons) Forecast, by Application 2020 & 2033
- Table 85: South Korea Water Treatment Chemicals Market in Australia Revenue (Million) Forecast, by Application 2020 & 2033
- Table 86: South Korea Water Treatment Chemicals Market in Australia Volume (K Tons) Forecast, by Application 2020 & 2033
- Table 87: ASEAN Water Treatment Chemicals Market in Australia Revenue (Million) Forecast, by Application 2020 & 2033
- Table 88: ASEAN Water Treatment Chemicals Market in Australia Volume (K Tons) Forecast, by Application 2020 & 2033
- Table 89: Oceania Water Treatment Chemicals Market in Australia Revenue (Million) Forecast, by Application 2020 & 2033
- Table 90: Oceania Water Treatment Chemicals Market in Australia Volume (K Tons) Forecast, by Application 2020 & 2033
- Table 91: Rest of Asia Pacific Water Treatment Chemicals Market in Australia Revenue (Million) Forecast, by Application 2020 & 2033
- Table 92: Rest of Asia Pacific Water Treatment Chemicals Market in Australia Volume (K Tons) Forecast, by Application 2020 & 2033
Frequently Asked Questions
1. What is the projected Compound Annual Growth Rate (CAGR) of the Water Treatment Chemicals Market in Australia?
The projected CAGR is approximately 3.17%.
2. Which companies are prominent players in the Water Treatment Chemicals Market in Australia?
Key companies in the market include Kemira Oyj, Coogee, Ecolab, SNF, IWTS Group Pty Ltd, Solvay, Buckman, Aquasol, Dow, Solenis, Ixom, Albemarle Corporation, Veolia (Veolia Water Technologies).
3. What are the main segments of the Water Treatment Chemicals Market in Australia?
The market segments include Product Type, End-user Industry.
4. Can you provide details about the market size?
The market size is estimated to be USD 467.75 Million as of 2022.
5. What are some drivers contributing to market growth?
Rising Groundwater and Surface Water Pollution; Growing Demand From Power and Industrial Applications; Increasing Government Intervention in Reliable Wastewater Management.
6. What are the notable trends driving market growth?
Municipal End-user Industry to Dominate the Market.
7. Are there any restraints impacting market growth?
Hazardous Nature of Hydrazine; Emerging Alternatives to Water Treatment Chemicals.
8. Can you provide examples of recent developments in the market?
In June 2022, Kemira Oyj announced a new collaboration with a France-based company, Veolia, to launch a new technology named ViviMag. This technology can recover phosphorus and other valuable resources, such as iron, from sewage sludge. Phosphorus causes the overfertilization of the surface waters if not removed properly, causing a major environmental problem. This new technology will help Kemira OYJ strengthen its position in the water treatment sector.
9. What pricing options are available for accessing the report?
Pricing options include single-user, multi-user, and enterprise licenses priced at USD 3,950, USD 4,950, and USD 6,950 respectively.
10. Is the market size provided in terms of value or volume?
The market size is provided in terms of value, measured in Million and volume, measured in K Tons.
11. Are there any specific market keywords associated with the report?
Yes, the market keyword associated with the report is "Water Treatment Chemicals Market in Australia," which aids in identifying and referencing the specific market segment covered.
12. How do I determine which pricing option suits my needs best?
The pricing options vary based on user requirements and access needs. Individual users may opt for single-user licenses, while businesses requiring broader access may choose multi-user or enterprise licenses for cost-effective access to the report.
13. Are there any additional resources or data provided in the Water Treatment Chemicals Market in Australia report?
While the report offers comprehensive insights, it's advisable to review the specific contents or supplementary materials provided to ascertain if additional resources or data are available.
14. How can I stay updated on further developments or reports in the Water Treatment Chemicals Market in Australia?
To stay informed about further developments, trends, and reports in the Water Treatment Chemicals Market in Australia, consider subscribing to industry newsletters, following relevant companies and organizations, or regularly checking reputable industry news sources and publications.
Methodology
Step 1 - Identification of Relevant Samples Size from Population Database


Step 2 - Approaches for Defining Global Market Size (Value, Volume* & Price*)

Note*: In applicable scenarios
Step 3 - Data Sources
Primary Research
- Web Analytics
- Survey Reports
- Research Institute
- Latest Research Reports
- Opinion Leaders
Secondary Research
- Annual Reports
- White Paper
- Latest Press Release
- Industry Association
- Paid Database
- Investor Presentations

Step 4 - Data Triangulation
Involves using different sources of information in order to increase the validity of a study
These sources are likely to be stakeholders in a program - participants, other researchers, program staff, other community members, and so on.
Then we put all data in single framework & apply various statistical tools to find out the dynamic on the market.
During the analysis stage, feedback from the stakeholder groups would be compared to determine areas of agreement as well as areas of divergence