

Key Insights
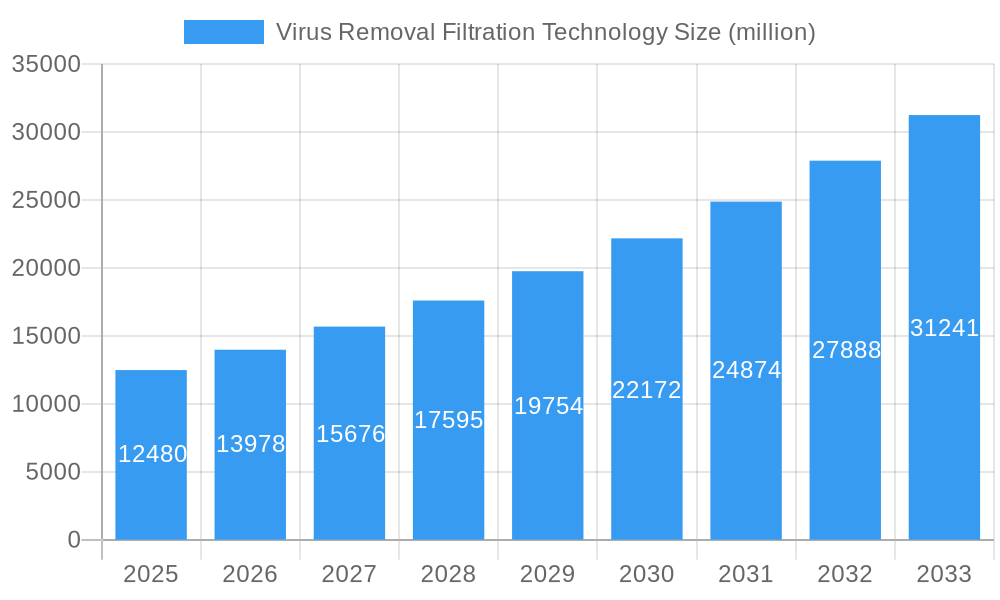
The virus removal filtration technology market, valued at $12,480 million in 2025, is projected to experience robust growth, driven by increasing concerns over viral outbreaks and the rising demand for safe and efficient filtration solutions in various sectors. The compound annual growth rate (CAGR) of 12% from 2025 to 2033 indicates a significant expansion, fueled by advancements in filtration technologies, stricter regulatory frameworks for water and air purification, and the escalating need for effective virus removal in pharmaceutical manufacturing and healthcare settings. Key drivers include the growing adoption of advanced filtration techniques like ultrafiltration, microfiltration, and nanofiltration, alongside the development of novel filter materials with enhanced virus removal capabilities. The market is segmented by technology type (e.g., membrane filtration, depth filtration), application (pharmaceutical, water treatment, air purification), and end-user (hospitals, research labs, industrial facilities). Competition is intense, with established players like Merck, Sartorius, and Cytiva alongside emerging innovative companies like TeraPore Technologies and LePure Biotech vying for market share through technological advancements and strategic partnerships. The market’s growth will likely be influenced by factors such as the fluctuating price of raw materials and the level of government investment in public health infrastructure.
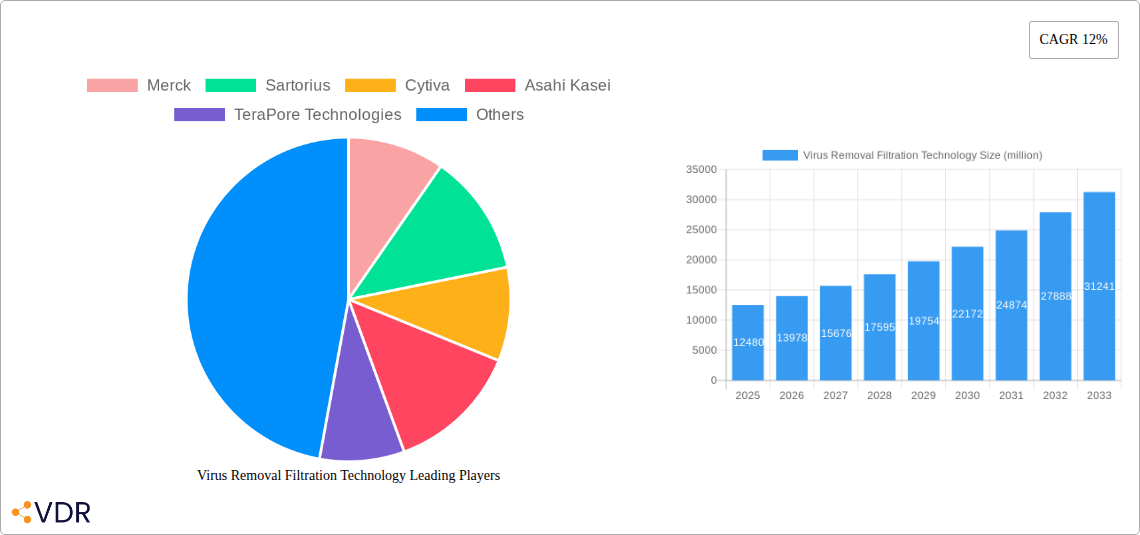
Virus Removal Filtration Technology Market Size (In Billion)
The forecast period (2025-2033) anticipates continued market expansion, with a notable increase in demand from developing economies due to rising disposable incomes and increasing awareness of hygiene standards. However, potential restraints include the high initial investment costs associated with advanced filtration systems and the need for skilled personnel to operate and maintain them. To mitigate these challenges, several companies are focusing on developing cost-effective and user-friendly filtration technologies, promoting market penetration across diverse sectors and regions. This includes fostering collaborations to enhance technological capabilities and expand global reach. This market demonstrates significant potential for sustained growth over the forecast period, particularly in applications demanding high levels of virus removal efficiency.
Virus Removal Filtration Technology Company Market Share
Virus Removal Filtration Technology Market Report: 2019-2033
This comprehensive report provides a detailed analysis of the Virus Removal Filtration Technology market, encompassing market dynamics, growth trends, regional analysis, product landscape, key players, and future outlook. The report covers the period from 2019 to 2033, with a focus on the forecast period of 2025-2033 and a base year of 2025. The study segments the market by technology, application, and geography, providing granular insights for industry professionals, investors, and researchers. The total market value is projected to reach xx million USD by 2033.
The parent market is the broader filtration industry, while the child market is specifically virus removal applications within pharmaceuticals, bioprocessing, and water treatment.
Virus Removal Filtration Technology Market Dynamics & Structure
The Virus Removal Filtration Technology market is characterized by moderate concentration, with a few dominant players and several smaller niche players. Technological innovation, particularly in membrane filtration and advanced materials, is a key driver. Stringent regulatory frameworks, particularly concerning biopharmaceutical manufacturing and water purification, significantly influence market growth. Competitive substitutes include chemical disinfection methods, but filtration offers advantages in terms of efficiency and scalability. End-users span diverse industries, including pharmaceuticals, biotechnology, food & beverage, and water treatment, with pharmaceuticals and bioprocessing currently holding the largest market share. M&A activity has been moderate in recent years, with approximately xx deals recorded between 2019 and 2024, primarily focused on consolidation within the filtration technology sector.
- Market Concentration: Moderately concentrated, with top 5 players holding approximately 60% market share (estimated).
- Technological Innovation: Focus on membrane technologies (e.g., ultrafiltration, microfiltration, nanofiltration), virus-specific adsorbents, and advanced material development.
- Regulatory Landscape: Stringent regulations (e.g., GMP, FDA guidelines) drive adoption of high-performance filtration solutions.
- Competitive Substitutes: Chemical disinfection methods pose a competitive threat, but filtration offers superior scalability and reduced chemical usage.
- End-User Demographics: Pharmaceuticals, bioprocessing, and water treatment are key end-user segments.
- M&A Activity: Approximately xx M&A deals in 2019-2024, driven by consolidation and expansion into new markets.
Virus Removal Filtration Technology Growth Trends & Insights
The Virus Removal Filtration Technology market exhibits robust growth, driven by increasing demand from the biopharmaceutical and water treatment sectors. The market size grew from xx million USD in 2019 to xx million USD in 2024, representing a CAGR of xx%. This growth is attributed to factors such as rising concerns over viral contamination, increasing investments in biopharmaceutical manufacturing, and stricter regulations on water quality. Technological advancements, such as the development of more efficient and reliable filtration membranes, are also contributing to market expansion. Adoption rates are increasing across all major end-user segments, with the highest penetration observed in developed regions. Consumer behavior shifts towards safer and healthier products are further fueling market growth.
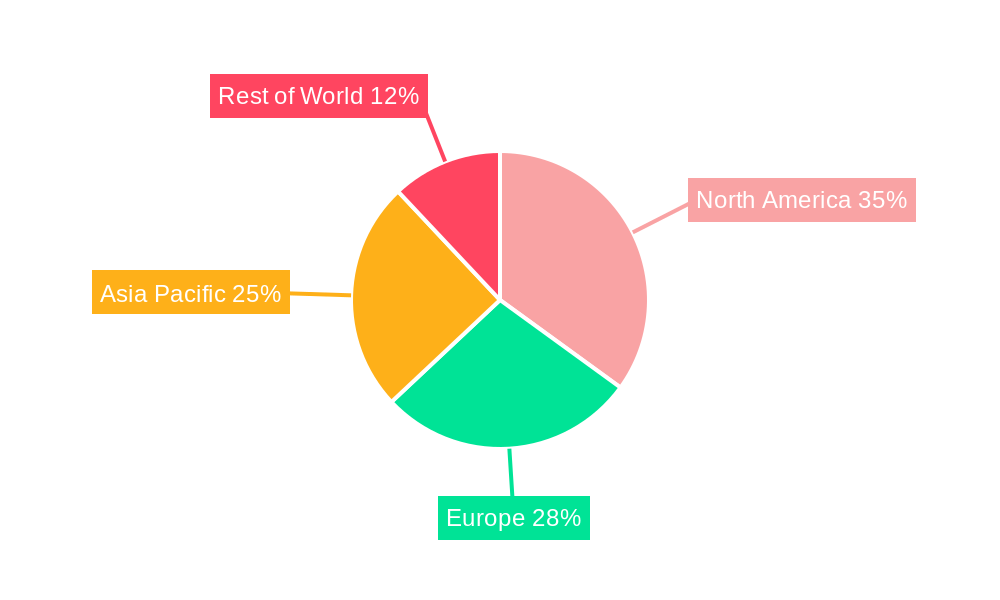
Dominant Regions, Countries, or Segments in Virus Removal Filtration Technology
North America currently holds the largest market share in Virus Removal Filtration Technology, driven by robust pharmaceutical and biotechnology industries, stringent regulatory standards, and high investments in R&D. Europe follows closely, benefiting from a well-established biopharmaceutical sector and strong environmental regulations. Asia-Pacific is experiencing rapid growth, propelled by increasing investments in infrastructure and rising awareness regarding waterborne diseases.
- North America: Strong pharmaceutical and biotech sectors, stringent regulations, high R&D investment.
- Europe: Established biopharmaceutical sector, strong environmental regulations.
- Asia-Pacific: Rapid growth driven by infrastructure investment, rising awareness of waterborne diseases.
- Rest of the World: Moderate growth with increasing adoption in specific sectors.
Virus Removal Filtration Technology Product Landscape
The product landscape is dominated by various filtration technologies, including membrane filtration (ultrafiltration, microfiltration, nanofiltration), depth filtration, and virus-specific adsorbents. Recent innovations include the development of high-flux membranes, improved virus removal efficiency, and enhanced scalability. Key performance metrics include virus removal efficiency, flow rate, pressure drop, and lifespan. Unique selling propositions focus on high efficacy, cost-effectiveness, and ease of use.
Key Drivers, Barriers & Challenges in Virus Removal Filtration Technology
Key Drivers: The rising prevalence of viral diseases, stringent regulatory frameworks emphasizing virus removal, increasing demand for sterile pharmaceutical products, and growing investments in water treatment infrastructure are key drivers. Technological advancements in membrane technology and adsorbents further contribute to market expansion.
Challenges: High initial investment costs for advanced filtration systems, the need for skilled personnel for operation and maintenance, potential membrane fouling issues, and competition from alternative technologies like chemical disinfection are key challenges. Supply chain disruptions can impact the availability of raw materials and specialized equipment.
Emerging Opportunities in Virus Removal Filtration Technology
Emerging opportunities lie in the development of virus-specific filtration solutions for point-of-use water purification, increased adoption in emerging markets, expanding applications in the food and beverage industry, and the exploration of novel membrane materials with enhanced performance characteristics. The growing demand for personalized medicine and cell therapy also presents significant opportunities for specialized virus filtration technologies.
Growth Accelerators in the Virus Removal Filtration Technology Industry
Strategic partnerships between filtration technology providers and biopharmaceutical companies, continued advancements in membrane technology and material science, expansion into new and emerging markets, and government initiatives promoting water security and public health are significant accelerators for long-term market growth.
Key Players Shaping the Virus Removal Filtration Technology Market
- Merck
- Sartorius
- Cytiva
- Asahi Kasei
- TeraPore Technologies
- Agilitech
- Meissner
- Masterfilter
- Cobetter
- LePure Biotech
- S&P Filtration
Notable Milestones in Virus Removal Filtration Technology Sector
- 2020: Launch of a novel virus filtration membrane with enhanced removal efficiency by Cytiva.
- 2021: Merck acquires a smaller filtration technology company specializing in virus removal for biopharmaceutical applications.
- 2022: Sartorius introduces a new line of scalable virus filtration systems for large-scale bioprocessing.
- 2023: Development of a new virus-specific adsorbent with high capacity and selectivity. (Further milestones will be added in future updates)
In-Depth Virus Removal Filtration Technology Market Outlook
The Virus Removal Filtration Technology market is poised for continued robust growth, driven by the factors mentioned above. The increasing demand for safe and effective virus removal solutions across diverse industries, coupled with technological advancements and expanding regulatory frameworks, promises substantial growth opportunities for market players. Strategic partnerships, product innovation, and expansion into new markets will be crucial for success in this dynamic sector. The market is projected to achieve significant growth over the next decade, offering promising avenues for both established companies and new entrants.
Virus Removal Filtration Technology Segmentation
-
1. Application
- 1.1. Biopharmaceuticals
- 1.2. Laboratory Research
- 1.3. Others
-
2. Type
- 2.1. Polyethersulfone (PES)
- 2.2. Regenerated Cellulose (RC)
- 2.3. Polyvinylidene Fluoride (PVDF)
Virus Removal Filtration Technology Segmentation By Geography
-
1. North America
- 1.1. United States
- 1.2. Canada
- 1.3. Mexico
-
2. South America
- 2.1. Brazil
- 2.2. Argentina
- 2.3. Rest of South America
-
3. Europe
- 3.1. United Kingdom
- 3.2. Germany
- 3.3. France
- 3.4. Italy
- 3.5. Spain
- 3.6. Russia
- 3.7. Benelux
- 3.8. Nordics
- 3.9. Rest of Europe
-
4. Middle East & Africa
- 4.1. Turkey
- 4.2. Israel
- 4.3. GCC
- 4.4. North Africa
- 4.5. South Africa
- 4.6. Rest of Middle East & Africa
-
5. Asia Pacific
- 5.1. China
- 5.2. India
- 5.3. Japan
- 5.4. South Korea
- 5.5. ASEAN
- 5.6. Oceania
- 5.7. Rest of Asia Pacific
Virus Removal Filtration Technology Regional Market Share
Geographic Coverage of Virus Removal Filtration Technology
Virus Removal Filtration Technology REPORT HIGHLIGHTS
| Aspects | Details |
|---|---|
| Study Period | 2020-2034 |
| Base Year | 2025 |
| Estimated Year | 2026 |
| Forecast Period | 2026-2034 |
| Historical Period | 2020-2025 |
| Growth Rate | CAGR of 12% from 2020-2034 |
| Segmentation |
|
Table of Contents
- 1. Introduction
- 1.1. Research Scope
- 1.2. Market Segmentation
- 1.3. Research Objective
- 1.4. Definitions and Assumptions
- 2. Executive Summary
- 2.1. Market Snapshot
- 3. Market Dynamics
- 3.1. Market Drivers
- 3.2. Market Restrains
- 3.3. Market Trends
- 3.4. Market Opportunities
- 4. Market Factor Analysis
- 4.1. Porters Five Forces
- 4.1.1. Bargaining Power of Suppliers
- 4.1.2. Bargaining Power of Buyers
- 4.1.3. Threat of New Entrants
- 4.1.4. Threat of Substitutes
- 4.1.5. Competitive Rivalry
- 4.2. PESTEL analysis
- 4.3. BCG Analysis
- 4.3.1. Stars (High Growth, High Market Share)
- 4.3.2. Cash Cows (Low Growth, High Market Share)
- 4.3.3. Question Mark (High Growth, Low Market Share)
- 4.3.4. Dogs (Low Growth, Low Market Share)
- 4.4. Ansoff Matrix Analysis
- 4.5. Supply Chain Analysis
- 4.6. Regulatory Landscape
- 4.7. Current Market Potential and Opportunity Assessment (TAM–SAM–SOM Framework)
- 4.8. VDR Analyst Note
- 4.1. Porters Five Forces
- 5. Market Analysis, Insights and Forecast 2021-2033
- 5.1. Market Analysis, Insights and Forecast - by Application
- 5.1.1. Biopharmaceuticals
- 5.1.2. Laboratory Research
- 5.1.3. Others
- 5.2. Market Analysis, Insights and Forecast - by Type
- 5.2.1. Polyethersulfone (PES)
- 5.2.2. Regenerated Cellulose (RC)
- 5.2.3. Polyvinylidene Fluoride (PVDF)
- 5.3. Market Analysis, Insights and Forecast - by Region
- 5.3.1. North America
- 5.3.2. South America
- 5.3.3. Europe
- 5.3.4. Middle East & Africa
- 5.3.5. Asia Pacific
- 5.1. Market Analysis, Insights and Forecast - by Application
- 6. Global Virus Removal Filtration Technology Analysis, Insights and Forecast, 2021-2033
- 6.1. Market Analysis, Insights and Forecast - by Application
- 6.1.1. Biopharmaceuticals
- 6.1.2. Laboratory Research
- 6.1.3. Others
- 6.2. Market Analysis, Insights and Forecast - by Type
- 6.2.1. Polyethersulfone (PES)
- 6.2.2. Regenerated Cellulose (RC)
- 6.2.3. Polyvinylidene Fluoride (PVDF)
- 6.1. Market Analysis, Insights and Forecast - by Application
- 7. North America Virus Removal Filtration Technology Analysis, Insights and Forecast, 2021-2033
- 7.1. Market Analysis, Insights and Forecast - by Application
- 7.1.1. Biopharmaceuticals
- 7.1.2. Laboratory Research
- 7.1.3. Others
- 7.2. Market Analysis, Insights and Forecast - by Type
- 7.2.1. Polyethersulfone (PES)
- 7.2.2. Regenerated Cellulose (RC)
- 7.2.3. Polyvinylidene Fluoride (PVDF)
- 7.1. Market Analysis, Insights and Forecast - by Application
- 8. South America Virus Removal Filtration Technology Analysis, Insights and Forecast, 2021-2033
- 8.1. Market Analysis, Insights and Forecast - by Application
- 8.1.1. Biopharmaceuticals
- 8.1.2. Laboratory Research
- 8.1.3. Others
- 8.2. Market Analysis, Insights and Forecast - by Type
- 8.2.1. Polyethersulfone (PES)
- 8.2.2. Regenerated Cellulose (RC)
- 8.2.3. Polyvinylidene Fluoride (PVDF)
- 8.1. Market Analysis, Insights and Forecast - by Application
- 9. Europe Virus Removal Filtration Technology Analysis, Insights and Forecast, 2021-2033
- 9.1. Market Analysis, Insights and Forecast - by Application
- 9.1.1. Biopharmaceuticals
- 9.1.2. Laboratory Research
- 9.1.3. Others
- 9.2. Market Analysis, Insights and Forecast - by Type
- 9.2.1. Polyethersulfone (PES)
- 9.2.2. Regenerated Cellulose (RC)
- 9.2.3. Polyvinylidene Fluoride (PVDF)
- 9.1. Market Analysis, Insights and Forecast - by Application
- 10. Middle East & Africa Virus Removal Filtration Technology Analysis, Insights and Forecast, 2021-2033
- 10.1. Market Analysis, Insights and Forecast - by Application
- 10.1.1. Biopharmaceuticals
- 10.1.2. Laboratory Research
- 10.1.3. Others
- 10.2. Market Analysis, Insights and Forecast - by Type
- 10.2.1. Polyethersulfone (PES)
- 10.2.2. Regenerated Cellulose (RC)
- 10.2.3. Polyvinylidene Fluoride (PVDF)
- 10.1. Market Analysis, Insights and Forecast - by Application
- 11. Asia Pacific Virus Removal Filtration Technology Analysis, Insights and Forecast, 2021-2033
- 11.1. Market Analysis, Insights and Forecast - by Application
- 11.1.1. Biopharmaceuticals
- 11.1.2. Laboratory Research
- 11.1.3. Others
- 11.2. Market Analysis, Insights and Forecast - by Type
- 11.2.1. Polyethersulfone (PES)
- 11.2.2. Regenerated Cellulose (RC)
- 11.2.3. Polyvinylidene Fluoride (PVDF)
- 11.1. Market Analysis, Insights and Forecast - by Application
- 12. Competitive Analysis
- 12.1. Company Profiles
- 12.1.1 Merck
- 12.1.1.1. Company Overview
- 12.1.1.2. Products
- 12.1.1.3. Company Financials
- 12.1.1.4. SWOT Analysis
- 12.1.2 Sartorius
- 12.1.2.1. Company Overview
- 12.1.2.2. Products
- 12.1.2.3. Company Financials
- 12.1.2.4. SWOT Analysis
- 12.1.3 Cytiva
- 12.1.3.1. Company Overview
- 12.1.3.2. Products
- 12.1.3.3. Company Financials
- 12.1.3.4. SWOT Analysis
- 12.1.4 Asahi Kasei
- 12.1.4.1. Company Overview
- 12.1.4.2. Products
- 12.1.4.3. Company Financials
- 12.1.4.4. SWOT Analysis
- 12.1.5 TeraPore Technologies
- 12.1.5.1. Company Overview
- 12.1.5.2. Products
- 12.1.5.3. Company Financials
- 12.1.5.4. SWOT Analysis
- 12.1.6 Agilitech
- 12.1.6.1. Company Overview
- 12.1.6.2. Products
- 12.1.6.3. Company Financials
- 12.1.6.4. SWOT Analysis
- 12.1.7 Meissner
- 12.1.7.1. Company Overview
- 12.1.7.2. Products
- 12.1.7.3. Company Financials
- 12.1.7.4. SWOT Analysis
- 12.1.8 Masterfilter
- 12.1.8.1. Company Overview
- 12.1.8.2. Products
- 12.1.8.3. Company Financials
- 12.1.8.4. SWOT Analysis
- 12.1.9 Cobetter
- 12.1.9.1. Company Overview
- 12.1.9.2. Products
- 12.1.9.3. Company Financials
- 12.1.9.4. SWOT Analysis
- 12.1.10 LePure Biotech
- 12.1.10.1. Company Overview
- 12.1.10.2. Products
- 12.1.10.3. Company Financials
- 12.1.10.4. SWOT Analysis
- 12.1.11 S&P Filtration
- 12.1.11.1. Company Overview
- 12.1.11.2. Products
- 12.1.11.3. Company Financials
- 12.1.11.4. SWOT Analysis
- 12.1.1 Merck
- 12.2. Market Entropy
- 12.2.1 Company's Key Areas Served
- 12.2.2 Recent Developments
- 12.3. Company Market Share Analysis 2025
- 12.3.1 Top 5 Companies Market Share Analysis
- 12.3.2 Top 3 Companies Market Share Analysis
- 12.4. List of Potential Customers
- 13. Research Methodology
List of Figures
- Figure 1: Global Virus Removal Filtration Technology Revenue Breakdown (million, %) by Region 2025 & 2033
- Figure 2: North America Virus Removal Filtration Technology Revenue (million), by Application 2025 & 2033
- Figure 3: North America Virus Removal Filtration Technology Revenue Share (%), by Application 2025 & 2033
- Figure 4: North America Virus Removal Filtration Technology Revenue (million), by Type 2025 & 2033
- Figure 5: North America Virus Removal Filtration Technology Revenue Share (%), by Type 2025 & 2033
- Figure 6: North America Virus Removal Filtration Technology Revenue (million), by Country 2025 & 2033
- Figure 7: North America Virus Removal Filtration Technology Revenue Share (%), by Country 2025 & 2033
- Figure 8: South America Virus Removal Filtration Technology Revenue (million), by Application 2025 & 2033
- Figure 9: South America Virus Removal Filtration Technology Revenue Share (%), by Application 2025 & 2033
- Figure 10: South America Virus Removal Filtration Technology Revenue (million), by Type 2025 & 2033
- Figure 11: South America Virus Removal Filtration Technology Revenue Share (%), by Type 2025 & 2033
- Figure 12: South America Virus Removal Filtration Technology Revenue (million), by Country 2025 & 2033
- Figure 13: South America Virus Removal Filtration Technology Revenue Share (%), by Country 2025 & 2033
- Figure 14: Europe Virus Removal Filtration Technology Revenue (million), by Application 2025 & 2033
- Figure 15: Europe Virus Removal Filtration Technology Revenue Share (%), by Application 2025 & 2033
- Figure 16: Europe Virus Removal Filtration Technology Revenue (million), by Type 2025 & 2033
- Figure 17: Europe Virus Removal Filtration Technology Revenue Share (%), by Type 2025 & 2033
- Figure 18: Europe Virus Removal Filtration Technology Revenue (million), by Country 2025 & 2033
- Figure 19: Europe Virus Removal Filtration Technology Revenue Share (%), by Country 2025 & 2033
- Figure 20: Middle East & Africa Virus Removal Filtration Technology Revenue (million), by Application 2025 & 2033
- Figure 21: Middle East & Africa Virus Removal Filtration Technology Revenue Share (%), by Application 2025 & 2033
- Figure 22: Middle East & Africa Virus Removal Filtration Technology Revenue (million), by Type 2025 & 2033
- Figure 23: Middle East & Africa Virus Removal Filtration Technology Revenue Share (%), by Type 2025 & 2033
- Figure 24: Middle East & Africa Virus Removal Filtration Technology Revenue (million), by Country 2025 & 2033
- Figure 25: Middle East & Africa Virus Removal Filtration Technology Revenue Share (%), by Country 2025 & 2033
- Figure 26: Asia Pacific Virus Removal Filtration Technology Revenue (million), by Application 2025 & 2033
- Figure 27: Asia Pacific Virus Removal Filtration Technology Revenue Share (%), by Application 2025 & 2033
- Figure 28: Asia Pacific Virus Removal Filtration Technology Revenue (million), by Type 2025 & 2033
- Figure 29: Asia Pacific Virus Removal Filtration Technology Revenue Share (%), by Type 2025 & 2033
- Figure 30: Asia Pacific Virus Removal Filtration Technology Revenue (million), by Country 2025 & 2033
- Figure 31: Asia Pacific Virus Removal Filtration Technology Revenue Share (%), by Country 2025 & 2033
List of Tables
- Table 1: Global Virus Removal Filtration Technology Revenue million Forecast, by Application 2020 & 2033
- Table 2: Global Virus Removal Filtration Technology Revenue million Forecast, by Type 2020 & 2033
- Table 3: Global Virus Removal Filtration Technology Revenue million Forecast, by Region 2020 & 2033
- Table 4: Global Virus Removal Filtration Technology Revenue million Forecast, by Application 2020 & 2033
- Table 5: Global Virus Removal Filtration Technology Revenue million Forecast, by Type 2020 & 2033
- Table 6: Global Virus Removal Filtration Technology Revenue million Forecast, by Country 2020 & 2033
- Table 7: United States Virus Removal Filtration Technology Revenue (million) Forecast, by Application 2020 & 2033
- Table 8: Canada Virus Removal Filtration Technology Revenue (million) Forecast, by Application 2020 & 2033
- Table 9: Mexico Virus Removal Filtration Technology Revenue (million) Forecast, by Application 2020 & 2033
- Table 10: Global Virus Removal Filtration Technology Revenue million Forecast, by Application 2020 & 2033
- Table 11: Global Virus Removal Filtration Technology Revenue million Forecast, by Type 2020 & 2033
- Table 12: Global Virus Removal Filtration Technology Revenue million Forecast, by Country 2020 & 2033
- Table 13: Brazil Virus Removal Filtration Technology Revenue (million) Forecast, by Application 2020 & 2033
- Table 14: Argentina Virus Removal Filtration Technology Revenue (million) Forecast, by Application 2020 & 2033
- Table 15: Rest of South America Virus Removal Filtration Technology Revenue (million) Forecast, by Application 2020 & 2033
- Table 16: Global Virus Removal Filtration Technology Revenue million Forecast, by Application 2020 & 2033
- Table 17: Global Virus Removal Filtration Technology Revenue million Forecast, by Type 2020 & 2033
- Table 18: Global Virus Removal Filtration Technology Revenue million Forecast, by Country 2020 & 2033
- Table 19: United Kingdom Virus Removal Filtration Technology Revenue (million) Forecast, by Application 2020 & 2033
- Table 20: Germany Virus Removal Filtration Technology Revenue (million) Forecast, by Application 2020 & 2033
- Table 21: France Virus Removal Filtration Technology Revenue (million) Forecast, by Application 2020 & 2033
- Table 22: Italy Virus Removal Filtration Technology Revenue (million) Forecast, by Application 2020 & 2033
- Table 23: Spain Virus Removal Filtration Technology Revenue (million) Forecast, by Application 2020 & 2033
- Table 24: Russia Virus Removal Filtration Technology Revenue (million) Forecast, by Application 2020 & 2033
- Table 25: Benelux Virus Removal Filtration Technology Revenue (million) Forecast, by Application 2020 & 2033
- Table 26: Nordics Virus Removal Filtration Technology Revenue (million) Forecast, by Application 2020 & 2033
- Table 27: Rest of Europe Virus Removal Filtration Technology Revenue (million) Forecast, by Application 2020 & 2033
- Table 28: Global Virus Removal Filtration Technology Revenue million Forecast, by Application 2020 & 2033
- Table 29: Global Virus Removal Filtration Technology Revenue million Forecast, by Type 2020 & 2033
- Table 30: Global Virus Removal Filtration Technology Revenue million Forecast, by Country 2020 & 2033
- Table 31: Turkey Virus Removal Filtration Technology Revenue (million) Forecast, by Application 2020 & 2033
- Table 32: Israel Virus Removal Filtration Technology Revenue (million) Forecast, by Application 2020 & 2033
- Table 33: GCC Virus Removal Filtration Technology Revenue (million) Forecast, by Application 2020 & 2033
- Table 34: North Africa Virus Removal Filtration Technology Revenue (million) Forecast, by Application 2020 & 2033
- Table 35: South Africa Virus Removal Filtration Technology Revenue (million) Forecast, by Application 2020 & 2033
- Table 36: Rest of Middle East & Africa Virus Removal Filtration Technology Revenue (million) Forecast, by Application 2020 & 2033
- Table 37: Global Virus Removal Filtration Technology Revenue million Forecast, by Application 2020 & 2033
- Table 38: Global Virus Removal Filtration Technology Revenue million Forecast, by Type 2020 & 2033
- Table 39: Global Virus Removal Filtration Technology Revenue million Forecast, by Country 2020 & 2033
- Table 40: China Virus Removal Filtration Technology Revenue (million) Forecast, by Application 2020 & 2033
- Table 41: India Virus Removal Filtration Technology Revenue (million) Forecast, by Application 2020 & 2033
- Table 42: Japan Virus Removal Filtration Technology Revenue (million) Forecast, by Application 2020 & 2033
- Table 43: South Korea Virus Removal Filtration Technology Revenue (million) Forecast, by Application 2020 & 2033
- Table 44: ASEAN Virus Removal Filtration Technology Revenue (million) Forecast, by Application 2020 & 2033
- Table 45: Oceania Virus Removal Filtration Technology Revenue (million) Forecast, by Application 2020 & 2033
- Table 46: Rest of Asia Pacific Virus Removal Filtration Technology Revenue (million) Forecast, by Application 2020 & 2033
Frequently Asked Questions
1. What is the projected Compound Annual Growth Rate (CAGR) of the Virus Removal Filtration Technology?
The projected CAGR is approximately 12%.
2. Which companies are prominent players in the Virus Removal Filtration Technology?
Key companies in the market include Merck, Sartorius, Cytiva, Asahi Kasei, TeraPore Technologies, Agilitech, Meissner, Masterfilter, Cobetter, LePure Biotech, S&P Filtration.
3. What are the main segments of the Virus Removal Filtration Technology?
The market segments include Application, Type.
4. Can you provide details about the market size?
The market size is estimated to be USD 12480 million as of 2022.
5. What are some drivers contributing to market growth?
N/A
6. What are the notable trends driving market growth?
N/A
7. Are there any restraints impacting market growth?
N/A
8. Can you provide examples of recent developments in the market?
N/A
9. What pricing options are available for accessing the report?
Pricing options include single-user, multi-user, and enterprise licenses priced at USD 3950.00, USD 5925.00, and USD 7900.00 respectively.
10. Is the market size provided in terms of value or volume?
The market size is provided in terms of value, measured in million.
11. Are there any specific market keywords associated with the report?
Yes, the market keyword associated with the report is "Virus Removal Filtration Technology," which aids in identifying and referencing the specific market segment covered.
12. How do I determine which pricing option suits my needs best?
The pricing options vary based on user requirements and access needs. Individual users may opt for single-user licenses, while businesses requiring broader access may choose multi-user or enterprise licenses for cost-effective access to the report.
13. Are there any additional resources or data provided in the Virus Removal Filtration Technology report?
While the report offers comprehensive insights, it's advisable to review the specific contents or supplementary materials provided to ascertain if additional resources or data are available.
14. How can I stay updated on further developments or reports in the Virus Removal Filtration Technology?
To stay informed about further developments, trends, and reports in the Virus Removal Filtration Technology, consider subscribing to industry newsletters, following relevant companies and organizations, or regularly checking reputable industry news sources and publications.
Methodology
Step 1 - Identification of Relevant Samples Size from Population Database


Step 2 - Approaches for Defining Global Market Size (Value, Volume* & Price*)

Note*: In applicable scenarios
Step 3 - Data Sources
Primary Research
- Web Analytics
- Survey Reports
- Research Institute
- Latest Research Reports
- Opinion Leaders
Secondary Research
- Annual Reports
- White Paper
- Latest Press Release
- Industry Association
- Paid Database
- Investor Presentations

Step 4 - Data Triangulation
Involves using different sources of information in order to increase the validity of a study
These sources are likely to be stakeholders in a program - participants, other researchers, program staff, other community members, and so on.
Then we put all data in single framework & apply various statistical tools to find out the dynamic on the market.
During the analysis stage, feedback from the stakeholder groups would be compared to determine areas of agreement as well as areas of divergence