

Key Insights
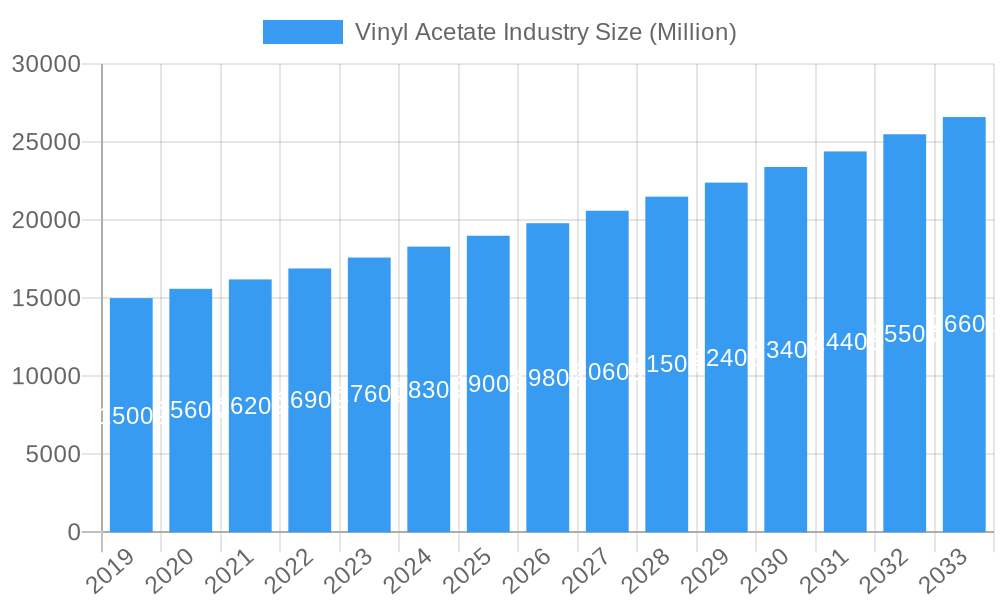
The global Vinyl Acetate market is projected for significant expansion, estimated at $1.97 billion in 2025, with a Compound Annual Growth Rate (CAGR) of 5.47% anticipated through 2033. This growth is propelled by escalating demand across key industries including solar energy, automotive, construction, and packaging. The inherent versatility of vinyl acetate derivatives – such as Polyvinyl Acetate (PVA), Polyvinyl Alcohol (PVOH), and Ethylene Vinyl Acetate (EVA) – in adhesives, coatings, films, and specialty polymers, is a primary growth catalyst. The increasing adoption of sustainable and high-performance materials in these sectors further bolsters the market. Additionally, robust infrastructure development and the expansion of the consumer goods sector, particularly in emerging economies, are significant contributors to market growth.
Vinyl Acetate Industry Market Size (In Billion)
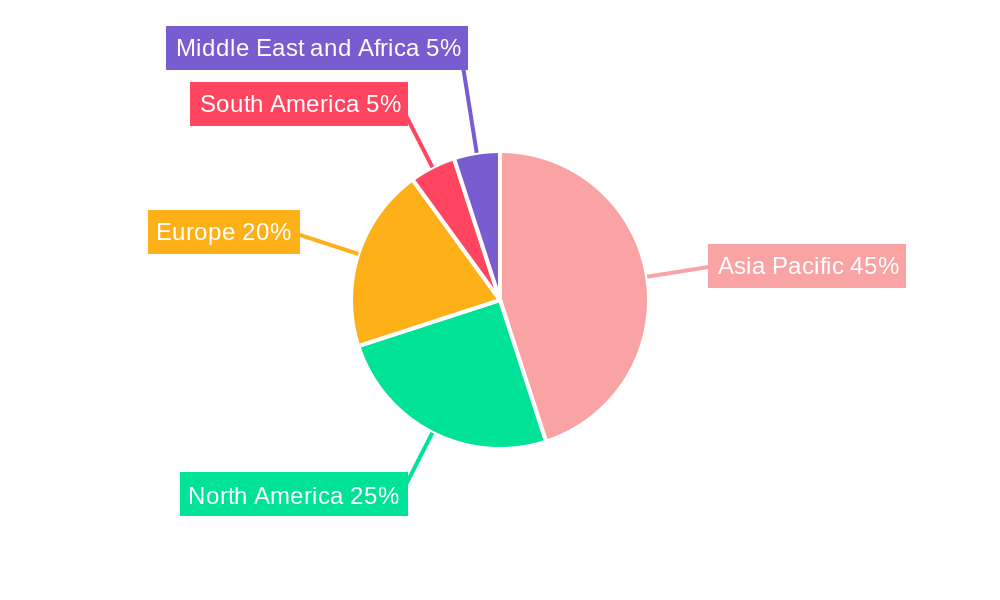
Key trends influencing the Vinyl Acetate industry include a strong emphasis on developing bio-based and sustainable vinyl acetate monomers, driven by environmental regulations and consumer demand for eco-friendly products. Innovations in polymerization processes are enhancing product performance and cost-efficiency. Notable growth areas include the expanding use of EVA in flexible packaging and its critical role in solar panel encapsulation. Challenges include raw material price volatility (ethylene, acetic acid) and competition from alternative materials. Geographically, the Asia Pacific region, led by China and India, is expected to be the largest and fastest-growing market due to rapid industrialization and substantial investments. North America and Europe offer significant opportunities driven by technological advancements and stringent quality standards.
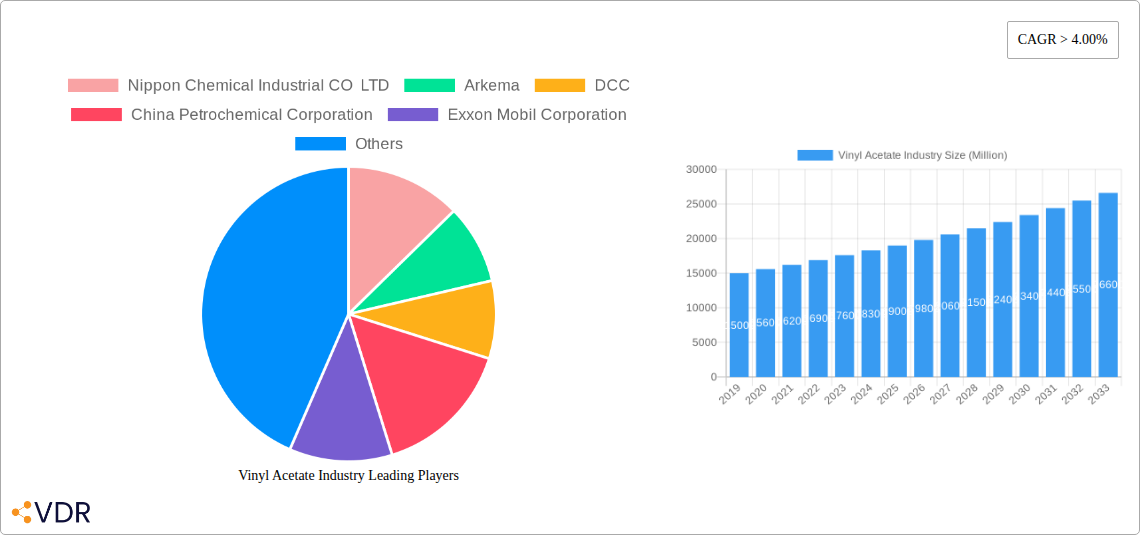
Vinyl Acetate Industry Company Market Share
Comprehensive Vinyl Acetate Market Report: Trends, Opportunities, and Key Players (2019-2033)
This in-depth report provides a strategic overview of the global Vinyl Acetate industry, encompassing market dynamics, growth trends, regional dominance, product landscapes, and a detailed analysis of key players and their impactful milestones. Covering the historical period from 2019-2024, the base and estimated year of 2025, and a robust forecast period extending to 2033, this report is an essential resource for stakeholders seeking to understand the evolving Vinyl Acetate market. We present all values in Million units to ensure consistency and clarity.
Vinyl Acetate Industry Market Dynamics & Structure
The Vinyl Acetate industry is characterized by a moderately concentrated market structure, with leading players such as Celanese Corporation, Exxon Mobil Corporation, and Arkema holding significant market shares. Technological innovation remains a primary driver, with ongoing advancements in VAM production efficiency and the development of high-performance EVA copolymers. Regulatory frameworks, particularly concerning environmental sustainability and chemical safety, are increasingly influencing production processes and product development. Competitive product substitutes, while present, often struggle to match the cost-effectiveness and versatile performance of vinyl acetate derivatives across diverse applications. End-user demographics are shifting, with a growing demand from emerging economies and a heightened focus on sustainable materials. Mergers and acquisitions (M&A) activity has been moderate, with strategic consolidations aimed at expanding production capacity, enhancing technological portfolios, and gaining market access. For instance, the total value of M&A deals in the last three years is estimated at approximately $500 Million. Innovation barriers include the capital-intensive nature of VAM production and the need for specialized technical expertise.
- Market Concentration: Moderate, with top 5 players holding an estimated 45% market share.
- Technological Innovation: Focus on improved VAM synthesis, catalyst development, and specialty EVA grades.
- Regulatory Impact: Increasing stringency on emissions and waste management.
- Competitive Substitutes: Limited, particularly for high-performance applications.
- End-User Demographics: Growing demand from Asia-Pacific and Latin America.
- M&A Trends: Strategic acquisitions for capacity expansion and technology integration.
Vinyl Acetate Industry Growth Trends & Insights
The Vinyl Acetate market is poised for steady growth, driven by escalating demand across its diverse applications. The global market size for Vinyl Acetate and its derivatives is projected to reach approximately $25,000 Million by 2033, exhibiting a Compound Annual Growth Rate (CAGR) of around 4.5% from the base year of 2025. Adoption rates for Ethylene Vinyl Acetate (EVA) are particularly high in the packaging and solar industries, fueled by their flexibility, durability, and optical properties. Technological disruptions, such as advancements in catalyst technology leading to higher VAM yields and the development of bio-based vinyl acetate monomers, are set to redefine production economics and sustainability profiles. Consumer behavior shifts, including a preference for eco-friendly and high-performance materials in textiles and construction, further propel market expansion. The increasing application of Polyvinyl Alcohol (PVA) in textiles, paper, and adhesives contributes significantly to market penetration. The market penetration of EVA in solar panel encapsulation alone is expected to reach 80% by 2033.
Dominant Regions, Countries, or Segments in Vinyl Acetate Industry
The Asia-Pacific region is the dominant force in the global Vinyl Acetate industry, driven by robust industrialization, a burgeoning manufacturing sector, and significant investments in infrastructure. China, in particular, stands out as a leading country due to its extensive VAM production capacity and substantial domestic consumption across various end-user industries. Within applications, Polyvinyl Acetate (PVA) holds a substantial market share, primarily due to its widespread use in adhesives, paints, and coatings, industries that are experiencing consistent growth in developing economies. However, Ethylene Vinyl Acetate (EVA) is exhibiting the fastest growth trajectory, propelled by its critical role in the booming solar energy sector for panel encapsulation and its increasing adoption in the automotive industry for lightweight components and interior trims. The Building and Construction end-user industry also represents a significant market, with PVA-based adhesives and coatings being indispensable. The packaging sector's continuous expansion, seeking more flexible and resilient materials, further bolsters demand for EVA. Economic policies promoting manufacturing and renewable energy infrastructure development in countries like China and India are key drivers of this regional dominance. The market share of the Asia-Pacific region in the global Vinyl Acetate market is estimated at 55%.
- Dominant Region: Asia-Pacific, driven by China and India.
- Leading Application Segment: Polyvinyl Acetate (PVA), followed by Ethylene Vinyl Acetate (EVA).
- Fastest Growing Application Segment: Ethylene Vinyl Acetate (EVA).
- Key End-User Industries: Building and Construction, Packaging, Solar, and Automotive.
- Growth Drivers: Industrialization, infrastructure development, renewable energy initiatives, and expanding consumer markets.
Vinyl Acetate Industry Product Landscape
The Vinyl Acetate industry thrives on a diverse product landscape, with Polyvinyl Acetate (PVA) serving as a foundational polymer for adhesives, paints, and coatings, offering excellent binding properties. Polyvinyl Alcohol (PVA), a water-soluble synthetic polymer, finds extensive use in textile sizing, paper coatings, and as a thickener. Ethylene Vinyl Acetate (EVA) copolymers stand out for their exceptional flexibility, toughness, and optical clarity, making them ideal for solar panel encapsulation, footwear, and flexible packaging. The unique selling proposition of these products lies in their customizable properties, allowing formulators to tailor performance characteristics for specific applications. Technological advancements are focused on enhancing thermal stability, UV resistance, and biodegradability of these vinyl acetate derivatives, catering to the growing demand for sustainable and high-performance materials.
Key Drivers, Barriers & Challenges in Vinyl Acetate Industry
The Vinyl Acetate industry is propelled by several key drivers, including the ever-increasing demand from the construction and packaging sectors, coupled with the robust growth of the renewable energy market, particularly solar power, which heavily relies on EVA for panel encapsulation. Technological advancements in polymerization processes and the development of specialized grades of EVA and PVA are also crucial growth enablers. Furthermore, supportive government policies promoting domestic manufacturing and renewable energy adoption in key regions contribute significantly to market expansion.
However, the industry faces notable barriers and challenges. Fluctuations in raw material prices, particularly ethylene and acetic acid, can impact profit margins and market competitiveness. Stringent environmental regulations regarding VOC emissions and waste disposal necessitate continuous investment in cleaner production technologies. Supply chain disruptions, as witnessed in recent global events, can lead to production delays and increased costs. Intense competition among established players and the emergence of new entrants also pose a challenge, demanding constant innovation and cost optimization. The capital-intensive nature of VAM production can also act as a barrier to entry for smaller companies.
Emerging Opportunities in Vinyl Acetate Industry
Emerging opportunities within the Vinyl Acetate industry are abundant, particularly in the development of bio-based and biodegradable vinyl acetate monomers and polymers, catering to the growing global demand for sustainable materials. The expanding market for electric vehicles presents a significant opportunity for EVA in battery components and lightweight automotive parts. Furthermore, the increasing adoption of advanced packaging solutions, driven by e-commerce growth, opens avenues for specialized EVA grades with enhanced barrier properties and recyclability. The burgeoning demand for personalized and performance-driven textiles also creates opportunities for advanced PVA derivatives.
Growth Accelerators in the Vinyl Acetate Industry Industry
Several catalysts are driving long-term growth in the Vinyl Acetate industry. Technological breakthroughs in catalyst design and process optimization are leading to more efficient and cost-effective VAM production, thereby expanding its competitive edge. Strategic partnerships and collaborations between VAM producers and end-users are fostering the development of tailor-made solutions for specific applications, accelerating market penetration. Furthermore, geographical market expansion into developing economies with rapidly growing construction and consumer goods sectors represents a significant growth accelerator. The ongoing global push towards renewable energy sources and the increasing adoption of solar power are fundamental to the sustained growth of the EVA segment.
Key Players Shaping the Vinyl Acetate Industry Market
- Nippon Chemical Industrial CO LTD
- Arkema
- DCC
- China Petrochemical Corporation
- Exxon Mobil Corporation
- INEOS
- Celanese Corporation
- Kemipex
- LyondellBasell Industries Holdings B V
- CLARIANT
- Sipchem Company
- Wacker Chemie AG
- Innospec
Notable Milestones in Vinyl Acetate Industry Sector
- February 2023: Celanese Corporation announced the completion of an ultra-low capital initiative to repurpose existing manufacturing and infrastructure assets to enable extra ethylene vinyl acetate (EVA) capacity at its Edmonton, Alberta site. The development will help the Acetyl Chain's downstream vinyl offering expand significantly.
- December 2022: Showa Denko K.K. announced to license its technology for producing vinyl acetate monomer (VAM) to Asian Paints Limited as part of a formal partnership deal between SDK and KBR, a global engineering and technology solutions company based in the United States. Furthermore, SDK will supply Asian Paints with catalysts for the company's VAM manufacturing.
In-Depth Vinyl Acetate Industry Market Outlook
The Vinyl Acetate industry is set for sustained and robust growth, with future market potential heavily influenced by innovations in sustainable production and advanced material science. Strategic opportunities lie in capitalizing on the increasing global imperative for green chemistry, driving the demand for bio-based VAM and biodegradable vinyl acetate polymers. The continued expansion of the solar energy sector, coupled with the automotive industry's shift towards electrification and lightweight materials, will serve as significant growth accelerators. Moreover, the increasing urbanization and infrastructure development in emerging economies will further fuel the demand for Polyvinyl Acetate in construction and coatings. Strategic investments in R&D for high-performance EVA grades with enhanced durability and functionality will unlock new application frontiers.
Vinyl Acetate Industry Segmentation
-
1. Application
- 1.1. Polyvinyl Acetate
- 1.2. Polyvinyl Alcohol
- 1.3. Ethylene Vinyl Acetate (EVA)
- 1.4. Other Applications
-
2. End-user Industry
- 2.1. Solar
- 2.2. Automotive
- 2.3. Building and Construction
- 2.4. Packaging
- 2.5. Textile
- 2.6. Other End-user Industries
Vinyl Acetate Industry Segmentation By Geography
-
1. Asia Pacific
- 1.1. China
- 1.2. India
- 1.3. Japan
- 1.4. South Korea
- 1.5. Rest of Asia Pacific
-
2. North America
- 2.1. United States
- 2.2. Canada
- 2.3. Mexico
-
3. Europe
- 3.1. Germany
- 3.2. United Kingdom
- 3.3. Italy
- 3.4. Russia
- 3.5. France
- 3.6. Rest of Europe
-
4. South America
- 4.1. Brazil
- 4.2. Argentina
- 4.3. Rest of South America
-
5. Middle East and Africa
- 5.1. Saudi Arabia
- 5.2. South Africa
- 5.3. Rest of Middle East and Africa
Vinyl Acetate Industry Regional Market Share
Geographic Coverage of Vinyl Acetate Industry
Vinyl Acetate Industry REPORT HIGHLIGHTS
| Aspects | Details |
|---|---|
| Study Period | 2020-2034 |
| Base Year | 2025 |
| Estimated Year | 2026 |
| Forecast Period | 2026-2034 |
| Historical Period | 2020-2025 |
| Growth Rate | CAGR of 5.47% from 2020-2034 |
| Segmentation |
|
Table of Contents
- 1. Introduction
- 1.1. Research Scope
- 1.2. Market Segmentation
- 1.3. Research Objective
- 1.4. Definitions and Assumptions
- 2. Executive Summary
- 2.1. Market Snapshot
- 3. Market Dynamics
- 3.1. Market Drivers
- 3.2. Market Restrains
- 3.3. Market Trends
- 3.4. Market Opportunities
- 4. Market Factor Analysis
- 4.1. Porters Five Forces
- 4.1.1. Bargaining Power of Suppliers
- 4.1.2. Bargaining Power of Buyers
- 4.1.3. Threat of New Entrants
- 4.1.4. Threat of Substitutes
- 4.1.5. Competitive Rivalry
- 4.2. PESTEL analysis
- 4.3. BCG Analysis
- 4.3.1. Stars (High Growth, High Market Share)
- 4.3.2. Cash Cows (Low Growth, High Market Share)
- 4.3.3. Question Mark (High Growth, Low Market Share)
- 4.3.4. Dogs (Low Growth, Low Market Share)
- 4.4. Ansoff Matrix Analysis
- 4.5. Supply Chain Analysis
- 4.6. Regulatory Landscape
- 4.7. Current Market Potential and Opportunity Assessment (TAM–SAM–SOM Framework)
- 4.8. VDR Analyst Note
- 4.1. Porters Five Forces
- 5. Market Analysis, Insights and Forecast 2021-2033
- 5.1. Market Analysis, Insights and Forecast - by Application
- 5.1.1. Polyvinyl Acetate
- 5.1.2. Polyvinyl Alcohol
- 5.1.3. Ethylene Vinyl Acetate (EVA)
- 5.1.4. Other Applications
- 5.2. Market Analysis, Insights and Forecast - by End-user Industry
- 5.2.1. Solar
- 5.2.2. Automotive
- 5.2.3. Building and Construction
- 5.2.4. Packaging
- 5.2.5. Textile
- 5.2.6. Other End-user Industries
- 5.3. Market Analysis, Insights and Forecast - by Region
- 5.3.1. Asia Pacific
- 5.3.2. North America
- 5.3.3. Europe
- 5.3.4. South America
- 5.3.5. Middle East and Africa
- 5.1. Market Analysis, Insights and Forecast - by Application
- 6. Global Vinyl Acetate Industry Analysis, Insights and Forecast, 2021-2033
- 6.1. Market Analysis, Insights and Forecast - by Application
- 6.1.1. Polyvinyl Acetate
- 6.1.2. Polyvinyl Alcohol
- 6.1.3. Ethylene Vinyl Acetate (EVA)
- 6.1.4. Other Applications
- 6.2. Market Analysis, Insights and Forecast - by End-user Industry
- 6.2.1. Solar
- 6.2.2. Automotive
- 6.2.3. Building and Construction
- 6.2.4. Packaging
- 6.2.5. Textile
- 6.2.6. Other End-user Industries
- 6.1. Market Analysis, Insights and Forecast - by Application
- 7. Asia Pacific Vinyl Acetate Industry Analysis, Insights and Forecast, 2021-2033
- 7.1. Market Analysis, Insights and Forecast - by Application
- 7.1.1. Polyvinyl Acetate
- 7.1.2. Polyvinyl Alcohol
- 7.1.3. Ethylene Vinyl Acetate (EVA)
- 7.1.4. Other Applications
- 7.2. Market Analysis, Insights and Forecast - by End-user Industry
- 7.2.1. Solar
- 7.2.2. Automotive
- 7.2.3. Building and Construction
- 7.2.4. Packaging
- 7.2.5. Textile
- 7.2.6. Other End-user Industries
- 7.1. Market Analysis, Insights and Forecast - by Application
- 8. North America Vinyl Acetate Industry Analysis, Insights and Forecast, 2021-2033
- 8.1. Market Analysis, Insights and Forecast - by Application
- 8.1.1. Polyvinyl Acetate
- 8.1.2. Polyvinyl Alcohol
- 8.1.3. Ethylene Vinyl Acetate (EVA)
- 8.1.4. Other Applications
- 8.2. Market Analysis, Insights and Forecast - by End-user Industry
- 8.2.1. Solar
- 8.2.2. Automotive
- 8.2.3. Building and Construction
- 8.2.4. Packaging
- 8.2.5. Textile
- 8.2.6. Other End-user Industries
- 8.1. Market Analysis, Insights and Forecast - by Application
- 9. Europe Vinyl Acetate Industry Analysis, Insights and Forecast, 2021-2033
- 9.1. Market Analysis, Insights and Forecast - by Application
- 9.1.1. Polyvinyl Acetate
- 9.1.2. Polyvinyl Alcohol
- 9.1.3. Ethylene Vinyl Acetate (EVA)
- 9.1.4. Other Applications
- 9.2. Market Analysis, Insights and Forecast - by End-user Industry
- 9.2.1. Solar
- 9.2.2. Automotive
- 9.2.3. Building and Construction
- 9.2.4. Packaging
- 9.2.5. Textile
- 9.2.6. Other End-user Industries
- 9.1. Market Analysis, Insights and Forecast - by Application
- 10. South America Vinyl Acetate Industry Analysis, Insights and Forecast, 2021-2033
- 10.1. Market Analysis, Insights and Forecast - by Application
- 10.1.1. Polyvinyl Acetate
- 10.1.2. Polyvinyl Alcohol
- 10.1.3. Ethylene Vinyl Acetate (EVA)
- 10.1.4. Other Applications
- 10.2. Market Analysis, Insights and Forecast - by End-user Industry
- 10.2.1. Solar
- 10.2.2. Automotive
- 10.2.3. Building and Construction
- 10.2.4. Packaging
- 10.2.5. Textile
- 10.2.6. Other End-user Industries
- 10.1. Market Analysis, Insights and Forecast - by Application
- 11. Middle East and Africa Vinyl Acetate Industry Analysis, Insights and Forecast, 2021-2033
- 11.1. Market Analysis, Insights and Forecast - by Application
- 11.1.1. Polyvinyl Acetate
- 11.1.2. Polyvinyl Alcohol
- 11.1.3. Ethylene Vinyl Acetate (EVA)
- 11.1.4. Other Applications
- 11.2. Market Analysis, Insights and Forecast - by End-user Industry
- 11.2.1. Solar
- 11.2.2. Automotive
- 11.2.3. Building and Construction
- 11.2.4. Packaging
- 11.2.5. Textile
- 11.2.6. Other End-user Industries
- 11.1. Market Analysis, Insights and Forecast - by Application
- 12. Competitive Analysis
- 12.1. Company Profiles
- 12.1.1 Nippon Chemical Industrial CO LTD
- 12.1.1.1. Company Overview
- 12.1.1.2. Products
- 12.1.1.3. Company Financials
- 12.1.1.4. SWOT Analysis
- 12.1.2 Arkema
- 12.1.2.1. Company Overview
- 12.1.2.2. Products
- 12.1.2.3. Company Financials
- 12.1.2.4. SWOT Analysis
- 12.1.3 DCC
- 12.1.3.1. Company Overview
- 12.1.3.2. Products
- 12.1.3.3. Company Financials
- 12.1.3.4. SWOT Analysis
- 12.1.4 China Petrochemical Corporation
- 12.1.4.1. Company Overview
- 12.1.4.2. Products
- 12.1.4.3. Company Financials
- 12.1.4.4. SWOT Analysis
- 12.1.5 Exxon Mobil Corporation
- 12.1.5.1. Company Overview
- 12.1.5.2. Products
- 12.1.5.3. Company Financials
- 12.1.5.4. SWOT Analysis
- 12.1.6 INEOS
- 12.1.6.1. Company Overview
- 12.1.6.2. Products
- 12.1.6.3. Company Financials
- 12.1.6.4. SWOT Analysis
- 12.1.7 Celanese Corporation
- 12.1.7.1. Company Overview
- 12.1.7.2. Products
- 12.1.7.3. Company Financials
- 12.1.7.4. SWOT Analysis
- 12.1.8 Kemipex
- 12.1.8.1. Company Overview
- 12.1.8.2. Products
- 12.1.8.3. Company Financials
- 12.1.8.4. SWOT Analysis
- 12.1.9 LyondellBasell Industries Holdings B V
- 12.1.9.1. Company Overview
- 12.1.9.2. Products
- 12.1.9.3. Company Financials
- 12.1.9.4. SWOT Analysis
- 12.1.10 CLARIANT
- 12.1.10.1. Company Overview
- 12.1.10.2. Products
- 12.1.10.3. Company Financials
- 12.1.10.4. SWOT Analysis
- 12.1.11 Sipchem Company
- 12.1.11.1. Company Overview
- 12.1.11.2. Products
- 12.1.11.3. Company Financials
- 12.1.11.4. SWOT Analysis
- 12.1.12 Wacker Chemie AG
- 12.1.12.1. Company Overview
- 12.1.12.2. Products
- 12.1.12.3. Company Financials
- 12.1.12.4. SWOT Analysis
- 12.1.13 Innospec
- 12.1.13.1. Company Overview
- 12.1.13.2. Products
- 12.1.13.3. Company Financials
- 12.1.13.4. SWOT Analysis
- 12.1.1 Nippon Chemical Industrial CO LTD
- 12.2. Market Entropy
- 12.2.1 Company's Key Areas Served
- 12.2.2 Recent Developments
- 12.3. Company Market Share Analysis 2025
- 12.3.1 Top 5 Companies Market Share Analysis
- 12.3.2 Top 3 Companies Market Share Analysis
- 12.4. List of Potential Customers
- 13. Research Methodology
List of Figures
- Figure 1: Global Vinyl Acetate Industry Revenue Breakdown (billion, %) by Region 2025 & 2033
- Figure 2: Global Vinyl Acetate Industry Volume Breakdown (K Tons, %) by Region 2025 & 2033
- Figure 3: Asia Pacific Vinyl Acetate Industry Revenue (billion), by Application 2025 & 2033
- Figure 4: Asia Pacific Vinyl Acetate Industry Volume (K Tons), by Application 2025 & 2033
- Figure 5: Asia Pacific Vinyl Acetate Industry Revenue Share (%), by Application 2025 & 2033
- Figure 6: Asia Pacific Vinyl Acetate Industry Volume Share (%), by Application 2025 & 2033
- Figure 7: Asia Pacific Vinyl Acetate Industry Revenue (billion), by End-user Industry 2025 & 2033
- Figure 8: Asia Pacific Vinyl Acetate Industry Volume (K Tons), by End-user Industry 2025 & 2033
- Figure 9: Asia Pacific Vinyl Acetate Industry Revenue Share (%), by End-user Industry 2025 & 2033
- Figure 10: Asia Pacific Vinyl Acetate Industry Volume Share (%), by End-user Industry 2025 & 2033
- Figure 11: Asia Pacific Vinyl Acetate Industry Revenue (billion), by Country 2025 & 2033
- Figure 12: Asia Pacific Vinyl Acetate Industry Volume (K Tons), by Country 2025 & 2033
- Figure 13: Asia Pacific Vinyl Acetate Industry Revenue Share (%), by Country 2025 & 2033
- Figure 14: Asia Pacific Vinyl Acetate Industry Volume Share (%), by Country 2025 & 2033
- Figure 15: North America Vinyl Acetate Industry Revenue (billion), by Application 2025 & 2033
- Figure 16: North America Vinyl Acetate Industry Volume (K Tons), by Application 2025 & 2033
- Figure 17: North America Vinyl Acetate Industry Revenue Share (%), by Application 2025 & 2033
- Figure 18: North America Vinyl Acetate Industry Volume Share (%), by Application 2025 & 2033
- Figure 19: North America Vinyl Acetate Industry Revenue (billion), by End-user Industry 2025 & 2033
- Figure 20: North America Vinyl Acetate Industry Volume (K Tons), by End-user Industry 2025 & 2033
- Figure 21: North America Vinyl Acetate Industry Revenue Share (%), by End-user Industry 2025 & 2033
- Figure 22: North America Vinyl Acetate Industry Volume Share (%), by End-user Industry 2025 & 2033
- Figure 23: North America Vinyl Acetate Industry Revenue (billion), by Country 2025 & 2033
- Figure 24: North America Vinyl Acetate Industry Volume (K Tons), by Country 2025 & 2033
- Figure 25: North America Vinyl Acetate Industry Revenue Share (%), by Country 2025 & 2033
- Figure 26: North America Vinyl Acetate Industry Volume Share (%), by Country 2025 & 2033
- Figure 27: Europe Vinyl Acetate Industry Revenue (billion), by Application 2025 & 2033
- Figure 28: Europe Vinyl Acetate Industry Volume (K Tons), by Application 2025 & 2033
- Figure 29: Europe Vinyl Acetate Industry Revenue Share (%), by Application 2025 & 2033
- Figure 30: Europe Vinyl Acetate Industry Volume Share (%), by Application 2025 & 2033
- Figure 31: Europe Vinyl Acetate Industry Revenue (billion), by End-user Industry 2025 & 2033
- Figure 32: Europe Vinyl Acetate Industry Volume (K Tons), by End-user Industry 2025 & 2033
- Figure 33: Europe Vinyl Acetate Industry Revenue Share (%), by End-user Industry 2025 & 2033
- Figure 34: Europe Vinyl Acetate Industry Volume Share (%), by End-user Industry 2025 & 2033
- Figure 35: Europe Vinyl Acetate Industry Revenue (billion), by Country 2025 & 2033
- Figure 36: Europe Vinyl Acetate Industry Volume (K Tons), by Country 2025 & 2033
- Figure 37: Europe Vinyl Acetate Industry Revenue Share (%), by Country 2025 & 2033
- Figure 38: Europe Vinyl Acetate Industry Volume Share (%), by Country 2025 & 2033
- Figure 39: South America Vinyl Acetate Industry Revenue (billion), by Application 2025 & 2033
- Figure 40: South America Vinyl Acetate Industry Volume (K Tons), by Application 2025 & 2033
- Figure 41: South America Vinyl Acetate Industry Revenue Share (%), by Application 2025 & 2033
- Figure 42: South America Vinyl Acetate Industry Volume Share (%), by Application 2025 & 2033
- Figure 43: South America Vinyl Acetate Industry Revenue (billion), by End-user Industry 2025 & 2033
- Figure 44: South America Vinyl Acetate Industry Volume (K Tons), by End-user Industry 2025 & 2033
- Figure 45: South America Vinyl Acetate Industry Revenue Share (%), by End-user Industry 2025 & 2033
- Figure 46: South America Vinyl Acetate Industry Volume Share (%), by End-user Industry 2025 & 2033
- Figure 47: South America Vinyl Acetate Industry Revenue (billion), by Country 2025 & 2033
- Figure 48: South America Vinyl Acetate Industry Volume (K Tons), by Country 2025 & 2033
- Figure 49: South America Vinyl Acetate Industry Revenue Share (%), by Country 2025 & 2033
- Figure 50: South America Vinyl Acetate Industry Volume Share (%), by Country 2025 & 2033
- Figure 51: Middle East and Africa Vinyl Acetate Industry Revenue (billion), by Application 2025 & 2033
- Figure 52: Middle East and Africa Vinyl Acetate Industry Volume (K Tons), by Application 2025 & 2033
- Figure 53: Middle East and Africa Vinyl Acetate Industry Revenue Share (%), by Application 2025 & 2033
- Figure 54: Middle East and Africa Vinyl Acetate Industry Volume Share (%), by Application 2025 & 2033
- Figure 55: Middle East and Africa Vinyl Acetate Industry Revenue (billion), by End-user Industry 2025 & 2033
- Figure 56: Middle East and Africa Vinyl Acetate Industry Volume (K Tons), by End-user Industry 2025 & 2033
- Figure 57: Middle East and Africa Vinyl Acetate Industry Revenue Share (%), by End-user Industry 2025 & 2033
- Figure 58: Middle East and Africa Vinyl Acetate Industry Volume Share (%), by End-user Industry 2025 & 2033
- Figure 59: Middle East and Africa Vinyl Acetate Industry Revenue (billion), by Country 2025 & 2033
- Figure 60: Middle East and Africa Vinyl Acetate Industry Volume (K Tons), by Country 2025 & 2033
- Figure 61: Middle East and Africa Vinyl Acetate Industry Revenue Share (%), by Country 2025 & 2033
- Figure 62: Middle East and Africa Vinyl Acetate Industry Volume Share (%), by Country 2025 & 2033
List of Tables
- Table 1: Global Vinyl Acetate Industry Revenue billion Forecast, by Application 2020 & 2033
- Table 2: Global Vinyl Acetate Industry Volume K Tons Forecast, by Application 2020 & 2033
- Table 3: Global Vinyl Acetate Industry Revenue billion Forecast, by End-user Industry 2020 & 2033
- Table 4: Global Vinyl Acetate Industry Volume K Tons Forecast, by End-user Industry 2020 & 2033
- Table 5: Global Vinyl Acetate Industry Revenue billion Forecast, by Region 2020 & 2033
- Table 6: Global Vinyl Acetate Industry Volume K Tons Forecast, by Region 2020 & 2033
- Table 7: Global Vinyl Acetate Industry Revenue billion Forecast, by Application 2020 & 2033
- Table 8: Global Vinyl Acetate Industry Volume K Tons Forecast, by Application 2020 & 2033
- Table 9: Global Vinyl Acetate Industry Revenue billion Forecast, by End-user Industry 2020 & 2033
- Table 10: Global Vinyl Acetate Industry Volume K Tons Forecast, by End-user Industry 2020 & 2033
- Table 11: Global Vinyl Acetate Industry Revenue billion Forecast, by Country 2020 & 2033
- Table 12: Global Vinyl Acetate Industry Volume K Tons Forecast, by Country 2020 & 2033
- Table 13: China Vinyl Acetate Industry Revenue (billion) Forecast, by Application 2020 & 2033
- Table 14: China Vinyl Acetate Industry Volume (K Tons) Forecast, by Application 2020 & 2033
- Table 15: India Vinyl Acetate Industry Revenue (billion) Forecast, by Application 2020 & 2033
- Table 16: India Vinyl Acetate Industry Volume (K Tons) Forecast, by Application 2020 & 2033
- Table 17: Japan Vinyl Acetate Industry Revenue (billion) Forecast, by Application 2020 & 2033
- Table 18: Japan Vinyl Acetate Industry Volume (K Tons) Forecast, by Application 2020 & 2033
- Table 19: South Korea Vinyl Acetate Industry Revenue (billion) Forecast, by Application 2020 & 2033
- Table 20: South Korea Vinyl Acetate Industry Volume (K Tons) Forecast, by Application 2020 & 2033
- Table 21: Rest of Asia Pacific Vinyl Acetate Industry Revenue (billion) Forecast, by Application 2020 & 2033
- Table 22: Rest of Asia Pacific Vinyl Acetate Industry Volume (K Tons) Forecast, by Application 2020 & 2033
- Table 23: Global Vinyl Acetate Industry Revenue billion Forecast, by Application 2020 & 2033
- Table 24: Global Vinyl Acetate Industry Volume K Tons Forecast, by Application 2020 & 2033
- Table 25: Global Vinyl Acetate Industry Revenue billion Forecast, by End-user Industry 2020 & 2033
- Table 26: Global Vinyl Acetate Industry Volume K Tons Forecast, by End-user Industry 2020 & 2033
- Table 27: Global Vinyl Acetate Industry Revenue billion Forecast, by Country 2020 & 2033
- Table 28: Global Vinyl Acetate Industry Volume K Tons Forecast, by Country 2020 & 2033
- Table 29: United States Vinyl Acetate Industry Revenue (billion) Forecast, by Application 2020 & 2033
- Table 30: United States Vinyl Acetate Industry Volume (K Tons) Forecast, by Application 2020 & 2033
- Table 31: Canada Vinyl Acetate Industry Revenue (billion) Forecast, by Application 2020 & 2033
- Table 32: Canada Vinyl Acetate Industry Volume (K Tons) Forecast, by Application 2020 & 2033
- Table 33: Mexico Vinyl Acetate Industry Revenue (billion) Forecast, by Application 2020 & 2033
- Table 34: Mexico Vinyl Acetate Industry Volume (K Tons) Forecast, by Application 2020 & 2033
- Table 35: Global Vinyl Acetate Industry Revenue billion Forecast, by Application 2020 & 2033
- Table 36: Global Vinyl Acetate Industry Volume K Tons Forecast, by Application 2020 & 2033
- Table 37: Global Vinyl Acetate Industry Revenue billion Forecast, by End-user Industry 2020 & 2033
- Table 38: Global Vinyl Acetate Industry Volume K Tons Forecast, by End-user Industry 2020 & 2033
- Table 39: Global Vinyl Acetate Industry Revenue billion Forecast, by Country 2020 & 2033
- Table 40: Global Vinyl Acetate Industry Volume K Tons Forecast, by Country 2020 & 2033
- Table 41: Germany Vinyl Acetate Industry Revenue (billion) Forecast, by Application 2020 & 2033
- Table 42: Germany Vinyl Acetate Industry Volume (K Tons) Forecast, by Application 2020 & 2033
- Table 43: United Kingdom Vinyl Acetate Industry Revenue (billion) Forecast, by Application 2020 & 2033
- Table 44: United Kingdom Vinyl Acetate Industry Volume (K Tons) Forecast, by Application 2020 & 2033
- Table 45: Italy Vinyl Acetate Industry Revenue (billion) Forecast, by Application 2020 & 2033
- Table 46: Italy Vinyl Acetate Industry Volume (K Tons) Forecast, by Application 2020 & 2033
- Table 47: Russia Vinyl Acetate Industry Revenue (billion) Forecast, by Application 2020 & 2033
- Table 48: Russia Vinyl Acetate Industry Volume (K Tons) Forecast, by Application 2020 & 2033
- Table 49: France Vinyl Acetate Industry Revenue (billion) Forecast, by Application 2020 & 2033
- Table 50: France Vinyl Acetate Industry Volume (K Tons) Forecast, by Application 2020 & 2033
- Table 51: Rest of Europe Vinyl Acetate Industry Revenue (billion) Forecast, by Application 2020 & 2033
- Table 52: Rest of Europe Vinyl Acetate Industry Volume (K Tons) Forecast, by Application 2020 & 2033
- Table 53: Global Vinyl Acetate Industry Revenue billion Forecast, by Application 2020 & 2033
- Table 54: Global Vinyl Acetate Industry Volume K Tons Forecast, by Application 2020 & 2033
- Table 55: Global Vinyl Acetate Industry Revenue billion Forecast, by End-user Industry 2020 & 2033
- Table 56: Global Vinyl Acetate Industry Volume K Tons Forecast, by End-user Industry 2020 & 2033
- Table 57: Global Vinyl Acetate Industry Revenue billion Forecast, by Country 2020 & 2033
- Table 58: Global Vinyl Acetate Industry Volume K Tons Forecast, by Country 2020 & 2033
- Table 59: Brazil Vinyl Acetate Industry Revenue (billion) Forecast, by Application 2020 & 2033
- Table 60: Brazil Vinyl Acetate Industry Volume (K Tons) Forecast, by Application 2020 & 2033
- Table 61: Argentina Vinyl Acetate Industry Revenue (billion) Forecast, by Application 2020 & 2033
- Table 62: Argentina Vinyl Acetate Industry Volume (K Tons) Forecast, by Application 2020 & 2033
- Table 63: Rest of South America Vinyl Acetate Industry Revenue (billion) Forecast, by Application 2020 & 2033
- Table 64: Rest of South America Vinyl Acetate Industry Volume (K Tons) Forecast, by Application 2020 & 2033
- Table 65: Global Vinyl Acetate Industry Revenue billion Forecast, by Application 2020 & 2033
- Table 66: Global Vinyl Acetate Industry Volume K Tons Forecast, by Application 2020 & 2033
- Table 67: Global Vinyl Acetate Industry Revenue billion Forecast, by End-user Industry 2020 & 2033
- Table 68: Global Vinyl Acetate Industry Volume K Tons Forecast, by End-user Industry 2020 & 2033
- Table 69: Global Vinyl Acetate Industry Revenue billion Forecast, by Country 2020 & 2033
- Table 70: Global Vinyl Acetate Industry Volume K Tons Forecast, by Country 2020 & 2033
- Table 71: Saudi Arabia Vinyl Acetate Industry Revenue (billion) Forecast, by Application 2020 & 2033
- Table 72: Saudi Arabia Vinyl Acetate Industry Volume (K Tons) Forecast, by Application 2020 & 2033
- Table 73: South Africa Vinyl Acetate Industry Revenue (billion) Forecast, by Application 2020 & 2033
- Table 74: South Africa Vinyl Acetate Industry Volume (K Tons) Forecast, by Application 2020 & 2033
- Table 75: Rest of Middle East and Africa Vinyl Acetate Industry Revenue (billion) Forecast, by Application 2020 & 2033
- Table 76: Rest of Middle East and Africa Vinyl Acetate Industry Volume (K Tons) Forecast, by Application 2020 & 2033
Frequently Asked Questions
1. What is the projected Compound Annual Growth Rate (CAGR) of the Vinyl Acetate Industry?
The projected CAGR is approximately 5.47%.
2. Which companies are prominent players in the Vinyl Acetate Industry?
Key companies in the market include Nippon Chemical Industrial CO LTD, Arkema, DCC, China Petrochemical Corporation, Exxon Mobil Corporation, INEOS, Celanese Corporation, Kemipex, LyondellBasell Industries Holdings B V, CLARIANT, Sipchem Company, Wacker Chemie AG, Innospec.
3. What are the main segments of the Vinyl Acetate Industry?
The market segments include Application, End-user Industry.
4. Can you provide details about the market size?
The market size is estimated to be USD 1.97 billion as of 2022.
5. What are some drivers contributing to market growth?
Increased Use of Adhesives in Food Packaging; Increasing Use in the Solar Power Generation Industry.
6. What are the notable trends driving market growth?
Increasing Demand from the Solar Industry.
7. Are there any restraints impacting market growth?
Stringent Health and Environmental Regulations; Other Restraints.
8. Can you provide examples of recent developments in the market?
February 2023: Celanese Corporation announced the completion of an ultra-low capital initiative to repurpose existing manufacturing and infrastructure assets to enable extra ethylene vinyl acetate (EVA) capacity at its Edmonton, Alberta site. The development will help the Acetyl Chain's downstream vinyl offering expand significantly.
9. What pricing options are available for accessing the report?
Pricing options include single-user, multi-user, and enterprise licenses priced at USD 4750, USD 5250, and USD 8750 respectively.
10. Is the market size provided in terms of value or volume?
The market size is provided in terms of value, measured in billion and volume, measured in K Tons.
11. Are there any specific market keywords associated with the report?
Yes, the market keyword associated with the report is "Vinyl Acetate Industry," which aids in identifying and referencing the specific market segment covered.
12. How do I determine which pricing option suits my needs best?
The pricing options vary based on user requirements and access needs. Individual users may opt for single-user licenses, while businesses requiring broader access may choose multi-user or enterprise licenses for cost-effective access to the report.
13. Are there any additional resources or data provided in the Vinyl Acetate Industry report?
While the report offers comprehensive insights, it's advisable to review the specific contents or supplementary materials provided to ascertain if additional resources or data are available.
14. How can I stay updated on further developments or reports in the Vinyl Acetate Industry?
To stay informed about further developments, trends, and reports in the Vinyl Acetate Industry, consider subscribing to industry newsletters, following relevant companies and organizations, or regularly checking reputable industry news sources and publications.
Methodology
Step 1 - Identification of Relevant Samples Size from Population Database


Step 2 - Approaches for Defining Global Market Size (Value, Volume* & Price*)

Note*: In applicable scenarios
Step 3 - Data Sources
Primary Research
- Web Analytics
- Survey Reports
- Research Institute
- Latest Research Reports
- Opinion Leaders
Secondary Research
- Annual Reports
- White Paper
- Latest Press Release
- Industry Association
- Paid Database
- Investor Presentations

Step 4 - Data Triangulation
Involves using different sources of information in order to increase the validity of a study
These sources are likely to be stakeholders in a program - participants, other researchers, program staff, other community members, and so on.
Then we put all data in single framework & apply various statistical tools to find out the dynamic on the market.
During the analysis stage, feedback from the stakeholder groups would be compared to determine areas of agreement as well as areas of divergence