

Key Insights
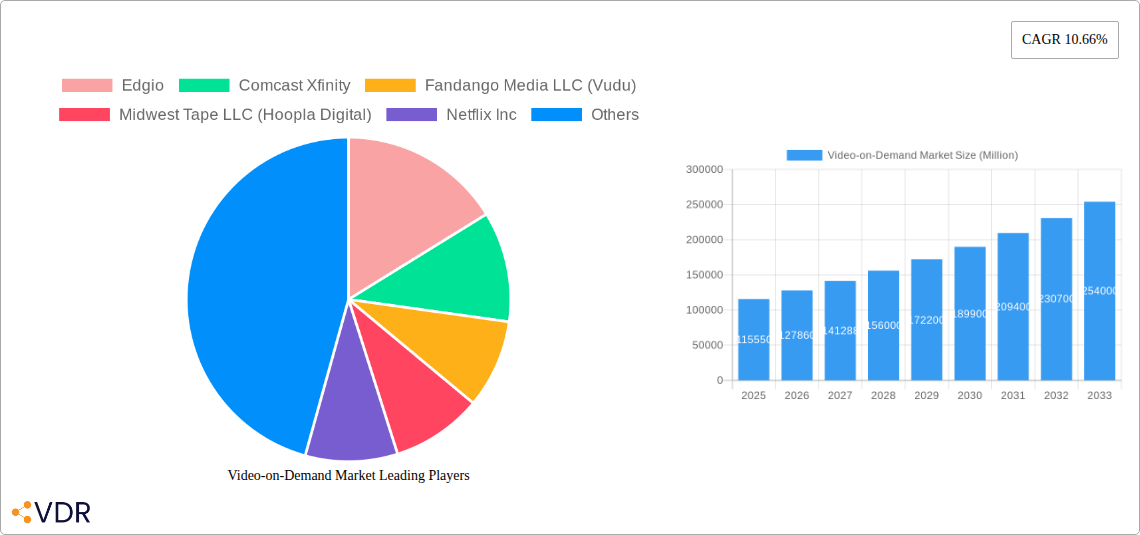
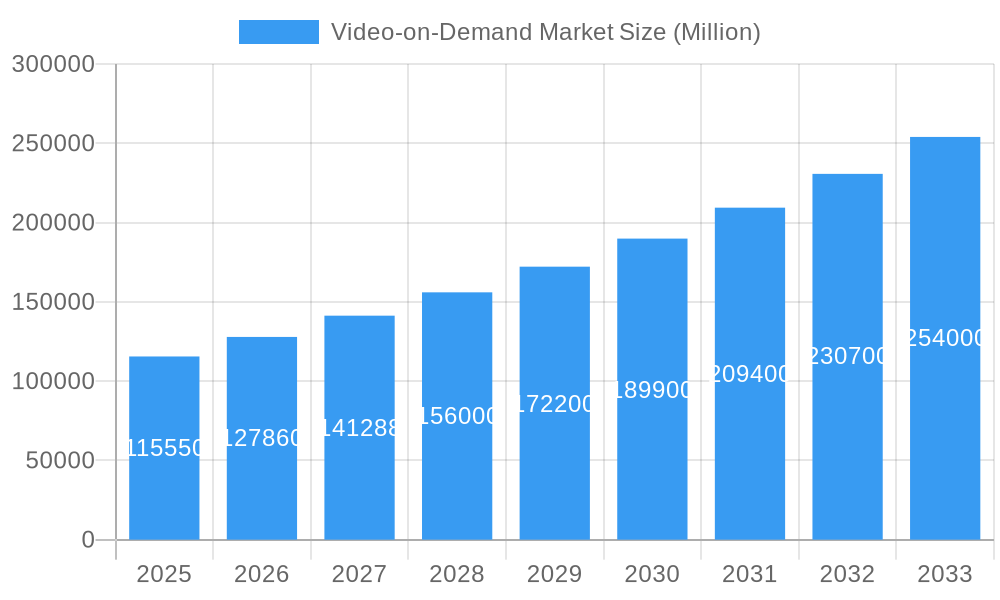
The Video-on-Demand (VOD) market, valued at $115.55 billion in 2025, is projected to experience robust growth, fueled by a Compound Annual Growth Rate (CAGR) of 10.66% from 2025 to 2033. This expansion is driven by several key factors. The increasing adoption of high-speed internet and affordable mobile data plans globally has made streaming accessible to a wider audience. Consumer preference is shifting towards on-demand content consumption, offering flexibility and convenience unmatched by traditional television. Technological advancements, such as improved streaming quality (4K, HDR), personalized recommendations, and interactive features, further enhance the user experience and drive market growth. The rise of original content from streaming giants like Netflix and Disney+ is also crucial, fostering intense competition and pushing innovation. While the market is dominated by Subscription Video-on-Demand (SVoD) services, the Transactional Video-on-Demand (TVoD) segment is experiencing healthy growth, catering to consumers who prefer individual purchases over subscriptions. Geographic expansion into emerging markets presents significant opportunities for growth.
Video-on-Demand Market Market Size (In Billion)
However, the VOD market faces certain challenges. Content piracy remains a significant threat, impacting revenue streams for content creators and distributors. The increasing competition among numerous players necessitates continuous innovation in content creation and user experience to maintain market share. Regulatory changes surrounding data privacy and content licensing can also create uncertainties. Furthermore, economic downturns and inflation can impact consumer spending on entertainment, potentially slowing down market growth. Despite these restraints, the overall outlook for the VOD market remains positive, with continued technological advancements and expanding consumer demand expected to drive significant growth over the forecast period. The diversification of business models, encompassing SVoD, TVoD, and other emerging models, ensures adaptability and resilience within this dynamic market. Competition among established players and emerging newcomers continues to fuel innovation, benefiting the end consumer.
Video-on-Demand Market Company Market Share
Video-on-Demand Market Report: 2019-2033
This comprehensive report provides an in-depth analysis of the Video-on-Demand (VOD) market, encompassing its evolution, current state, and future trajectory from 2019 to 2033. We dissect the market dynamics, growth trends, dominant players, and emerging opportunities within the parent market of digital media and its child market of online entertainment. The report leverages extensive data analysis to offer actionable insights for industry professionals, investors, and strategic decision-makers. The base year is 2025, with estimations for 2025 and forecasts extending to 2033, covering the historical period of 2019-2024. Market values are presented in million units.
Video-on-Demand Market Dynamics & Structure
The Video-on-Demand market is characterized by high competition and rapid technological advancements. Market concentration is moderate, with a few dominant players alongside numerous niche providers. Technological innovation, driven by advancements in streaming technology, AI-powered recommendations, and immersive viewing experiences, is a key driver. Regulatory frameworks governing content licensing, data privacy, and net neutrality significantly impact market operations. The rise of other entertainment options like live streaming and gaming creates competitive product substitutes. End-user demographics are diversifying, with growing adoption across age groups and geographic locations. M&A activity has been robust, with larger players acquiring smaller companies to expand their content libraries and technological capabilities. The total number of M&A deals from 2019 to 2024 was approximately xx.
- Market Concentration: Moderate, with a few major players holding significant market share (xx% combined for top 5 players).
- Innovation Drivers: Advancements in streaming technologies (e.g., adaptive bitrate streaming), AI-powered personalization, and immersive video formats (e.g., VR/AR).
- Regulatory Landscape: Evolving regulations related to content licensing, data privacy (GDPR, CCPA), and net neutrality.
- Competitive Substitutes: Live streaming platforms, gaming platforms, and traditional television.
- End-User Demographics: Expanding across age groups and geographic regions, with a strong growth in millennial and Gen Z audiences.
- M&A Trends: Significant activity, with larger companies acquiring smaller players to expand content libraries and technology.
Video-on-Demand Market Growth Trends & Insights
The Video-on-Demand market has witnessed remarkable growth over the past few years, driven by increasing internet penetration, the proliferation of smart devices, and evolving consumer preferences. The market size experienced a Compound Annual Growth Rate (CAGR) of xx% during 2019-2024 and is projected to grow at a CAGR of xx% from 2025 to 2033, reaching a market value of xx million by 2033. The adoption rate of VOD services continues to rise, fueled by the convenience and flexibility they offer. Technological disruptions, such as the rise of 4K and 8K streaming, have further propelled market growth. Consumer behavior is shifting towards on-demand content consumption, leading to decreased reliance on traditional television and increased preference for personalized viewing experiences. Market penetration has increased significantly, reaching approximately xx% in 2024, with further expansion expected in the coming years. The shift towards subscription-based models (SVoD) has also significantly influenced the growth trajectory.
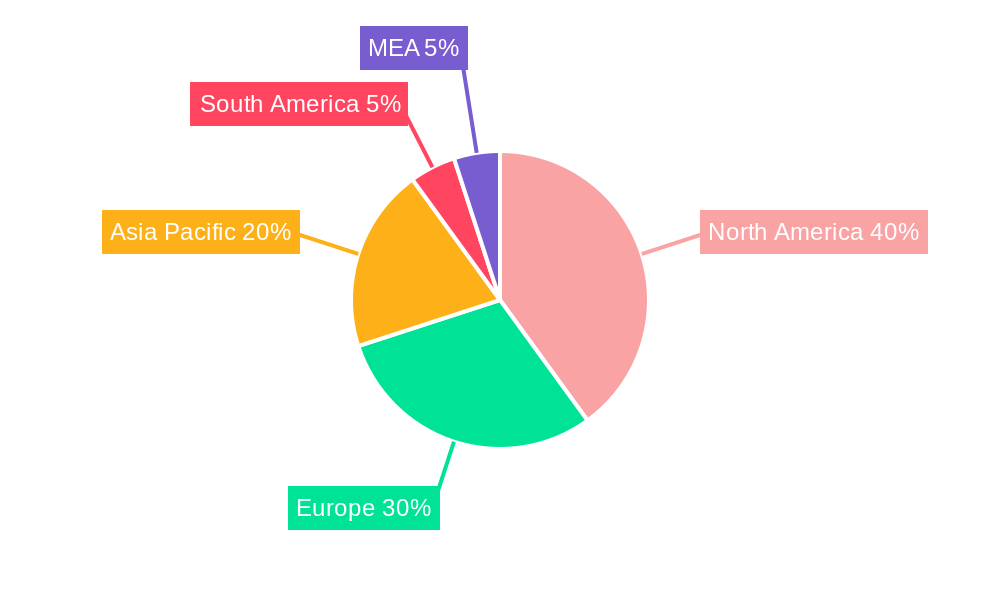
Dominant Regions, Countries, or Segments in Video-on-Demand Market
North America currently holds the largest market share in the Video-on-Demand market, followed by Europe and Asia-Pacific. Within business models, Subscription Video-on-Demand (SVoD) dominates, accounting for xx% of the market in 2024. This is primarily attributed to the convenience and cost-effectiveness of subscription services. Transactional Video-on-Demand (TVoD) holds a smaller but significant share, particularly for newer releases and niche content.
- SVoD Dominance: Driven by affordable subscription plans, vast content libraries, and personalized viewing experiences.
- TVoD Growth: Fueled by demand for premium content and individual movie rentals/purchases.
- Geographic Dominance: North America, followed by Europe and Asia-Pacific, due to higher internet penetration and disposable income.
- Key Drivers: Strong internet infrastructure, rising disposable incomes, increasing smartphone and smart TV penetration, favorable government policies.
Video-on-Demand Market Product Landscape
The Video-on-Demand market offers a diverse range of products and services, including streaming platforms with various subscription models, individual video purchases, and bundled packages. Recent innovations include 4K/8K streaming, HDR (High Dynamic Range) content, Dolby Vision/Atmos support, and personalized recommendation algorithms. These advancements enhance user experience, offering high-quality viewing and tailored content recommendations. The integration of AI and machine learning is refining personalized recommendations and optimizing content delivery.
Key Drivers, Barriers & Challenges in Video-on-Demand Market
Key Drivers:
- Increasing internet penetration and smartphone usage.
- Rising disposable incomes and consumer spending on entertainment.
- Growing preference for on-demand content consumption.
- Advancements in streaming technology and content creation.
Challenges:
- Intense competition among numerous streaming platforms.
- High content acquisition costs and licensing fees.
- Regulatory hurdles and content restrictions in certain markets.
- Data security and privacy concerns related to user data.
- The challenge of combating piracy.
Emerging Opportunities in Video-on-Demand Market
- Expansion into emerging markets with high internet penetration growth.
- Development of personalized and interactive viewing experiences.
- Integration of VR/AR technologies to enhance content engagement.
- Focus on niche content and niche audiences.
- Growth of mobile-first video consumption.
Growth Accelerators in the Video-on-Demand Market Industry
Technological advancements, such as improved compression algorithms, and enhanced streaming capabilities, are key growth accelerators. Strategic partnerships between content creators, distributors, and technology providers expand reach and accessibility. Market expansion into under-served regions and the development of innovative business models, such as advertising-supported VOD (AVOD), further stimulate market growth.
Key Players Shaping the Video-on-Demand Market Market
- Edgio
- Comcast Xfinity
- Fandango Media LLC (Vudu)
- Midwest Tape LLC (Hoopla Digital)
- Netflix Inc
- DirecTV
- Vubiquity Inc
- The Walt Disney Company (Disney+)
- DISH Network LLC
- Dacast Inc
- Wistia Inc
- Warner Bros Discovery Inc
- Novi Digital Entertainment Private Limited (Hotstar)
- Hulu LLC
- Fujitsu
- Amazon com Inc (Amazon Prime Video)
- Kaltura
- Popcornflix LLC
- Apple Inc
- Zee Entertainment Enterprises Ltd (Zee5)
Notable Milestones in Video-on-Demand Market Sector
- June 2022: Amazon Prime Video partnered with AMC Networks to offer its content through Prime Video Channels in India.
- January 2023: FOX Entertainment and Hulu announced a multi-year content partnership, expanding Hulu's programming schedule.
In-Depth Video-on-Demand Market Market Outlook
The future of the Video-on-Demand market is promising, with continued growth fueled by technological advancements, increasing consumer demand, and expansion into new markets. Strategic partnerships and the development of innovative business models will further shape the market landscape. The focus on personalized viewing experiences and the integration of emerging technologies will drive market expansion, creating numerous strategic opportunities for industry players.
Video-on-Demand Market Segmentation
-
1. Business Model
- 1.1. Subscription Video-on-demand (SVoD)
- 1.2. Transactional Video-on-demand (TVoD)
- 1.3. Other Business Models
-
2. End-User
- 2.1. Consumers
- 2.2. Enterprises
-
3. Device Type
- 3.1. Smartphones
- 3.2. Tablets
- 3.3. TVs
-
4. Content Type
- 4.1. Movies
- 4.2. TV Shows
- 4.3. Sports
Video-on-Demand Market Segmentation By Geography
- 1. North America
- 2. Europe
- 3. Asia Pacific
- 4. Middle East and Africa
- 5. Rest of the World
Video-on-Demand Market Regional Market Share
Geographic Coverage of Video-on-Demand Market
Video-on-Demand Market REPORT HIGHLIGHTS
| Aspects | Details |
|---|---|
| Study Period | 2020-2034 |
| Base Year | 2025 |
| Estimated Year | 2026 |
| Forecast Period | 2026-2034 |
| Historical Period | 2020-2025 |
| Growth Rate | CAGR of 10.66% from 2020-2034 |
| Segmentation |
|
Table of Contents
- 1. Introduction
- 1.1. Research Scope
- 1.2. Market Segmentation
- 1.3. Research Objective
- 1.4. Definitions and Assumptions
- 2. Executive Summary
- 2.1. Market Snapshot
- 3. Market Dynamics
- 3.1. Market Drivers
- 3.2. Market Restrains
- 3.3. Market Trends
- 3.4. Market Opportunities
- 4. Market Factor Analysis
- 4.1. Porters Five Forces
- 4.1.1. Bargaining Power of Suppliers
- 4.1.2. Bargaining Power of Buyers
- 4.1.3. Threat of New Entrants
- 4.1.4. Threat of Substitutes
- 4.1.5. Competitive Rivalry
- 4.2. PESTEL analysis
- 4.3. BCG Analysis
- 4.3.1. Stars (High Growth, High Market Share)
- 4.3.2. Cash Cows (Low Growth, High Market Share)
- 4.3.3. Question Mark (High Growth, Low Market Share)
- 4.3.4. Dogs (Low Growth, Low Market Share)
- 4.4. Ansoff Matrix Analysis
- 4.5. Supply Chain Analysis
- 4.6. Regulatory Landscape
- 4.7. Current Market Potential and Opportunity Assessment (TAM–SAM–SOM Framework)
- 4.8. VDR Analyst Note
- 4.1. Porters Five Forces
- 5. Market Analysis, Insights and Forecast 2021-2033
- 5.1. Market Analysis, Insights and Forecast - by Business Model
- 5.1.1. Subscription Video-on-demand (SVoD)
- 5.1.2. Transactional Video-on-demand (TVoD)
- 5.1.3. Other Business Models
- 5.2. Market Analysis, Insights and Forecast - by End-User
- 5.2.1. Consumers
- 5.2.2. Enterprises
- 5.3. Market Analysis, Insights and Forecast - by Device Type
- 5.3.1. Smartphones
- 5.3.2. Tablets
- 5.3.3. TVs
- 5.4. Market Analysis, Insights and Forecast - by Content Type
- 5.4.1. Movies
- 5.4.2. TV Shows
- 5.4.3. Sports
- 5.5. Market Analysis, Insights and Forecast - by Region
- 5.5.1. North America
- 5.5.2. Europe
- 5.5.3. Asia Pacific
- 5.5.4. Middle East and Africa
- 5.5.5. Rest of the World
- 5.1. Market Analysis, Insights and Forecast - by Business Model
- 6. Global Video-on-Demand Market Analysis, Insights and Forecast, 2021-2033
- 6.1. Market Analysis, Insights and Forecast - by Business Model
- 6.1.1. Subscription Video-on-demand (SVoD)
- 6.1.2. Transactional Video-on-demand (TVoD)
- 6.1.3. Other Business Models
- 6.2. Market Analysis, Insights and Forecast - by End-User
- 6.2.1. Consumers
- 6.2.2. Enterprises
- 6.3. Market Analysis, Insights and Forecast - by Device Type
- 6.3.1. Smartphones
- 6.3.2. Tablets
- 6.3.3. TVs
- 6.4. Market Analysis, Insights and Forecast - by Content Type
- 6.4.1. Movies
- 6.4.2. TV Shows
- 6.4.3. Sports
- 6.1. Market Analysis, Insights and Forecast - by Business Model
- 7. North America Video-on-Demand Market Analysis, Insights and Forecast, 2021-2033
- 7.1. Market Analysis, Insights and Forecast - by Business Model
- 7.1.1. Subscription Video-on-demand (SVoD)
- 7.1.2. Transactional Video-on-demand (TVoD)
- 7.1.3. Other Business Models
- 7.2. Market Analysis, Insights and Forecast - by End-User
- 7.2.1. Consumers
- 7.2.2. Enterprises
- 7.3. Market Analysis, Insights and Forecast - by Device Type
- 7.3.1. Smartphones
- 7.3.2. Tablets
- 7.3.3. TVs
- 7.4. Market Analysis, Insights and Forecast - by Content Type
- 7.4.1. Movies
- 7.4.2. TV Shows
- 7.4.3. Sports
- 7.1. Market Analysis, Insights and Forecast - by Business Model
- 8. Europe Video-on-Demand Market Analysis, Insights and Forecast, 2021-2033
- 8.1. Market Analysis, Insights and Forecast - by Business Model
- 8.1.1. Subscription Video-on-demand (SVoD)
- 8.1.2. Transactional Video-on-demand (TVoD)
- 8.1.3. Other Business Models
- 8.2. Market Analysis, Insights and Forecast - by End-User
- 8.2.1. Consumers
- 8.2.2. Enterprises
- 8.3. Market Analysis, Insights and Forecast - by Device Type
- 8.3.1. Smartphones
- 8.3.2. Tablets
- 8.3.3. TVs
- 8.4. Market Analysis, Insights and Forecast - by Content Type
- 8.4.1. Movies
- 8.4.2. TV Shows
- 8.4.3. Sports
- 8.1. Market Analysis, Insights and Forecast - by Business Model
- 9. Asia Pacific Video-on-Demand Market Analysis, Insights and Forecast, 2021-2033
- 9.1. Market Analysis, Insights and Forecast - by Business Model
- 9.1.1. Subscription Video-on-demand (SVoD)
- 9.1.2. Transactional Video-on-demand (TVoD)
- 9.1.3. Other Business Models
- 9.2. Market Analysis, Insights and Forecast - by End-User
- 9.2.1. Consumers
- 9.2.2. Enterprises
- 9.3. Market Analysis, Insights and Forecast - by Device Type
- 9.3.1. Smartphones
- 9.3.2. Tablets
- 9.3.3. TVs
- 9.4. Market Analysis, Insights and Forecast - by Content Type
- 9.4.1. Movies
- 9.4.2. TV Shows
- 9.4.3. Sports
- 9.1. Market Analysis, Insights and Forecast - by Business Model
- 10. Middle East and Africa Video-on-Demand Market Analysis, Insights and Forecast, 2021-2033
- 10.1. Market Analysis, Insights and Forecast - by Business Model
- 10.1.1. Subscription Video-on-demand (SVoD)
- 10.1.2. Transactional Video-on-demand (TVoD)
- 10.1.3. Other Business Models
- 10.2. Market Analysis, Insights and Forecast - by End-User
- 10.2.1. Consumers
- 10.2.2. Enterprises
- 10.3. Market Analysis, Insights and Forecast - by Device Type
- 10.3.1. Smartphones
- 10.3.2. Tablets
- 10.3.3. TVs
- 10.4. Market Analysis, Insights and Forecast - by Content Type
- 10.4.1. Movies
- 10.4.2. TV Shows
- 10.4.3. Sports
- 10.1. Market Analysis, Insights and Forecast - by Business Model
- 11. Rest of the World Video-on-Demand Market Analysis, Insights and Forecast, 2021-2033
- 11.1. Market Analysis, Insights and Forecast - by Business Model
- 11.1.1. Subscription Video-on-demand (SVoD)
- 11.1.2. Transactional Video-on-demand (TVoD)
- 11.1.3. Other Business Models
- 11.2. Market Analysis, Insights and Forecast - by End-User
- 11.2.1. Consumers
- 11.2.2. Enterprises
- 11.3. Market Analysis, Insights and Forecast - by Device Type
- 11.3.1. Smartphones
- 11.3.2. Tablets
- 11.3.3. TVs
- 11.4. Market Analysis, Insights and Forecast - by Content Type
- 11.4.1. Movies
- 11.4.2. TV Shows
- 11.4.3. Sports
- 11.1. Market Analysis, Insights and Forecast - by Business Model
- 12. Competitive Analysis
- 12.1. Company Profiles
- 12.1.1 Edgio
- 12.1.1.1. Company Overview
- 12.1.1.2. Products
- 12.1.1.3. Company Financials
- 12.1.1.4. SWOT Analysis
- 12.1.2 Comcast Xfinity
- 12.1.2.1. Company Overview
- 12.1.2.2. Products
- 12.1.2.3. Company Financials
- 12.1.2.4. SWOT Analysis
- 12.1.3 Fandango Media LLC (Vudu)
- 12.1.3.1. Company Overview
- 12.1.3.2. Products
- 12.1.3.3. Company Financials
- 12.1.3.4. SWOT Analysis
- 12.1.4 Midwest Tape LLC (Hoopla Digital)
- 12.1.4.1. Company Overview
- 12.1.4.2. Products
- 12.1.4.3. Company Financials
- 12.1.4.4. SWOT Analysis
- 12.1.5 Netflix Inc
- 12.1.5.1. Company Overview
- 12.1.5.2. Products
- 12.1.5.3. Company Financials
- 12.1.5.4. SWOT Analysis
- 12.1.6 DirecTV
- 12.1.6.1. Company Overview
- 12.1.6.2. Products
- 12.1.6.3. Company Financials
- 12.1.6.4. SWOT Analysis
- 12.1.7 Vubiquity Inc
- 12.1.7.1. Company Overview
- 12.1.7.2. Products
- 12.1.7.3. Company Financials
- 12.1.7.4. SWOT Analysis
- 12.1.8 The Walt Disney Company (Disney+)
- 12.1.8.1. Company Overview
- 12.1.8.2. Products
- 12.1.8.3. Company Financials
- 12.1.8.4. SWOT Analysis
- 12.1.9 DISH Network LLC
- 12.1.9.1. Company Overview
- 12.1.9.2. Products
- 12.1.9.3. Company Financials
- 12.1.9.4. SWOT Analysis
- 12.1.10 Dacast Inc
- 12.1.10.1. Company Overview
- 12.1.10.2. Products
- 12.1.10.3. Company Financials
- 12.1.10.4. SWOT Analysis
- 12.1.11 Wistia Inc
- 12.1.11.1. Company Overview
- 12.1.11.2. Products
- 12.1.11.3. Company Financials
- 12.1.11.4. SWOT Analysis
- 12.1.12 Warner Bros Discovery Inc
- 12.1.12.1. Company Overview
- 12.1.12.2. Products
- 12.1.12.3. Company Financials
- 12.1.12.4. SWOT Analysis
- 12.1.13 Novi Digital Entertainment Private Limited (Hotstar)
- 12.1.13.1. Company Overview
- 12.1.13.2. Products
- 12.1.13.3. Company Financials
- 12.1.13.4. SWOT Analysis
- 12.1.14 Hulu LLC
- 12.1.14.1. Company Overview
- 12.1.14.2. Products
- 12.1.14.3. Company Financials
- 12.1.14.4. SWOT Analysis
- 12.1.15 Fujitsu
- 12.1.15.1. Company Overview
- 12.1.15.2. Products
- 12.1.15.3. Company Financials
- 12.1.15.4. SWOT Analysis
- 12.1.16 Amazon com Inc (Amazon Prime Video)
- 12.1.16.1. Company Overview
- 12.1.16.2. Products
- 12.1.16.3. Company Financials
- 12.1.16.4. SWOT Analysis
- 12.1.17 Kaltura
- 12.1.17.1. Company Overview
- 12.1.17.2. Products
- 12.1.17.3. Company Financials
- 12.1.17.4. SWOT Analysis
- 12.1.18 Popcornflix LLC
- 12.1.18.1. Company Overview
- 12.1.18.2. Products
- 12.1.18.3. Company Financials
- 12.1.18.4. SWOT Analysis
- 12.1.19 Apple Inc
- 12.1.19.1. Company Overview
- 12.1.19.2. Products
- 12.1.19.3. Company Financials
- 12.1.19.4. SWOT Analysis
- 12.1.20 Zee Entertainment Enterprises Ltd (Zee5)
- 12.1.20.1. Company Overview
- 12.1.20.2. Products
- 12.1.20.3. Company Financials
- 12.1.20.4. SWOT Analysis
- 12.1.1 Edgio
- 12.2. Market Entropy
- 12.2.1 Company's Key Areas Served
- 12.2.2 Recent Developments
- 12.3. Company Market Share Analysis 2025
- 12.3.1 Top 5 Companies Market Share Analysis
- 12.3.2 Top 3 Companies Market Share Analysis
- 12.4. List of Potential Customers
- 13. Research Methodology
List of Figures
- Figure 1: Global Video-on-Demand Market Revenue Breakdown (Million, %) by Region 2025 & 2033
- Figure 2: Global Video-on-Demand Market Volume Breakdown (K Unit, %) by Region 2025 & 2033
- Figure 3: North America Video-on-Demand Market Revenue (Million), by Business Model 2025 & 2033
- Figure 4: North America Video-on-Demand Market Volume (K Unit), by Business Model 2025 & 2033
- Figure 5: North America Video-on-Demand Market Revenue Share (%), by Business Model 2025 & 2033
- Figure 6: North America Video-on-Demand Market Volume Share (%), by Business Model 2025 & 2033
- Figure 7: North America Video-on-Demand Market Revenue (Million), by End-User 2025 & 2033
- Figure 8: North America Video-on-Demand Market Volume (K Unit), by End-User 2025 & 2033
- Figure 9: North America Video-on-Demand Market Revenue Share (%), by End-User 2025 & 2033
- Figure 10: North America Video-on-Demand Market Volume Share (%), by End-User 2025 & 2033
- Figure 11: North America Video-on-Demand Market Revenue (Million), by Device Type 2025 & 2033
- Figure 12: North America Video-on-Demand Market Volume (K Unit), by Device Type 2025 & 2033
- Figure 13: North America Video-on-Demand Market Revenue Share (%), by Device Type 2025 & 2033
- Figure 14: North America Video-on-Demand Market Volume Share (%), by Device Type 2025 & 2033
- Figure 15: North America Video-on-Demand Market Revenue (Million), by Content Type 2025 & 2033
- Figure 16: North America Video-on-Demand Market Volume (K Unit), by Content Type 2025 & 2033
- Figure 17: North America Video-on-Demand Market Revenue Share (%), by Content Type 2025 & 2033
- Figure 18: North America Video-on-Demand Market Volume Share (%), by Content Type 2025 & 2033
- Figure 19: North America Video-on-Demand Market Revenue (Million), by Country 2025 & 2033
- Figure 20: North America Video-on-Demand Market Volume (K Unit), by Country 2025 & 2033
- Figure 21: North America Video-on-Demand Market Revenue Share (%), by Country 2025 & 2033
- Figure 22: North America Video-on-Demand Market Volume Share (%), by Country 2025 & 2033
- Figure 23: Europe Video-on-Demand Market Revenue (Million), by Business Model 2025 & 2033
- Figure 24: Europe Video-on-Demand Market Volume (K Unit), by Business Model 2025 & 2033
- Figure 25: Europe Video-on-Demand Market Revenue Share (%), by Business Model 2025 & 2033
- Figure 26: Europe Video-on-Demand Market Volume Share (%), by Business Model 2025 & 2033
- Figure 27: Europe Video-on-Demand Market Revenue (Million), by End-User 2025 & 2033
- Figure 28: Europe Video-on-Demand Market Volume (K Unit), by End-User 2025 & 2033
- Figure 29: Europe Video-on-Demand Market Revenue Share (%), by End-User 2025 & 2033
- Figure 30: Europe Video-on-Demand Market Volume Share (%), by End-User 2025 & 2033
- Figure 31: Europe Video-on-Demand Market Revenue (Million), by Device Type 2025 & 2033
- Figure 32: Europe Video-on-Demand Market Volume (K Unit), by Device Type 2025 & 2033
- Figure 33: Europe Video-on-Demand Market Revenue Share (%), by Device Type 2025 & 2033
- Figure 34: Europe Video-on-Demand Market Volume Share (%), by Device Type 2025 & 2033
- Figure 35: Europe Video-on-Demand Market Revenue (Million), by Content Type 2025 & 2033
- Figure 36: Europe Video-on-Demand Market Volume (K Unit), by Content Type 2025 & 2033
- Figure 37: Europe Video-on-Demand Market Revenue Share (%), by Content Type 2025 & 2033
- Figure 38: Europe Video-on-Demand Market Volume Share (%), by Content Type 2025 & 2033
- Figure 39: Europe Video-on-Demand Market Revenue (Million), by Country 2025 & 2033
- Figure 40: Europe Video-on-Demand Market Volume (K Unit), by Country 2025 & 2033
- Figure 41: Europe Video-on-Demand Market Revenue Share (%), by Country 2025 & 2033
- Figure 42: Europe Video-on-Demand Market Volume Share (%), by Country 2025 & 2033
- Figure 43: Asia Pacific Video-on-Demand Market Revenue (Million), by Business Model 2025 & 2033
- Figure 44: Asia Pacific Video-on-Demand Market Volume (K Unit), by Business Model 2025 & 2033
- Figure 45: Asia Pacific Video-on-Demand Market Revenue Share (%), by Business Model 2025 & 2033
- Figure 46: Asia Pacific Video-on-Demand Market Volume Share (%), by Business Model 2025 & 2033
- Figure 47: Asia Pacific Video-on-Demand Market Revenue (Million), by End-User 2025 & 2033
- Figure 48: Asia Pacific Video-on-Demand Market Volume (K Unit), by End-User 2025 & 2033
- Figure 49: Asia Pacific Video-on-Demand Market Revenue Share (%), by End-User 2025 & 2033
- Figure 50: Asia Pacific Video-on-Demand Market Volume Share (%), by End-User 2025 & 2033
- Figure 51: Asia Pacific Video-on-Demand Market Revenue (Million), by Device Type 2025 & 2033
- Figure 52: Asia Pacific Video-on-Demand Market Volume (K Unit), by Device Type 2025 & 2033
- Figure 53: Asia Pacific Video-on-Demand Market Revenue Share (%), by Device Type 2025 & 2033
- Figure 54: Asia Pacific Video-on-Demand Market Volume Share (%), by Device Type 2025 & 2033
- Figure 55: Asia Pacific Video-on-Demand Market Revenue (Million), by Content Type 2025 & 2033
- Figure 56: Asia Pacific Video-on-Demand Market Volume (K Unit), by Content Type 2025 & 2033
- Figure 57: Asia Pacific Video-on-Demand Market Revenue Share (%), by Content Type 2025 & 2033
- Figure 58: Asia Pacific Video-on-Demand Market Volume Share (%), by Content Type 2025 & 2033
- Figure 59: Asia Pacific Video-on-Demand Market Revenue (Million), by Country 2025 & 2033
- Figure 60: Asia Pacific Video-on-Demand Market Volume (K Unit), by Country 2025 & 2033
- Figure 61: Asia Pacific Video-on-Demand Market Revenue Share (%), by Country 2025 & 2033
- Figure 62: Asia Pacific Video-on-Demand Market Volume Share (%), by Country 2025 & 2033
- Figure 63: Middle East and Africa Video-on-Demand Market Revenue (Million), by Business Model 2025 & 2033
- Figure 64: Middle East and Africa Video-on-Demand Market Volume (K Unit), by Business Model 2025 & 2033
- Figure 65: Middle East and Africa Video-on-Demand Market Revenue Share (%), by Business Model 2025 & 2033
- Figure 66: Middle East and Africa Video-on-Demand Market Volume Share (%), by Business Model 2025 & 2033
- Figure 67: Middle East and Africa Video-on-Demand Market Revenue (Million), by End-User 2025 & 2033
- Figure 68: Middle East and Africa Video-on-Demand Market Volume (K Unit), by End-User 2025 & 2033
- Figure 69: Middle East and Africa Video-on-Demand Market Revenue Share (%), by End-User 2025 & 2033
- Figure 70: Middle East and Africa Video-on-Demand Market Volume Share (%), by End-User 2025 & 2033
- Figure 71: Middle East and Africa Video-on-Demand Market Revenue (Million), by Device Type 2025 & 2033
- Figure 72: Middle East and Africa Video-on-Demand Market Volume (K Unit), by Device Type 2025 & 2033
- Figure 73: Middle East and Africa Video-on-Demand Market Revenue Share (%), by Device Type 2025 & 2033
- Figure 74: Middle East and Africa Video-on-Demand Market Volume Share (%), by Device Type 2025 & 2033
- Figure 75: Middle East and Africa Video-on-Demand Market Revenue (Million), by Content Type 2025 & 2033
- Figure 76: Middle East and Africa Video-on-Demand Market Volume (K Unit), by Content Type 2025 & 2033
- Figure 77: Middle East and Africa Video-on-Demand Market Revenue Share (%), by Content Type 2025 & 2033
- Figure 78: Middle East and Africa Video-on-Demand Market Volume Share (%), by Content Type 2025 & 2033
- Figure 79: Middle East and Africa Video-on-Demand Market Revenue (Million), by Country 2025 & 2033
- Figure 80: Middle East and Africa Video-on-Demand Market Volume (K Unit), by Country 2025 & 2033
- Figure 81: Middle East and Africa Video-on-Demand Market Revenue Share (%), by Country 2025 & 2033
- Figure 82: Middle East and Africa Video-on-Demand Market Volume Share (%), by Country 2025 & 2033
- Figure 83: Rest of the World Video-on-Demand Market Revenue (Million), by Business Model 2025 & 2033
- Figure 84: Rest of the World Video-on-Demand Market Volume (K Unit), by Business Model 2025 & 2033
- Figure 85: Rest of the World Video-on-Demand Market Revenue Share (%), by Business Model 2025 & 2033
- Figure 86: Rest of the World Video-on-Demand Market Volume Share (%), by Business Model 2025 & 2033
- Figure 87: Rest of the World Video-on-Demand Market Revenue (Million), by End-User 2025 & 2033
- Figure 88: Rest of the World Video-on-Demand Market Volume (K Unit), by End-User 2025 & 2033
- Figure 89: Rest of the World Video-on-Demand Market Revenue Share (%), by End-User 2025 & 2033
- Figure 90: Rest of the World Video-on-Demand Market Volume Share (%), by End-User 2025 & 2033
- Figure 91: Rest of the World Video-on-Demand Market Revenue (Million), by Device Type 2025 & 2033
- Figure 92: Rest of the World Video-on-Demand Market Volume (K Unit), by Device Type 2025 & 2033
- Figure 93: Rest of the World Video-on-Demand Market Revenue Share (%), by Device Type 2025 & 2033
- Figure 94: Rest of the World Video-on-Demand Market Volume Share (%), by Device Type 2025 & 2033
- Figure 95: Rest of the World Video-on-Demand Market Revenue (Million), by Content Type 2025 & 2033
- Figure 96: Rest of the World Video-on-Demand Market Volume (K Unit), by Content Type 2025 & 2033
- Figure 97: Rest of the World Video-on-Demand Market Revenue Share (%), by Content Type 2025 & 2033
- Figure 98: Rest of the World Video-on-Demand Market Volume Share (%), by Content Type 2025 & 2033
- Figure 99: Rest of the World Video-on-Demand Market Revenue (Million), by Country 2025 & 2033
- Figure 100: Rest of the World Video-on-Demand Market Volume (K Unit), by Country 2025 & 2033
- Figure 101: Rest of the World Video-on-Demand Market Revenue Share (%), by Country 2025 & 2033
- Figure 102: Rest of the World Video-on-Demand Market Volume Share (%), by Country 2025 & 2033
List of Tables
- Table 1: Global Video-on-Demand Market Revenue Million Forecast, by Business Model 2020 & 2033
- Table 2: Global Video-on-Demand Market Volume K Unit Forecast, by Business Model 2020 & 2033
- Table 3: Global Video-on-Demand Market Revenue Million Forecast, by End-User 2020 & 2033
- Table 4: Global Video-on-Demand Market Volume K Unit Forecast, by End-User 2020 & 2033
- Table 5: Global Video-on-Demand Market Revenue Million Forecast, by Device Type 2020 & 2033
- Table 6: Global Video-on-Demand Market Volume K Unit Forecast, by Device Type 2020 & 2033
- Table 7: Global Video-on-Demand Market Revenue Million Forecast, by Content Type 2020 & 2033
- Table 8: Global Video-on-Demand Market Volume K Unit Forecast, by Content Type 2020 & 2033
- Table 9: Global Video-on-Demand Market Revenue Million Forecast, by Region 2020 & 2033
- Table 10: Global Video-on-Demand Market Volume K Unit Forecast, by Region 2020 & 2033
- Table 11: Global Video-on-Demand Market Revenue Million Forecast, by Business Model 2020 & 2033
- Table 12: Global Video-on-Demand Market Volume K Unit Forecast, by Business Model 2020 & 2033
- Table 13: Global Video-on-Demand Market Revenue Million Forecast, by End-User 2020 & 2033
- Table 14: Global Video-on-Demand Market Volume K Unit Forecast, by End-User 2020 & 2033
- Table 15: Global Video-on-Demand Market Revenue Million Forecast, by Device Type 2020 & 2033
- Table 16: Global Video-on-Demand Market Volume K Unit Forecast, by Device Type 2020 & 2033
- Table 17: Global Video-on-Demand Market Revenue Million Forecast, by Content Type 2020 & 2033
- Table 18: Global Video-on-Demand Market Volume K Unit Forecast, by Content Type 2020 & 2033
- Table 19: Global Video-on-Demand Market Revenue Million Forecast, by Country 2020 & 2033
- Table 20: Global Video-on-Demand Market Volume K Unit Forecast, by Country 2020 & 2033
- Table 21: Global Video-on-Demand Market Revenue Million Forecast, by Business Model 2020 & 2033
- Table 22: Global Video-on-Demand Market Volume K Unit Forecast, by Business Model 2020 & 2033
- Table 23: Global Video-on-Demand Market Revenue Million Forecast, by End-User 2020 & 2033
- Table 24: Global Video-on-Demand Market Volume K Unit Forecast, by End-User 2020 & 2033
- Table 25: Global Video-on-Demand Market Revenue Million Forecast, by Device Type 2020 & 2033
- Table 26: Global Video-on-Demand Market Volume K Unit Forecast, by Device Type 2020 & 2033
- Table 27: Global Video-on-Demand Market Revenue Million Forecast, by Content Type 2020 & 2033
- Table 28: Global Video-on-Demand Market Volume K Unit Forecast, by Content Type 2020 & 2033
- Table 29: Global Video-on-Demand Market Revenue Million Forecast, by Country 2020 & 2033
- Table 30: Global Video-on-Demand Market Volume K Unit Forecast, by Country 2020 & 2033
- Table 31: Global Video-on-Demand Market Revenue Million Forecast, by Business Model 2020 & 2033
- Table 32: Global Video-on-Demand Market Volume K Unit Forecast, by Business Model 2020 & 2033
- Table 33: Global Video-on-Demand Market Revenue Million Forecast, by End-User 2020 & 2033
- Table 34: Global Video-on-Demand Market Volume K Unit Forecast, by End-User 2020 & 2033
- Table 35: Global Video-on-Demand Market Revenue Million Forecast, by Device Type 2020 & 2033
- Table 36: Global Video-on-Demand Market Volume K Unit Forecast, by Device Type 2020 & 2033
- Table 37: Global Video-on-Demand Market Revenue Million Forecast, by Content Type 2020 & 2033
- Table 38: Global Video-on-Demand Market Volume K Unit Forecast, by Content Type 2020 & 2033
- Table 39: Global Video-on-Demand Market Revenue Million Forecast, by Country 2020 & 2033
- Table 40: Global Video-on-Demand Market Volume K Unit Forecast, by Country 2020 & 2033
- Table 41: Global Video-on-Demand Market Revenue Million Forecast, by Business Model 2020 & 2033
- Table 42: Global Video-on-Demand Market Volume K Unit Forecast, by Business Model 2020 & 2033
- Table 43: Global Video-on-Demand Market Revenue Million Forecast, by End-User 2020 & 2033
- Table 44: Global Video-on-Demand Market Volume K Unit Forecast, by End-User 2020 & 2033
- Table 45: Global Video-on-Demand Market Revenue Million Forecast, by Device Type 2020 & 2033
- Table 46: Global Video-on-Demand Market Volume K Unit Forecast, by Device Type 2020 & 2033
- Table 47: Global Video-on-Demand Market Revenue Million Forecast, by Content Type 2020 & 2033
- Table 48: Global Video-on-Demand Market Volume K Unit Forecast, by Content Type 2020 & 2033
- Table 49: Global Video-on-Demand Market Revenue Million Forecast, by Country 2020 & 2033
- Table 50: Global Video-on-Demand Market Volume K Unit Forecast, by Country 2020 & 2033
- Table 51: Global Video-on-Demand Market Revenue Million Forecast, by Business Model 2020 & 2033
- Table 52: Global Video-on-Demand Market Volume K Unit Forecast, by Business Model 2020 & 2033
- Table 53: Global Video-on-Demand Market Revenue Million Forecast, by End-User 2020 & 2033
- Table 54: Global Video-on-Demand Market Volume K Unit Forecast, by End-User 2020 & 2033
- Table 55: Global Video-on-Demand Market Revenue Million Forecast, by Device Type 2020 & 2033
- Table 56: Global Video-on-Demand Market Volume K Unit Forecast, by Device Type 2020 & 2033
- Table 57: Global Video-on-Demand Market Revenue Million Forecast, by Content Type 2020 & 2033
- Table 58: Global Video-on-Demand Market Volume K Unit Forecast, by Content Type 2020 & 2033
- Table 59: Global Video-on-Demand Market Revenue Million Forecast, by Country 2020 & 2033
- Table 60: Global Video-on-Demand Market Volume K Unit Forecast, by Country 2020 & 2033
Frequently Asked Questions
1. What is the projected Compound Annual Growth Rate (CAGR) of the Video-on-Demand Market?
The projected CAGR is approximately 10.66%.
2. Which companies are prominent players in the Video-on-Demand Market?
Key companies in the market include Edgio, Comcast Xfinity, Fandango Media LLC (Vudu), Midwest Tape LLC (Hoopla Digital), Netflix Inc, DirecTV, Vubiquity Inc, The Walt Disney Company (Disney+), DISH Network LLC, Dacast Inc, Wistia Inc , Warner Bros Discovery Inc, Novi Digital Entertainment Private Limited (Hotstar), Hulu LLC, Fujitsu, Amazon com Inc (Amazon Prime Video), Kaltura, Popcornflix LLC, Apple Inc, Zee Entertainment Enterprises Ltd (Zee5).
3. What are the main segments of the Video-on-Demand Market?
The market segments include Business Model, End-User, Device Type, Content Type.
4. Can you provide details about the market size?
The market size is estimated to be USD 115.55 Million as of 2022.
5. What are some drivers contributing to market growth?
Developments in Digital Video Landscape; Surge in Mobile Based Internet Users.
6. What are the notable trends driving market growth?
Surge in Mobile-based Internet Users to Drive the Market.
7. Are there any restraints impacting market growth?
Growing Threat of Video Content Piracy.
8. Can you provide examples of recent developments in the market?
January 2023: FOX Entertainment and Hulu have announced a multi-year content partnership that includes in-season streaming rights for FOX's extensive programming schedule and a multi-platform strategic marketing alliance. All FOX primetime entertainment programming, from Family Guy and The Cleaning Lady to The Masked Singer and Next Level Chef, are expected to continue to stream on Hulu the day after its linear telecast, according to the terms of the agreement. Furthermore, the agreement includes a significant alliance in which FOX and Hulu branding will coexist across all FOX-owned and external marketing touchpoints to align FOX content's live and on-demand viewing messaging.
9. What pricing options are available for accessing the report?
Pricing options include single-user, multi-user, and enterprise licenses priced at USD 4750, USD 5250, and USD 8750 respectively.
10. Is the market size provided in terms of value or volume?
The market size is provided in terms of value, measured in Million and volume, measured in K Unit.
11. Are there any specific market keywords associated with the report?
Yes, the market keyword associated with the report is "Video-on-Demand Market," which aids in identifying and referencing the specific market segment covered.
12. How do I determine which pricing option suits my needs best?
The pricing options vary based on user requirements and access needs. Individual users may opt for single-user licenses, while businesses requiring broader access may choose multi-user or enterprise licenses for cost-effective access to the report.
13. Are there any additional resources or data provided in the Video-on-Demand Market report?
While the report offers comprehensive insights, it's advisable to review the specific contents or supplementary materials provided to ascertain if additional resources or data are available.
14. How can I stay updated on further developments or reports in the Video-on-Demand Market?
To stay informed about further developments, trends, and reports in the Video-on-Demand Market, consider subscribing to industry newsletters, following relevant companies and organizations, or regularly checking reputable industry news sources and publications.
Methodology
Step 1 - Identification of Relevant Samples Size from Population Database


Step 2 - Approaches for Defining Global Market Size (Value, Volume* & Price*)

Note*: In applicable scenarios
Step 3 - Data Sources
Primary Research
- Web Analytics
- Survey Reports
- Research Institute
- Latest Research Reports
- Opinion Leaders
Secondary Research
- Annual Reports
- White Paper
- Latest Press Release
- Industry Association
- Paid Database
- Investor Presentations

Step 4 - Data Triangulation
Involves using different sources of information in order to increase the validity of a study
These sources are likely to be stakeholders in a program - participants, other researchers, program staff, other community members, and so on.
Then we put all data in single framework & apply various statistical tools to find out the dynamic on the market.
During the analysis stage, feedback from the stakeholder groups would be compared to determine areas of agreement as well as areas of divergence