Exploring Opportunities in Video Managed Services Industry Sector

Video Managed Services Industry by Type (Software, Hardware), by Enterprise Size (Large Enterprise, Small & Medium Enterprise), by Applications (Business to Business, Business to Consumer), by North America, by Europe, by Asia Pacific, by Rest of the World Forecast 2025-2033

Jul 3 2025
Base Year: 2024

234 Pages
Main Logo

Exploring Opportunities in Video Managed Services Industry Sector


Home
Industries
Technology, Media and Telecom
sponsor image
sponsor image
sponsor image
sponsor image
sponsor image
sponsor image
sponsor image
sponsor image
sponsor image
sponsor image
sponsor image
sponsor image
sponsor image
sponsor image
sponsor image
sponsor image
sponsor image
sponsor image
sponsor image
sponsor image

Tailored for you

  • In-depth Analysis Tailored to Specified Regions or Segments
  • Company Profiles Customized to User Preferences
  • Comprehensive Insights Focused on Specific Segments or Regions
  • Customized Evaluation of Competitive Landscape to Meet Your Needs
  • Tailored Customization to Address Other Specific Requirements
Ask for customization


Key Insights

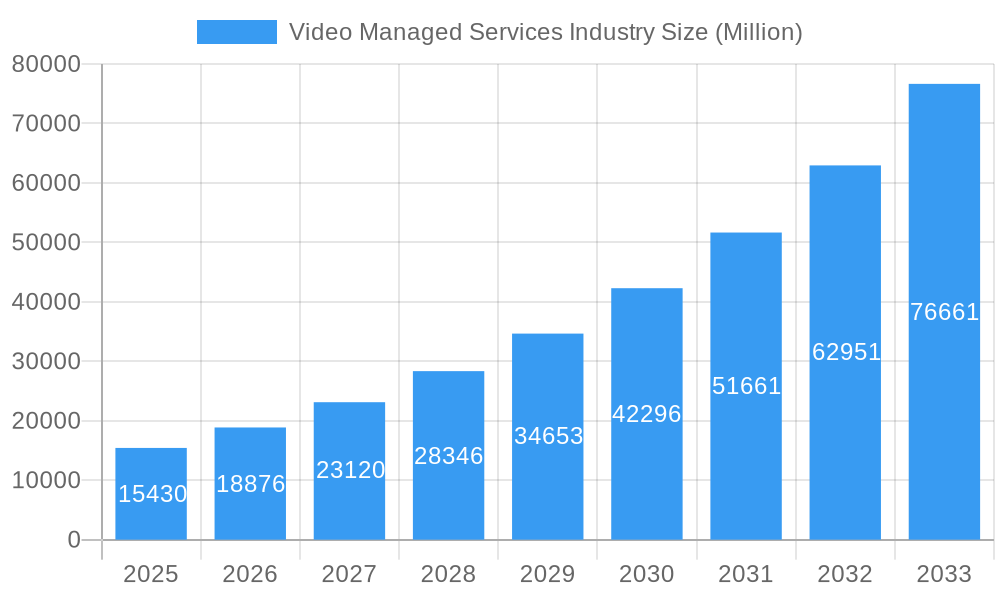
The global Video Managed Services market is experiencing robust growth, projected to reach \$15.43 billion in 2025 and exhibiting a Compound Annual Growth Rate (CAGR) of 22.25% from 2025 to 2033. This expansion is fueled by several key drivers. The increasing adoption of cloud-based solutions for enhanced scalability and cost-effectiveness is a significant factor. Businesses across various sectors, including healthcare, education, and finance, are leveraging video conferencing for improved collaboration, training, and customer engagement. Furthermore, the rising demand for high-quality video experiences, coupled with the need for simplified management and reduced IT overhead, is driving the adoption of managed services. The market is segmented by application (B2B and B2C), type (software and hardware), and enterprise size (large and small/medium enterprises), offering diverse opportunities for vendors. North America currently holds a dominant market share due to high technological adoption and robust digital infrastructure, but the Asia-Pacific region is anticipated to witness significant growth in the coming years driven by increasing internet penetration and economic development. Competition is intense, with established players like Cisco Systems, Polycom, and NTT Communications competing alongside emerging technology providers.

The market's growth trajectory is projected to continue its upward trend through 2033, driven by technological advancements such as enhanced video quality (4K and beyond), AI-powered features for improved meeting management and analytics, and the integration of video services with other communication platforms. However, challenges such as security concerns related to data breaches and ensuring network reliability need addressing. The ongoing expansion of 5G networks promises to alleviate bandwidth limitations and further propel market growth. The diverse range of enterprise sizes served, from small businesses to large corporations, creates opportunities for specialized service offerings. Effective marketing strategies focused on demonstrating the Return on Investment (ROI) of video managed services will be crucial for continued market expansion. The focus will be on showcasing improved productivity, streamlined communications, and cost savings achieved through these services.
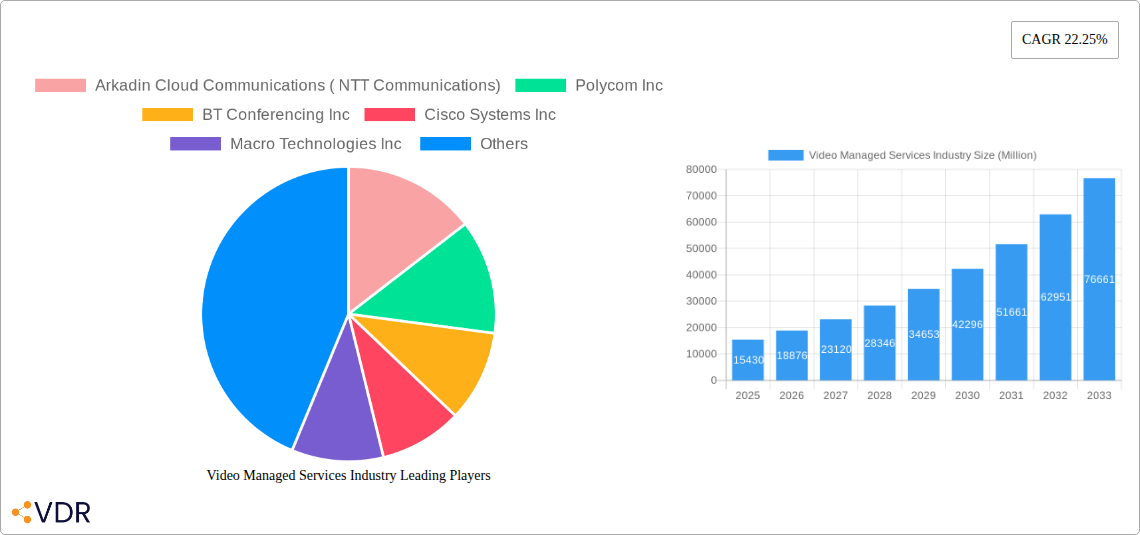
Video Managed Services Industry Research Report - Market Size, Growth & Forecast

Video Managed Services Industry Market Report: 2019-2033

This comprehensive report provides an in-depth analysis of the Video Managed Services market, encompassing market dynamics, growth trends, regional dominance, product landscape, key players, and future outlook. The study period spans 2019-2033, with 2025 as the base and estimated year. The forecast period is 2025-2033, and the historical period covers 2019-2024. The report segments the market by application (Business-to-Business, Business-to-Consumer), type (Software, Hardware), and enterprise size (Large Enterprise, Small & Medium Enterprise). The total market value is projected at xx Million in 2025 and is expected to grow significantly by 2033.

Video Managed Services Industry Market Dynamics & Structure

The Video Managed Services market is characterized by a moderately concentrated landscape, with key players vying for market share through strategic partnerships, technological innovation, and acquisitions. Technological advancements, particularly in cloud-based solutions and AI-powered analytics, are significant drivers of market growth. Regulatory compliance, particularly concerning data privacy and security, plays a crucial role in shaping market dynamics. Competitive substitutes include on-premise solutions and DIY video management systems, although the managed services model increasingly offers advantages in terms of cost-efficiency and scalability. The end-user demographics are diverse, spanning various industries and enterprise sizes. M&A activity is expected to remain robust, with larger players aiming to expand their capabilities and geographic reach.

  • Market Concentration: Moderately concentrated, with top 5 players holding approximately xx% market share in 2025.
  • Technological Innovation: Cloud-based solutions, AI-powered analytics, and 5G infrastructure are key drivers.
  • Regulatory Frameworks: Data privacy regulations (GDPR, CCPA) significantly impact market practices.
  • Competitive Substitutes: On-premise solutions and DIY systems pose a moderate threat.
  • End-User Demographics: Broad range across various industries and enterprise sizes.
  • M&A Trends: Expected increase in strategic acquisitions to enhance capabilities and market reach. Approximately xx M&A deals projected in the forecast period.

Video Managed Services Industry Growth Trends & Insights

The Video Managed Services market exhibits a robust growth trajectory, fueled by increasing adoption of cloud-based solutions, rising demand for enhanced security features, and the growing need for efficient video management across various industries. Market size is projected to expand at a CAGR of xx% during the forecast period, driven by factors such as increasing digitalization, the proliferation of connected devices, and the expanding need for real-time video analytics. The shift towards cloud-based solutions is accelerating adoption rates, while technological disruptions, such as the emergence of edge computing and AI-driven video analytics, are reshaping the competitive landscape. Consumer behavior is increasingly favoring managed services due to their scalability, cost-effectiveness, and reduced IT burden. Market penetration is expected to reach xx% by 2033.

Video Managed Services Industry Growth

Dominant Regions, Countries, or Segments in Video Managed Services Industry

North America currently holds the largest market share in the Video Managed Services industry, driven by high technological adoption rates and a robust IT infrastructure. However, Asia-Pacific is projected to experience the fastest growth during the forecast period due to rapid economic growth and increasing digitalization initiatives.

By Application:

  • Business-to-Business (B2B): Dominant segment, driven by the need for enhanced security and operational efficiency across various industries. Market size in 2025: xx Million.
  • Business-to-Consumer (B2C): Growing segment fueled by the increasing use of smart home devices and rising demand for remote monitoring solutions. Market size in 2025: xx Million.

By Type:

  • Software: Faster-growing segment due to the increasing popularity of cloud-based video management platforms. Market size in 2025: xx Million.
  • Hardware: Significant market share, but growth rate is slower than software due to the higher initial investment cost. Market size in 2025: xx Million.

By Enterprise Size:

  • Large Enterprise: Dominant segment driven by their higher budgets and greater need for advanced video management capabilities. Market size in 2025: xx Million.
  • Small & Medium Enterprise (SME): Growing segment, driven by the increasing affordability of cloud-based solutions and the growing demand for security and operational efficiency. Market size in 2025: xx Million.

Video Managed Services Industry Product Landscape

The Video Managed Services market offers a diverse range of products, including cloud-based video management platforms, on-premise solutions, and hybrid models. These platforms integrate advanced features such as AI-powered analytics, facial recognition, and real-time alerts. Key innovations focus on enhancing security, improving scalability, and providing better user experience through intuitive interfaces. Performance metrics emphasize factors such as storage capacity, processing speed, and system reliability. Unique selling propositions include features like integrated analytics, seamless integrations with other security systems, and robust cybersecurity measures.

Key Drivers, Barriers & Challenges in Video Managed Services Industry

Key Drivers:

  • Increasing adoption of cloud-based solutions.
  • Growing need for enhanced security and surveillance.
  • Rising demand for real-time video analytics and insights.
  • Expanding applications across various industries (retail, healthcare, etc.)

Challenges & Restraints:

  • High initial investment costs for some solutions.
  • Data privacy and security concerns.
  • Integration complexities with existing IT infrastructure.
  • Competition from on-premise and DIY video management solutions. Estimated xx% market share lost to these alternatives in 2024.

Emerging Opportunities in Video Managed Services Industry

  • Expansion into untapped markets (e.g., developing economies).
  • Integration with IoT devices and smart city initiatives.
  • Development of advanced analytics and AI-powered features.
  • Focus on edge computing for real-time processing and low latency.

Growth Accelerators in the Video Managed Services Industry

Strategic partnerships between technology providers and service integrators are accelerating market growth by creating comprehensive solutions and expanding market reach. Technological breakthroughs in AI and edge computing are driving innovation, enabling more efficient and intelligent video management systems. Market expansion strategies targeting underpenetrated regions and industries are also contributing to overall market expansion.

Key Players Shaping the Video Managed Services Industry Market

  • Arkadin Cloud Communications (NTT Communications)
  • Polycom Inc
  • BT Conferencing Inc
  • Cisco Systems Inc
  • Macro Technologies Inc
  • Applied Global Technologies
  • Dimension Data
  • AVI-SPL Inc
  • ZTE Enterprise
  • AT&T Business
  • Telus Communications
  • Vega Global

Notable Milestones in Video Managed Services Industry Sector

  • August 2023: Quantum Corporation partnered with Tiger Surveillance to offer end-to-end video surveillance data management and archiving solutions.
  • June 2023: Check Point Software Technologies partnered with TELUS to launch a cloud security posture management service in Canada.

In-Depth Video Managed Services Industry Market Outlook

The Video Managed Services market is poised for sustained growth, driven by technological advancements, increasing demand for enhanced security features, and expanding applications across diverse sectors. Strategic partnerships, investments in R&D, and market expansion initiatives will further fuel this growth, creating significant opportunities for both established players and new entrants. The focus on AI-powered analytics, edge computing, and cloud-based solutions will continue to shape market dynamics, paving the way for a more efficient, secure, and intelligent video management landscape.

Video Managed Services Industry Segmentation

  • 1. Type
    • 1.1. Software
    • 1.2. Hardware
  • 2. Enterprise Size
    • 2.1. Large Enterprise
    • 2.2. Small & Medium Enterprise
  • 3. Applications
    • 3.1. Business to Business
    • 3.2. Business to Consumer

Video Managed Services Industry Segmentation By Geography

  • 1. North America
  • 2. Europe
  • 3. Asia Pacific
  • 4. Rest of the World
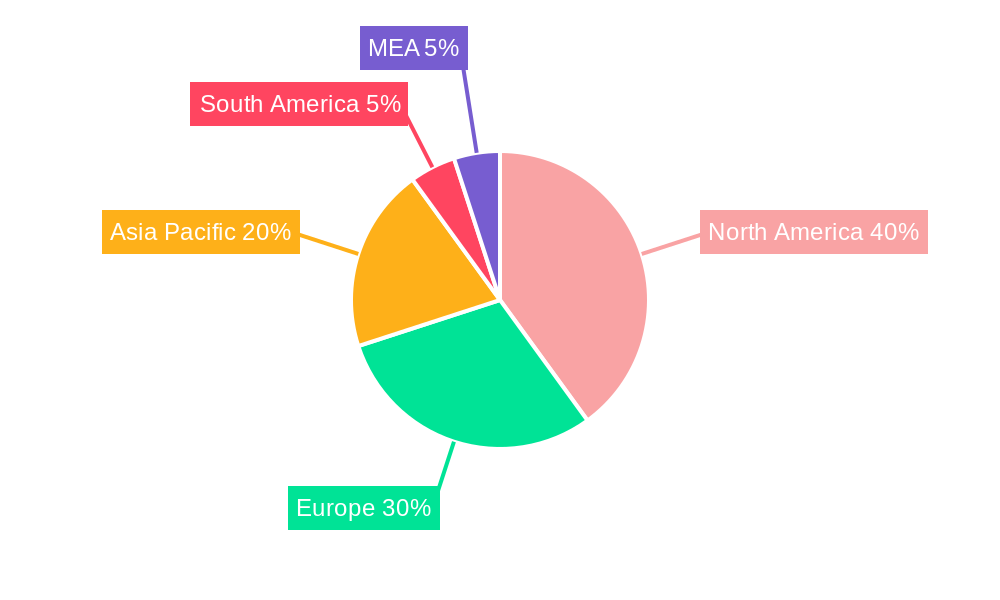
Video Managed Services Industry Regional Share


Video Managed Services Industry REPORT HIGHLIGHTS

AspectsDetails
Study Period 2019-2033
Base Year 2024
Estimated Year 2025
Forecast Period2025-2033
Historical Period2019-2024
Growth RateCAGR of 22.25% from 2019-2033
Segmentation
    • By Type
      • Software
      • Hardware
    • By Enterprise Size
      • Large Enterprise
      • Small & Medium Enterprise
    • By Applications
      • Business to Business
      • Business to Consumer
  • By Geography
    • North America
    • Europe
    • Asia Pacific
    • Rest of the World


Table of Contents

  1. 1. Introduction
    • 1.1. Research Scope
    • 1.2. Market Segmentation
    • 1.3. Research Methodology
    • 1.4. Definitions and Assumptions
  2. 2. Executive Summary
    • 2.1. Introduction
  3. 3. Market Dynamics
    • 3.1. Introduction
      • 3.2. Market Drivers
        • 3.2.1. Adoption of BYOD (Bring Your Own Device); Higher Productivity Rate by Reducing Unnecessary Hours
      • 3.3. Market Restrains
        • 3.3.1. High Initial Investments and Installation Costs
      • 3.4. Market Trends
        • 3.4.1. Software Segment to Witness the Growth
  4. 4. Market Factor Analysis
    • 4.1. Porters Five Forces
    • 4.2. Supply/Value Chain
    • 4.3. PESTEL analysis
    • 4.4. Market Entropy
    • 4.5. Patent/Trademark Analysis
  5. 5. Global Video Managed Services Industry Analysis, Insights and Forecast, 2019-2031
    • 5.1. Market Analysis, Insights and Forecast - by Type
      • 5.1.1. Software
      • 5.1.2. Hardware
    • 5.2. Market Analysis, Insights and Forecast - by Enterprise Size
      • 5.2.1. Large Enterprise
      • 5.2.2. Small & Medium Enterprise
    • 5.3. Market Analysis, Insights and Forecast - by Applications
      • 5.3.1. Business to Business
      • 5.3.2. Business to Consumer
    • 5.4. Market Analysis, Insights and Forecast - by Region
      • 5.4.1. North America
      • 5.4.2. Europe
      • 5.4.3. Asia Pacific
      • 5.4.4. Rest of the World
  6. 6. North America Video Managed Services Industry Analysis, Insights and Forecast, 2019-2031
    • 6.1. Market Analysis, Insights and Forecast - by Type
      • 6.1.1. Software
      • 6.1.2. Hardware
    • 6.2. Market Analysis, Insights and Forecast - by Enterprise Size
      • 6.2.1. Large Enterprise
      • 6.2.2. Small & Medium Enterprise
    • 6.3. Market Analysis, Insights and Forecast - by Applications
      • 6.3.1. Business to Business
      • 6.3.2. Business to Consumer
  7. 7. Europe Video Managed Services Industry Analysis, Insights and Forecast, 2019-2031
    • 7.1. Market Analysis, Insights and Forecast - by Type
      • 7.1.1. Software
      • 7.1.2. Hardware
    • 7.2. Market Analysis, Insights and Forecast - by Enterprise Size
      • 7.2.1. Large Enterprise
      • 7.2.2. Small & Medium Enterprise
    • 7.3. Market Analysis, Insights and Forecast - by Applications
      • 7.3.1. Business to Business
      • 7.3.2. Business to Consumer
  8. 8. Asia Pacific Video Managed Services Industry Analysis, Insights and Forecast, 2019-2031
    • 8.1. Market Analysis, Insights and Forecast - by Type
      • 8.1.1. Software
      • 8.1.2. Hardware
    • 8.2. Market Analysis, Insights and Forecast - by Enterprise Size
      • 8.2.1. Large Enterprise
      • 8.2.2. Small & Medium Enterprise
    • 8.3. Market Analysis, Insights and Forecast - by Applications
      • 8.3.1. Business to Business
      • 8.3.2. Business to Consumer
  9. 9. Rest of the World Video Managed Services Industry Analysis, Insights and Forecast, 2019-2031
    • 9.1. Market Analysis, Insights and Forecast - by Type
      • 9.1.1. Software
      • 9.1.2. Hardware
    • 9.2. Market Analysis, Insights and Forecast - by Enterprise Size
      • 9.2.1. Large Enterprise
      • 9.2.2. Small & Medium Enterprise
    • 9.3. Market Analysis, Insights and Forecast - by Applications
      • 9.3.1. Business to Business
      • 9.3.2. Business to Consumer
  10. 10. North America Video Managed Services Industry Analysis, Insights and Forecast, 2019-2031
      • 10.1. Market Analysis, Insights and Forecast - By Country/Sub-region
        • 10.1.1 United States
        • 10.1.2 Canada
        • 10.1.3 Mexico
  11. 11. Europe Video Managed Services Industry Analysis, Insights and Forecast, 2019-2031
      • 11.1. Market Analysis, Insights and Forecast - By Country/Sub-region
        • 11.1.1 Germany
        • 11.1.2 United Kingdom
        • 11.1.3 France
        • 11.1.4 Spain
        • 11.1.5 Italy
        • 11.1.6 Spain
        • 11.1.7 Belgium
        • 11.1.8 Netherland
        • 11.1.9 Nordics
        • 11.1.10 Rest of Europe
  12. 12. Asia Pacific Video Managed Services Industry Analysis, Insights and Forecast, 2019-2031
      • 12.1. Market Analysis, Insights and Forecast - By Country/Sub-region
        • 12.1.1 China
        • 12.1.2 Japan
        • 12.1.3 India
        • 12.1.4 South Korea
        • 12.1.5 Southeast Asia
        • 12.1.6 Australia
        • 12.1.7 Indonesia
        • 12.1.8 Phillipes
        • 12.1.9 Singapore
        • 12.1.10 Thailandc
        • 12.1.11 Rest of Asia Pacific
  13. 13. South America Video Managed Services Industry Analysis, Insights and Forecast, 2019-2031
      • 13.1. Market Analysis, Insights and Forecast - By Country/Sub-region
        • 13.1.1 Brazil
        • 13.1.2 Argentina
        • 13.1.3 Peru
        • 13.1.4 Chile
        • 13.1.5 Colombia
        • 13.1.6 Ecuador
        • 13.1.7 Venezuela
        • 13.1.8 Rest of South America
  14. 14. North America Video Managed Services Industry Analysis, Insights and Forecast, 2019-2031
      • 14.1. Market Analysis, Insights and Forecast - By Country/Sub-region
        • 14.1.1 United States
        • 14.1.2 Canada
        • 14.1.3 Mexico
  15. 15. MEA Video Managed Services Industry Analysis, Insights and Forecast, 2019-2031
      • 15.1. Market Analysis, Insights and Forecast - By Country/Sub-region
        • 15.1.1 United Arab Emirates
        • 15.1.2 Saudi Arabia
        • 15.1.3 South Africa
        • 15.1.4 Rest of Middle East and Africa
  16. 16. Competitive Analysis
    • 16.1. Global Market Share Analysis 2024
      • 16.2. Company Profiles
        • 16.2.1 Arkadin Cloud Communications ( NTT Communications)
          • 16.2.1.1. Overview
          • 16.2.1.2. Products
          • 16.2.1.3. SWOT Analysis
          • 16.2.1.4. Recent Developments
          • 16.2.1.5. Financials (Based on Availability)
        • 16.2.2 Polycom Inc
          • 16.2.2.1. Overview
          • 16.2.2.2. Products
          • 16.2.2.3. SWOT Analysis
          • 16.2.2.4. Recent Developments
          • 16.2.2.5. Financials (Based on Availability)
        • 16.2.3 BT Conferencing Inc
          • 16.2.3.1. Overview
          • 16.2.3.2. Products
          • 16.2.3.3. SWOT Analysis
          • 16.2.3.4. Recent Developments
          • 16.2.3.5. Financials (Based on Availability)
        • 16.2.4 Cisco Systems Inc
          • 16.2.4.1. Overview
          • 16.2.4.2. Products
          • 16.2.4.3. SWOT Analysis
          • 16.2.4.4. Recent Developments
          • 16.2.4.5. Financials (Based on Availability)
        • 16.2.5 Macro Technologies Inc
          • 16.2.5.1. Overview
          • 16.2.5.2. Products
          • 16.2.5.3. SWOT Analysis
          • 16.2.5.4. Recent Developments
          • 16.2.5.5. Financials (Based on Availability)
        • 16.2.6 Applied Global Technologies
          • 16.2.6.1. Overview
          • 16.2.6.2. Products
          • 16.2.6.3. SWOT Analysis
          • 16.2.6.4. Recent Developments
          • 16.2.6.5. Financials (Based on Availability)
        • 16.2.7 Dimension Data
          • 16.2.7.1. Overview
          • 16.2.7.2. Products
          • 16.2.7.3. SWOT Analysis
          • 16.2.7.4. Recent Developments
          • 16.2.7.5. Financials (Based on Availability)
        • 16.2.8 AVI-SPL Inc
          • 16.2.8.1. Overview
          • 16.2.8.2. Products
          • 16.2.8.3. SWOT Analysis
          • 16.2.8.4. Recent Developments
          • 16.2.8.5. Financials (Based on Availability)
        • 16.2.9 ZTE Enterprise
          • 16.2.9.1. Overview
          • 16.2.9.2. Products
          • 16.2.9.3. SWOT Analysis
          • 16.2.9.4. Recent Developments
          • 16.2.9.5. Financials (Based on Availability)
        • 16.2.10 AT&T Business
          • 16.2.10.1. Overview
          • 16.2.10.2. Products
          • 16.2.10.3. SWOT Analysis
          • 16.2.10.4. Recent Developments
          • 16.2.10.5. Financials (Based on Availability)
        • 16.2.11 Telus Communications
          • 16.2.11.1. Overview
          • 16.2.11.2. Products
          • 16.2.11.3. SWOT Analysis
          • 16.2.11.4. Recent Developments
          • 16.2.11.5. Financials (Based on Availability)
        • 16.2.12 Vega Global
          • 16.2.12.1. Overview
          • 16.2.12.2. Products
          • 16.2.12.3. SWOT Analysis
          • 16.2.12.4. Recent Developments
          • 16.2.12.5. Financials (Based on Availability)

List of Figures

  1. Figure 1: Global Video Managed Services Industry Revenue Breakdown (Million, %) by Region 2024 & 2032
  2. Figure 2: Global Video Managed Services Industry Volume Breakdown (K Unit, %) by Region 2024 & 2032
  3. Figure 3: North America Video Managed Services Industry Revenue (Million), by Country 2024 & 2032
  4. Figure 4: North America Video Managed Services Industry Volume (K Unit), by Country 2024 & 2032
  5. Figure 5: North America Video Managed Services Industry Revenue Share (%), by Country 2024 & 2032
  6. Figure 6: North America Video Managed Services Industry Volume Share (%), by Country 2024 & 2032
  7. Figure 7: Europe Video Managed Services Industry Revenue (Million), by Country 2024 & 2032
  8. Figure 8: Europe Video Managed Services Industry Volume (K Unit), by Country 2024 & 2032
  9. Figure 9: Europe Video Managed Services Industry Revenue Share (%), by Country 2024 & 2032
  10. Figure 10: Europe Video Managed Services Industry Volume Share (%), by Country 2024 & 2032
  11. Figure 11: Asia Pacific Video Managed Services Industry Revenue (Million), by Country 2024 & 2032
  12. Figure 12: Asia Pacific Video Managed Services Industry Volume (K Unit), by Country 2024 & 2032
  13. Figure 13: Asia Pacific Video Managed Services Industry Revenue Share (%), by Country 2024 & 2032
  14. Figure 14: Asia Pacific Video Managed Services Industry Volume Share (%), by Country 2024 & 2032
  15. Figure 15: South America Video Managed Services Industry Revenue (Million), by Country 2024 & 2032
  16. Figure 16: South America Video Managed Services Industry Volume (K Unit), by Country 2024 & 2032
  17. Figure 17: South America Video Managed Services Industry Revenue Share (%), by Country 2024 & 2032
  18. Figure 18: South America Video Managed Services Industry Volume Share (%), by Country 2024 & 2032
  19. Figure 19: North America Video Managed Services Industry Revenue (Million), by Country 2024 & 2032
  20. Figure 20: North America Video Managed Services Industry Volume (K Unit), by Country 2024 & 2032
  21. Figure 21: North America Video Managed Services Industry Revenue Share (%), by Country 2024 & 2032
  22. Figure 22: North America Video Managed Services Industry Volume Share (%), by Country 2024 & 2032
  23. Figure 23: MEA Video Managed Services Industry Revenue (Million), by Country 2024 & 2032
  24. Figure 24: MEA Video Managed Services Industry Volume (K Unit), by Country 2024 & 2032
  25. Figure 25: MEA Video Managed Services Industry Revenue Share (%), by Country 2024 & 2032
  26. Figure 26: MEA Video Managed Services Industry Volume Share (%), by Country 2024 & 2032
  27. Figure 27: North America Video Managed Services Industry Revenue (Million), by Type 2024 & 2032
  28. Figure 28: North America Video Managed Services Industry Volume (K Unit), by Type 2024 & 2032
  29. Figure 29: North America Video Managed Services Industry Revenue Share (%), by Type 2024 & 2032
  30. Figure 30: North America Video Managed Services Industry Volume Share (%), by Type 2024 & 2032
  31. Figure 31: North America Video Managed Services Industry Revenue (Million), by Enterprise Size 2024 & 2032
  32. Figure 32: North America Video Managed Services Industry Volume (K Unit), by Enterprise Size 2024 & 2032
  33. Figure 33: North America Video Managed Services Industry Revenue Share (%), by Enterprise Size 2024 & 2032
  34. Figure 34: North America Video Managed Services Industry Volume Share (%), by Enterprise Size 2024 & 2032
  35. Figure 35: North America Video Managed Services Industry Revenue (Million), by Applications 2024 & 2032
  36. Figure 36: North America Video Managed Services Industry Volume (K Unit), by Applications 2024 & 2032
  37. Figure 37: North America Video Managed Services Industry Revenue Share (%), by Applications 2024 & 2032
  38. Figure 38: North America Video Managed Services Industry Volume Share (%), by Applications 2024 & 2032
  39. Figure 39: North America Video Managed Services Industry Revenue (Million), by Country 2024 & 2032
  40. Figure 40: North America Video Managed Services Industry Volume (K Unit), by Country 2024 & 2032
  41. Figure 41: North America Video Managed Services Industry Revenue Share (%), by Country 2024 & 2032
  42. Figure 42: North America Video Managed Services Industry Volume Share (%), by Country 2024 & 2032
  43. Figure 43: Europe Video Managed Services Industry Revenue (Million), by Type 2024 & 2032
  44. Figure 44: Europe Video Managed Services Industry Volume (K Unit), by Type 2024 & 2032
  45. Figure 45: Europe Video Managed Services Industry Revenue Share (%), by Type 2024 & 2032
  46. Figure 46: Europe Video Managed Services Industry Volume Share (%), by Type 2024 & 2032
  47. Figure 47: Europe Video Managed Services Industry Revenue (Million), by Enterprise Size 2024 & 2032
  48. Figure 48: Europe Video Managed Services Industry Volume (K Unit), by Enterprise Size 2024 & 2032
  49. Figure 49: Europe Video Managed Services Industry Revenue Share (%), by Enterprise Size 2024 & 2032
  50. Figure 50: Europe Video Managed Services Industry Volume Share (%), by Enterprise Size 2024 & 2032
  51. Figure 51: Europe Video Managed Services Industry Revenue (Million), by Applications 2024 & 2032
  52. Figure 52: Europe Video Managed Services Industry Volume (K Unit), by Applications 2024 & 2032
  53. Figure 53: Europe Video Managed Services Industry Revenue Share (%), by Applications 2024 & 2032
  54. Figure 54: Europe Video Managed Services Industry Volume Share (%), by Applications 2024 & 2032
  55. Figure 55: Europe Video Managed Services Industry Revenue (Million), by Country 2024 & 2032
  56. Figure 56: Europe Video Managed Services Industry Volume (K Unit), by Country 2024 & 2032
  57. Figure 57: Europe Video Managed Services Industry Revenue Share (%), by Country 2024 & 2032
  58. Figure 58: Europe Video Managed Services Industry Volume Share (%), by Country 2024 & 2032
  59. Figure 59: Asia Pacific Video Managed Services Industry Revenue (Million), by Type 2024 & 2032
  60. Figure 60: Asia Pacific Video Managed Services Industry Volume (K Unit), by Type 2024 & 2032
  61. Figure 61: Asia Pacific Video Managed Services Industry Revenue Share (%), by Type 2024 & 2032
  62. Figure 62: Asia Pacific Video Managed Services Industry Volume Share (%), by Type 2024 & 2032
  63. Figure 63: Asia Pacific Video Managed Services Industry Revenue (Million), by Enterprise Size 2024 & 2032
  64. Figure 64: Asia Pacific Video Managed Services Industry Volume (K Unit), by Enterprise Size 2024 & 2032
  65. Figure 65: Asia Pacific Video Managed Services Industry Revenue Share (%), by Enterprise Size 2024 & 2032
  66. Figure 66: Asia Pacific Video Managed Services Industry Volume Share (%), by Enterprise Size 2024 & 2032
  67. Figure 67: Asia Pacific Video Managed Services Industry Revenue (Million), by Applications 2024 & 2032
  68. Figure 68: Asia Pacific Video Managed Services Industry Volume (K Unit), by Applications 2024 & 2032
  69. Figure 69: Asia Pacific Video Managed Services Industry Revenue Share (%), by Applications 2024 & 2032
  70. Figure 70: Asia Pacific Video Managed Services Industry Volume Share (%), by Applications 2024 & 2032
  71. Figure 71: Asia Pacific Video Managed Services Industry Revenue (Million), by Country 2024 & 2032
  72. Figure 72: Asia Pacific Video Managed Services Industry Volume (K Unit), by Country 2024 & 2032
  73. Figure 73: Asia Pacific Video Managed Services Industry Revenue Share (%), by Country 2024 & 2032
  74. Figure 74: Asia Pacific Video Managed Services Industry Volume Share (%), by Country 2024 & 2032
  75. Figure 75: Rest of the World Video Managed Services Industry Revenue (Million), by Type 2024 & 2032
  76. Figure 76: Rest of the World Video Managed Services Industry Volume (K Unit), by Type 2024 & 2032
  77. Figure 77: Rest of the World Video Managed Services Industry Revenue Share (%), by Type 2024 & 2032
  78. Figure 78: Rest of the World Video Managed Services Industry Volume Share (%), by Type 2024 & 2032
  79. Figure 79: Rest of the World Video Managed Services Industry Revenue (Million), by Enterprise Size 2024 & 2032
  80. Figure 80: Rest of the World Video Managed Services Industry Volume (K Unit), by Enterprise Size 2024 & 2032
  81. Figure 81: Rest of the World Video Managed Services Industry Revenue Share (%), by Enterprise Size 2024 & 2032
  82. Figure 82: Rest of the World Video Managed Services Industry Volume Share (%), by Enterprise Size 2024 & 2032
  83. Figure 83: Rest of the World Video Managed Services Industry Revenue (Million), by Applications 2024 & 2032
  84. Figure 84: Rest of the World Video Managed Services Industry Volume (K Unit), by Applications 2024 & 2032
  85. Figure 85: Rest of the World Video Managed Services Industry Revenue Share (%), by Applications 2024 & 2032
  86. Figure 86: Rest of the World Video Managed Services Industry Volume Share (%), by Applications 2024 & 2032
  87. Figure 87: Rest of the World Video Managed Services Industry Revenue (Million), by Country 2024 & 2032
  88. Figure 88: Rest of the World Video Managed Services Industry Volume (K Unit), by Country 2024 & 2032
  89. Figure 89: Rest of the World Video Managed Services Industry Revenue Share (%), by Country 2024 & 2032
  90. Figure 90: Rest of the World Video Managed Services Industry Volume Share (%), by Country 2024 & 2032

List of Tables

  1. Table 1: Global Video Managed Services Industry Revenue Million Forecast, by Region 2019 & 2032
  2. Table 2: Global Video Managed Services Industry Volume K Unit Forecast, by Region 2019 & 2032
  3. Table 3: Global Video Managed Services Industry Revenue Million Forecast, by Type 2019 & 2032
  4. Table 4: Global Video Managed Services Industry Volume K Unit Forecast, by Type 2019 & 2032
  5. Table 5: Global Video Managed Services Industry Revenue Million Forecast, by Enterprise Size 2019 & 2032
  6. Table 6: Global Video Managed Services Industry Volume K Unit Forecast, by Enterprise Size 2019 & 2032
  7. Table 7: Global Video Managed Services Industry Revenue Million Forecast, by Applications 2019 & 2032
  8. Table 8: Global Video Managed Services Industry Volume K Unit Forecast, by Applications 2019 & 2032
  9. Table 9: Global Video Managed Services Industry Revenue Million Forecast, by Region 2019 & 2032
  10. Table 10: Global Video Managed Services Industry Volume K Unit Forecast, by Region 2019 & 2032
  11. Table 11: Global Video Managed Services Industry Revenue Million Forecast, by Country 2019 & 2032
  12. Table 12: Global Video Managed Services Industry Volume K Unit Forecast, by Country 2019 & 2032
  13. Table 13: United States Video Managed Services Industry Revenue (Million) Forecast, by Application 2019 & 2032
  14. Table 14: United States Video Managed Services Industry Volume (K Unit) Forecast, by Application 2019 & 2032
  15. Table 15: Canada Video Managed Services Industry Revenue (Million) Forecast, by Application 2019 & 2032
  16. Table 16: Canada Video Managed Services Industry Volume (K Unit) Forecast, by Application 2019 & 2032
  17. Table 17: Mexico Video Managed Services Industry Revenue (Million) Forecast, by Application 2019 & 2032
  18. Table 18: Mexico Video Managed Services Industry Volume (K Unit) Forecast, by Application 2019 & 2032
  19. Table 19: Global Video Managed Services Industry Revenue Million Forecast, by Country 2019 & 2032
  20. Table 20: Global Video Managed Services Industry Volume K Unit Forecast, by Country 2019 & 2032
  21. Table 21: Germany Video Managed Services Industry Revenue (Million) Forecast, by Application 2019 & 2032
  22. Table 22: Germany Video Managed Services Industry Volume (K Unit) Forecast, by Application 2019 & 2032
  23. Table 23: United Kingdom Video Managed Services Industry Revenue (Million) Forecast, by Application 2019 & 2032
  24. Table 24: United Kingdom Video Managed Services Industry Volume (K Unit) Forecast, by Application 2019 & 2032
  25. Table 25: France Video Managed Services Industry Revenue (Million) Forecast, by Application 2019 & 2032
  26. Table 26: France Video Managed Services Industry Volume (K Unit) Forecast, by Application 2019 & 2032
  27. Table 27: Spain Video Managed Services Industry Revenue (Million) Forecast, by Application 2019 & 2032
  28. Table 28: Spain Video Managed Services Industry Volume (K Unit) Forecast, by Application 2019 & 2032
  29. Table 29: Italy Video Managed Services Industry Revenue (Million) Forecast, by Application 2019 & 2032
  30. Table 30: Italy Video Managed Services Industry Volume (K Unit) Forecast, by Application 2019 & 2032
  31. Table 31: Spain Video Managed Services Industry Revenue (Million) Forecast, by Application 2019 & 2032
  32. Table 32: Spain Video Managed Services Industry Volume (K Unit) Forecast, by Application 2019 & 2032
  33. Table 33: Belgium Video Managed Services Industry Revenue (Million) Forecast, by Application 2019 & 2032
  34. Table 34: Belgium Video Managed Services Industry Volume (K Unit) Forecast, by Application 2019 & 2032
  35. Table 35: Netherland Video Managed Services Industry Revenue (Million) Forecast, by Application 2019 & 2032
  36. Table 36: Netherland Video Managed Services Industry Volume (K Unit) Forecast, by Application 2019 & 2032
  37. Table 37: Nordics Video Managed Services Industry Revenue (Million) Forecast, by Application 2019 & 2032
  38. Table 38: Nordics Video Managed Services Industry Volume (K Unit) Forecast, by Application 2019 & 2032
  39. Table 39: Rest of Europe Video Managed Services Industry Revenue (Million) Forecast, by Application 2019 & 2032
  40. Table 40: Rest of Europe Video Managed Services Industry Volume (K Unit) Forecast, by Application 2019 & 2032
  41. Table 41: Global Video Managed Services Industry Revenue Million Forecast, by Country 2019 & 2032
  42. Table 42: Global Video Managed Services Industry Volume K Unit Forecast, by Country 2019 & 2032
  43. Table 43: China Video Managed Services Industry Revenue (Million) Forecast, by Application 2019 & 2032
  44. Table 44: China Video Managed Services Industry Volume (K Unit) Forecast, by Application 2019 & 2032
  45. Table 45: Japan Video Managed Services Industry Revenue (Million) Forecast, by Application 2019 & 2032
  46. Table 46: Japan Video Managed Services Industry Volume (K Unit) Forecast, by Application 2019 & 2032
  47. Table 47: India Video Managed Services Industry Revenue (Million) Forecast, by Application 2019 & 2032
  48. Table 48: India Video Managed Services Industry Volume (K Unit) Forecast, by Application 2019 & 2032
  49. Table 49: South Korea Video Managed Services Industry Revenue (Million) Forecast, by Application 2019 & 2032
  50. Table 50: South Korea Video Managed Services Industry Volume (K Unit) Forecast, by Application 2019 & 2032
  51. Table 51: Southeast Asia Video Managed Services Industry Revenue (Million) Forecast, by Application 2019 & 2032
  52. Table 52: Southeast Asia Video Managed Services Industry Volume (K Unit) Forecast, by Application 2019 & 2032
  53. Table 53: Australia Video Managed Services Industry Revenue (Million) Forecast, by Application 2019 & 2032
  54. Table 54: Australia Video Managed Services Industry Volume (K Unit) Forecast, by Application 2019 & 2032
  55. Table 55: Indonesia Video Managed Services Industry Revenue (Million) Forecast, by Application 2019 & 2032
  56. Table 56: Indonesia Video Managed Services Industry Volume (K Unit) Forecast, by Application 2019 & 2032
  57. Table 57: Phillipes Video Managed Services Industry Revenue (Million) Forecast, by Application 2019 & 2032
  58. Table 58: Phillipes Video Managed Services Industry Volume (K Unit) Forecast, by Application 2019 & 2032
  59. Table 59: Singapore Video Managed Services Industry Revenue (Million) Forecast, by Application 2019 & 2032
  60. Table 60: Singapore Video Managed Services Industry Volume (K Unit) Forecast, by Application 2019 & 2032
  61. Table 61: Thailandc Video Managed Services Industry Revenue (Million) Forecast, by Application 2019 & 2032
  62. Table 62: Thailandc Video Managed Services Industry Volume (K Unit) Forecast, by Application 2019 & 2032
  63. Table 63: Rest of Asia Pacific Video Managed Services Industry Revenue (Million) Forecast, by Application 2019 & 2032
  64. Table 64: Rest of Asia Pacific Video Managed Services Industry Volume (K Unit) Forecast, by Application 2019 & 2032
  65. Table 65: Global Video Managed Services Industry Revenue Million Forecast, by Country 2019 & 2032
  66. Table 66: Global Video Managed Services Industry Volume K Unit Forecast, by Country 2019 & 2032
  67. Table 67: Brazil Video Managed Services Industry Revenue (Million) Forecast, by Application 2019 & 2032
  68. Table 68: Brazil Video Managed Services Industry Volume (K Unit) Forecast, by Application 2019 & 2032
  69. Table 69: Argentina Video Managed Services Industry Revenue (Million) Forecast, by Application 2019 & 2032
  70. Table 70: Argentina Video Managed Services Industry Volume (K Unit) Forecast, by Application 2019 & 2032
  71. Table 71: Peru Video Managed Services Industry Revenue (Million) Forecast, by Application 2019 & 2032
  72. Table 72: Peru Video Managed Services Industry Volume (K Unit) Forecast, by Application 2019 & 2032
  73. Table 73: Chile Video Managed Services Industry Revenue (Million) Forecast, by Application 2019 & 2032
  74. Table 74: Chile Video Managed Services Industry Volume (K Unit) Forecast, by Application 2019 & 2032
  75. Table 75: Colombia Video Managed Services Industry Revenue (Million) Forecast, by Application 2019 & 2032
  76. Table 76: Colombia Video Managed Services Industry Volume (K Unit) Forecast, by Application 2019 & 2032
  77. Table 77: Ecuador Video Managed Services Industry Revenue (Million) Forecast, by Application 2019 & 2032
  78. Table 78: Ecuador Video Managed Services Industry Volume (K Unit) Forecast, by Application 2019 & 2032
  79. Table 79: Venezuela Video Managed Services Industry Revenue (Million) Forecast, by Application 2019 & 2032
  80. Table 80: Venezuela Video Managed Services Industry Volume (K Unit) Forecast, by Application 2019 & 2032
  81. Table 81: Rest of South America Video Managed Services Industry Revenue (Million) Forecast, by Application 2019 & 2032
  82. Table 82: Rest of South America Video Managed Services Industry Volume (K Unit) Forecast, by Application 2019 & 2032
  83. Table 83: Global Video Managed Services Industry Revenue Million Forecast, by Country 2019 & 2032
  84. Table 84: Global Video Managed Services Industry Volume K Unit Forecast, by Country 2019 & 2032
  85. Table 85: United States Video Managed Services Industry Revenue (Million) Forecast, by Application 2019 & 2032
  86. Table 86: United States Video Managed Services Industry Volume (K Unit) Forecast, by Application 2019 & 2032
  87. Table 87: Canada Video Managed Services Industry Revenue (Million) Forecast, by Application 2019 & 2032
  88. Table 88: Canada Video Managed Services Industry Volume (K Unit) Forecast, by Application 2019 & 2032
  89. Table 89: Mexico Video Managed Services Industry Revenue (Million) Forecast, by Application 2019 & 2032
  90. Table 90: Mexico Video Managed Services Industry Volume (K Unit) Forecast, by Application 2019 & 2032
  91. Table 91: Global Video Managed Services Industry Revenue Million Forecast, by Country 2019 & 2032
  92. Table 92: Global Video Managed Services Industry Volume K Unit Forecast, by Country 2019 & 2032
  93. Table 93: United Arab Emirates Video Managed Services Industry Revenue (Million) Forecast, by Application 2019 & 2032
  94. Table 94: United Arab Emirates Video Managed Services Industry Volume (K Unit) Forecast, by Application 2019 & 2032
  95. Table 95: Saudi Arabia Video Managed Services Industry Revenue (Million) Forecast, by Application 2019 & 2032
  96. Table 96: Saudi Arabia Video Managed Services Industry Volume (K Unit) Forecast, by Application 2019 & 2032
  97. Table 97: South Africa Video Managed Services Industry Revenue (Million) Forecast, by Application 2019 & 2032
  98. Table 98: South Africa Video Managed Services Industry Volume (K Unit) Forecast, by Application 2019 & 2032
  99. Table 99: Rest of Middle East and Africa Video Managed Services Industry Revenue (Million) Forecast, by Application 2019 & 2032
  100. Table 100: Rest of Middle East and Africa Video Managed Services Industry Volume (K Unit) Forecast, by Application 2019 & 2032
  101. Table 101: Global Video Managed Services Industry Revenue Million Forecast, by Type 2019 & 2032
  102. Table 102: Global Video Managed Services Industry Volume K Unit Forecast, by Type 2019 & 2032
  103. Table 103: Global Video Managed Services Industry Revenue Million Forecast, by Enterprise Size 2019 & 2032
  104. Table 104: Global Video Managed Services Industry Volume K Unit Forecast, by Enterprise Size 2019 & 2032
  105. Table 105: Global Video Managed Services Industry Revenue Million Forecast, by Applications 2019 & 2032
  106. Table 106: Global Video Managed Services Industry Volume K Unit Forecast, by Applications 2019 & 2032
  107. Table 107: Global Video Managed Services Industry Revenue Million Forecast, by Country 2019 & 2032
  108. Table 108: Global Video Managed Services Industry Volume K Unit Forecast, by Country 2019 & 2032
  109. Table 109: Global Video Managed Services Industry Revenue Million Forecast, by Type 2019 & 2032
  110. Table 110: Global Video Managed Services Industry Volume K Unit Forecast, by Type 2019 & 2032
  111. Table 111: Global Video Managed Services Industry Revenue Million Forecast, by Enterprise Size 2019 & 2032
  112. Table 112: Global Video Managed Services Industry Volume K Unit Forecast, by Enterprise Size 2019 & 2032
  113. Table 113: Global Video Managed Services Industry Revenue Million Forecast, by Applications 2019 & 2032
  114. Table 114: Global Video Managed Services Industry Volume K Unit Forecast, by Applications 2019 & 2032
  115. Table 115: Global Video Managed Services Industry Revenue Million Forecast, by Country 2019 & 2032
  116. Table 116: Global Video Managed Services Industry Volume K Unit Forecast, by Country 2019 & 2032
  117. Table 117: Global Video Managed Services Industry Revenue Million Forecast, by Type 2019 & 2032
  118. Table 118: Global Video Managed Services Industry Volume K Unit Forecast, by Type 2019 & 2032
  119. Table 119: Global Video Managed Services Industry Revenue Million Forecast, by Enterprise Size 2019 & 2032
  120. Table 120: Global Video Managed Services Industry Volume K Unit Forecast, by Enterprise Size 2019 & 2032
  121. Table 121: Global Video Managed Services Industry Revenue Million Forecast, by Applications 2019 & 2032
  122. Table 122: Global Video Managed Services Industry Volume K Unit Forecast, by Applications 2019 & 2032
  123. Table 123: Global Video Managed Services Industry Revenue Million Forecast, by Country 2019 & 2032
  124. Table 124: Global Video Managed Services Industry Volume K Unit Forecast, by Country 2019 & 2032
  125. Table 125: Global Video Managed Services Industry Revenue Million Forecast, by Type 2019 & 2032
  126. Table 126: Global Video Managed Services Industry Volume K Unit Forecast, by Type 2019 & 2032
  127. Table 127: Global Video Managed Services Industry Revenue Million Forecast, by Enterprise Size 2019 & 2032
  128. Table 128: Global Video Managed Services Industry Volume K Unit Forecast, by Enterprise Size 2019 & 2032
  129. Table 129: Global Video Managed Services Industry Revenue Million Forecast, by Applications 2019 & 2032
  130. Table 130: Global Video Managed Services Industry Volume K Unit Forecast, by Applications 2019 & 2032
  131. Table 131: Global Video Managed Services Industry Revenue Million Forecast, by Country 2019 & 2032
  132. Table 132: Global Video Managed Services Industry Volume K Unit Forecast, by Country 2019 & 2032


Frequently Asked Questions

1. What is the projected Compound Annual Growth Rate (CAGR) of the Video Managed Services Industry?

The projected CAGR is approximately 22.25%.

2. Which companies are prominent players in the Video Managed Services Industry?

Key companies in the market include Arkadin Cloud Communications ( NTT Communications), Polycom Inc, BT Conferencing Inc, Cisco Systems Inc, Macro Technologies Inc , Applied Global Technologies, Dimension Data, AVI-SPL Inc, ZTE Enterprise, AT&T Business, Telus Communications, Vega Global.

3. What are the main segments of the Video Managed Services Industry?

The market segments include Type, Enterprise Size, Applications.

4. Can you provide details about the market size?

The market size is estimated to be USD 15.43 Million as of 2022.

5. What are some drivers contributing to market growth?

Adoption of BYOD (Bring Your Own Device); Higher Productivity Rate by Reducing Unnecessary Hours.

6. What are the notable trends driving market growth?

Software Segment to Witness the Growth.

7. Are there any restraints impacting market growth?

High Initial Investments and Installation Costs.

8. Can you provide examples of recent developments in the market?

August 2023 - Quantum Corporation, the leader in solutions for video and unstructured data, announced a partnership with Tiger Surveillance, a leading provider of video surveillance data management and protection solutions, to deliver end-to-end solutions for long-term retention and archiving of video surveillance data.

9. What pricing options are available for accessing the report?

Pricing options include single-user, multi-user, and enterprise licenses priced at USD 4750, USD 5250, and USD 8750 respectively.

10. Is the market size provided in terms of value or volume?

The market size is provided in terms of value, measured in Million and volume, measured in K Unit.

11. Are there any specific market keywords associated with the report?

Yes, the market keyword associated with the report is "Video Managed Services Industry," which aids in identifying and referencing the specific market segment covered.

12. How do I determine which pricing option suits my needs best?

The pricing options vary based on user requirements and access needs. Individual users may opt for single-user licenses, while businesses requiring broader access may choose multi-user or enterprise licenses for cost-effective access to the report.

13. Are there any additional resources or data provided in the Video Managed Services Industry report?

While the report offers comprehensive insights, it's advisable to review the specific contents or supplementary materials provided to ascertain if additional resources or data are available.

14. How can I stay updated on further developments or reports in the Video Managed Services Industry?

To stay informed about further developments, trends, and reports in the Video Managed Services Industry, consider subscribing to industry newsletters, following relevant companies and organizations, or regularly checking reputable industry news sources and publications.


Methodology

Step 1 - Identification of Relevant Samples Size from Population Database

Step Chart
Bar Chart
Method Chart

Step 2 - Approaches for Defining Global Market Size (Value, Volume* & Price*)

Approach Chart
Top-down and bottom-up approaches are used to validate the global market size and estimate the market size for manufactures, regional segments, product, and application.

Note*: In applicable scenarios

Step 3 - Data Sources

Primary Research

  • Web Analytics
  • Survey Reports
  • Research Institute
  • Latest Research Reports
  • Opinion Leaders

Secondary Research

  • Annual Reports
  • White Paper
  • Latest Press Release
  • Industry Association
  • Paid Database
  • Investor Presentations
Analyst Chart

Step 4 - Data Triangulation

Involves using different sources of information in order to increase the validity of a study

These sources are likely to be stakeholders in a program - participants, other researchers, program staff, other community members, and so on.

Then we put all data in single framework & apply various statistical tools to find out the dynamic on the market.

During the analysis stage, feedback from the stakeholder groups would be compared to determine areas of agreement as well as areas of divergence

Additionally, after gathering mixed and scattered data from a wide range of sources, data is triangulated and correlated to come up with estimated figures which are further validated through primary mediums or industry experts, opinion leaders.

About Visionary Data Reports

Visionary Data Reports provides future-focused market research, advanced analytics, and strategic insights for technology, healthcare, green energy, and finance. Our reports help you anticipate trends, innovate, and lead in your industry. Our expert team combines primary research, data science, and industry knowledge to deliver actionable intelligence. We offer syndicated reports, custom analytics, and consulting services tailored to your business needs. At Visionary Data Reports, we are committed to quality, transparency, and client satisfaction. Every report is rigorously validated to ensure accuracy and relevance. Our global perspective and forward-thinking approach help you understand both current and emerging market dynamics.

Stay ahead with Visionary Data Reports. Subscribe to our newsletter for the latest insights and research highlights, and follow us on social media for real-time updates. Visionary Data Reports – Your Guide to Tomorrow’s Opportunities.

artwork spiralartwork spiralRelated Reports
artwork underline

Video Telematics Market Industry Analysis and Consumer Behavior

Explore the booming Video Telematics Market, projected for robust growth to $5.5 billion by 2025 with a 17.9% CAGR. Discover key drivers, trends, and leading companies shaping the future of fleet safety and management.

September 2025
Base Year: 2024
No Of Pages: 234
Price: $4750

Norway Telecom Market Analysis Uncovered: Market Drivers and Forecasts 2025-2033

Explore the Norway Telecom Market's dynamic growth, driven by high-speed data, OTT services, and 5G. Discover key trends, drivers, and restraints shaping this evolving market from 2019-2033.

September 2025
Base Year: 2024
No Of Pages: 197
Price: $3800

Strategic Projections for Europe Mobile Virtual Network Operator (MVNO) Market Market Expansion

Explore the booming European Mobile Virtual Network Operator (MVNO) market, driven by flexible plans and digital economy growth. Get insights into market size, CAGR, key drivers, trends, restraints, segments, and leading companies in Europe.

September 2025
Base Year: 2024
No Of Pages: 210
Price: $4750

Oil & Gas Automation Industry and Emerging Technologies: Growth Insights 2025-2033

Explore the dynamic Oil & Gas Automation Industry, driven by digital transformation and advanced technologies. Discover market size, CAGR, key drivers, and regional growth trends for 2025-2033.

September 2025
Base Year: 2024
No Of Pages: 234
Price: $4750

Strategic Planning for 3D Printing Market Industry Expansion

Explore the dynamic 3D Printing Market with a CAGR of 22.66%, driven by advancements in SLA, FDM, and SLS technologies. Discover market size, growth projections, key drivers, and leading companies shaping the future of additive manufacturing.

September 2025
Base Year: 2024
No Of Pages: 234
Price: $4750

Emerging Growth Patterns in Hong Kong Data Center Physical Security Market Market

The size of the Hong Kong Data Center Physical Security Market market was valued at USD 29.92 Million in 2024 and is projected to reach USD 110.38 Million by 2033, with an expected CAGR of 20.50% during the forecast period.

September 2025
Base Year: 2024
No Of Pages: 197
Price: $3800

Consumer Trends Driving Europe Video Surveillance Storage Market Market Growth

Explore the booming European video surveillance storage market, driven by technological advancements and increasing security needs. Discover market size, CAGR, key drivers, trends, restraints, segments, and leading companies shaping the future of video data management.

September 2025
Base Year: 2024
No Of Pages: 210
Price: $4750

Exploring Innovations in Hong Kong Payment Industry: Market Dynamics 2025-2033

The size of the Hong Kong Payment Industry market was valued at USD 146.17 Million in 2024 and is projected to reach USD 214.90 Million by 2033, with an expected CAGR of 5.66% during the forecast period.

August 2025
Base Year: 2024
No Of Pages: 197
Price: $3800

Consumer-Centric Trends in Australia Payments Industry Industry

The Australian payments industry is booming, projected to reach $0.92B in 2025 and grow at a 16.44% CAGR until 2033. Driven by digital wallets, e-commerce, and cashless trends, this market analysis explores key drivers, trends, and major players like Mastercard, Visa, and Amazon Pay. Discover the future of Australian payments.

August 2025
Base Year: 2024
No Of Pages: 197
Price: $3800

Strategic Roadmap for LATAM Payment Gateway Market Industry

The LATAM payment gateway market is booming, projected to reach $4.78 billion by 2025 with a 22.87% CAGR. Discover key drivers, trends, and challenges shaping this rapidly growing sector, including insights into leading players like Mercado Pago and PayPal. Explore market segmentation by region (Brazil, Argentina, Mexico) and end-user industry.

August 2025
Base Year: 2024
No Of Pages: 234
Price: $4750

Analyzing Domestic Service Robots Market: Opportunities and Growth Patterns 2025-2033

The booming domestic service robot market is projected to reach $11.04 billion by 2025, with a 16% CAGR. Discover key trends, leading companies (iRobot, Ecovacs), and regional market analysis in this comprehensive report. Learn about the growth drivers, including smart home technology and AI advancements, impacting vacuuming robots, lawn mowers, and companionship robots.

August 2025
Base Year: 2024
No Of Pages: 234
Price: $4750

African Telecommunication Towers Market Market’s Evolution: Key Growth Drivers 2025-2033

The African telecommunication towers market is booming, projected to reach $XX million by 2033 with a 4.63% CAGR. Driven by rising mobile subscriptions, 5G rollout, and government initiatives, this market offers significant opportunities. Key players, market segmentation, and regional insights are analyzed in this comprehensive report.

August 2025
Base Year: 2024
No Of Pages: 210
Price: $4750

China MLCC Market Insightful Market Analysis: Trends and Opportunities 2025-2033

Discover the booming China MLCC market forecast to 2033! This in-depth analysis reveals key growth drivers, market segmentation (dielectric type, case size, voltage, capacitance, mounting type), competitive landscape, and regional trends. Explore the impact of automotive, consumer electronics, and 5G technology on this rapidly expanding sector.

August 2025
Base Year: 2024
No Of Pages: 197
Price: $3800

Analyzing Consumer Behavior in India Location-based Services Market Market

The India Location-Based Services (LBS) market is booming, projected to reach \$1.58 billion in 2025, growing at a CAGR of 19.52% till 2033. Discover key drivers, trends, and market segmentation in this comprehensive analysis. Learn about leading companies and future growth opportunities in India's thriving LBS sector.

August 2025
Base Year: 2024
No Of Pages: 197
Price: $3800

France Mobile Payment Market 2025 Market Trends and 2033 Forecasts: Exploring Growth Potential

The France mobile payment market is booming, with a 30% CAGR projected to 2033. This in-depth analysis explores market size, key drivers & trends (e.g., contactless payments, super-apps), leading companies (Visa, PayPal, Apple Pay), and future growth potential. Discover the opportunities and challenges in this dynamic sector.

August 2025
Base Year: 2024
No Of Pages: 197
Price: $3800

Decoding Market Trends in Indonesia Data Center Server Market: 2025-2033 Analysis

Discover the booming Indonesia data center server market! This in-depth analysis reveals a 14% CAGR, key drivers like 5G expansion and cloud adoption, and leading players like HP Enterprise and Lenovo. Explore market trends, segmentations, and future growth projections for 2025-2033.

August 2025
Base Year: 2024
No Of Pages: 197
Price: $3800

Data Visualization Industry Competitive Strategies: Trends and Forecasts 2025-2033

The Data Visualization market is booming, projected to reach $9.84B in 2025 with a 10.95% CAGR. Discover key trends, drivers, and restraints impacting this rapidly growing sector, including insights on leading companies, deployment modes, and regional market shares. Explore the future of data visualization and its transformative impact on various industries.

August 2025
Base Year: 2024
No Of Pages: 234
Price: $4750

North America Digital Transformation Market Market Trends and Insights

North America's booming digital transformation market is projected to reach $2.67 billion by 2033, fueled by AI/ML, IoT, and XR. Discover key trends, growth drivers, and leading companies shaping this dynamic sector. Explore market analysis and projections for AI, machine learning, IoT, and extended reality (VR/AR) adoption in North America.

August 2025
Base Year: 2024
No Of Pages: 210
Price: $4750

Iceland E-commerce Market XX CAGR Growth Outlook 2025-2033

Discover the booming Iceland e-commerce market! Explore its 14.80% CAGR, key players (Amazon, ASOS, etc.), and future growth projections through 2033. Learn about market drivers, trends, and challenges in this comprehensive analysis.

August 2025
Base Year: 2024
No Of Pages: 197
Price: $3800

Remote Monitoring and Control Solutions Market 2025-2033 Trends and Competitor Dynamics: Unlocking Growth Opportunities

Discover the booming Remote Monitoring and Control Solutions market! Explore key trends, drivers, and restraints shaping this $XX million industry, projected to grow at a 4.60% CAGR through 2033. Learn about leading companies, regional breakdowns, and the crucial role of IoT and Industry 4.0. Get insights into the future of remote monitoring and control.

August 2025
Base Year: 2024
No Of Pages: 234
Price: $4750

South Korea Data Center Physical Security Market Projected to Grow at XX CAGR: Insights and Forecasts 2025-2033

The South Korea Data Center Physical Security Market is booming, projected to reach $29.38 million in 2025 with a 20.91% CAGR. Discover key drivers, trends, and restraints impacting this rapidly growing sector, including leading companies like Dahua, Honeywell, and Hikvision. Explore market segmentation by solution & service type and end-user industries. Learn more about the future of data center security in South Korea.

August 2025
Base Year: 2024
No Of Pages: 197
Price: $3800

Augmented Analytics Market Industry’s Growth Dynamics and Insights

Discover the explosive growth of the Augmented Analytics market, projected to reach \$23.27B by 2025 with a 28.09% CAGR. This in-depth analysis explores key drivers, trends, restraints, and leading companies shaping this transformative technology across BFSI, retail, and healthcare. Learn about market segmentation and regional insights.

August 2025
Base Year: 2024
No Of Pages: 234
Price: $4750

Drivers of Change in Europe Industrial Gas Sensors Market Market 2025-2033

The Europe Industrial Gas Sensor Market is booming, projected to reach €802 million by 2033 with a CAGR of 5.91%. This report analyzes market drivers, trends, restraints, and key players, covering segments like gas type, connectivity, technology, and application across major European countries. Discover growth opportunities in this expanding sector.

August 2025
Base Year: 2024
No Of Pages: 234
Price: $4750

Decoding Underground Utility Mapping Market Consumer Preferences 2025-2033

The Underground Utility Mapping market is booming, projected to reach $1.32 billion by 2025, with a CAGR exceeding 9.61%. Driven by urbanization and safety regulations, this market utilizes advanced technologies like GPR and GIS. Learn about key players, regional trends, and growth opportunities in this in-depth analysis.

August 2025
Base Year: 2024
No Of Pages: 234
Price: $4750

Blockchain Supply Chain Market Future-proof Strategies: Trends, Competitor Dynamics, and Opportunities 2025-2033

The Blockchain Supply Chain market is booming, projected to reach $840 million in 2025 with a 49.87% CAGR. Discover key drivers, trends, and regional insights into this transformative technology impacting retail, healthcare, and manufacturing. Explore leading companies and investment opportunities in this rapidly expanding sector.

August 2025
Base Year: 2024
No Of Pages: 234
Price: $4750

Strategic Insights for Integrated Facility Management Market Market Growth

The Integrated Facility Management (IFM) market is booming, projected to reach $154.19 billion by 2025 with a 7.08% CAGR. Discover key drivers, trends, and regional insights in this comprehensive market analysis, featuring top players like Cushman & Wakefield and CBRE. Explore the growth potential across segments like hard & soft FM and various end-users.

August 2025
Base Year: 2024
No Of Pages: 234
Price: $4750

Online Casual Games Market Market Disruption and Future Trends

The online casual games market is booming, projected to hit \$20.48 billion in 2025 with a 6.12% CAGR. Discover key drivers, trends, and top players shaping this explosive growth in mobile gaming. Explore market segmentation, regional insights, and future forecasts.

August 2025
Base Year: 2024
No Of Pages: 234
Price: $4750

Exploring Asia Pacific Smartphone Camera Module Market Market Ecosystem: Insights to 2033

The Asia-Pacific smartphone camera module market is booming, projected to reach \$XX million by 2033, driven by rising smartphone adoption and advanced camera features. Discover key trends, leading companies, and regional insights in this comprehensive market analysis.

August 2025
Base Year: 2024
No Of Pages: 210
Price: $4750

Head-Mounted Display Market in North America: Market Dynamics and Forecasts 2025-2033

The Head-Mounted Display (HMD) market is booming, projected to reach $7.5B in 2025 with a 28.62% CAGR. Discover key trends, drivers, and restraints shaping this dynamic industry, featuring major players like Sony, Meta, and Zebra Technologies. Explore the future of VR/AR and immersive experiences.

August 2025
Base Year: 2024
No Of Pages: 234
Price: $4750

North America Hazardous Location Motors Market Strategic Insights: Analysis 2025 and Forecasts 2033

The North America Hazardous Location Motors market is booming, projected to reach $XX million by 2033 with a 5.10% CAGR. Driven by safety regulations and technological advancements, this market analysis reveals key trends, segments (explosion-proof, Class I, Division 1), leading companies (ABB, WEG, Emerson), and regional insights. Explore the growth opportunities in this vital industry.

August 2025
Base Year: 2024
No Of Pages: 210
Price: $4750

Consumer-Driven Trends in Managed Mobility Services Industry Market

The Managed Mobility Services (MMS) market is booming, projected to reach $6.07 billion by 2025 with a 25.41% CAGR. Discover key trends, drivers, restraints, and leading companies shaping this rapidly growing sector across North America, Europe, and Asia Pacific. Explore market segmentation by end-user, function, and deployment.

August 2025
Base Year: 2024
No Of Pages: 234
Price: $4750

US Location-based Services Market 2025-2033: Preparing for Growth and Change

The US Location-based Services (LBS) market is booming, projected to reach [estimated market size in 2033, based on chart_data] by 2033, with a CAGR of 14.24%. Discover key trends, drivers, and leading companies shaping this dynamic sector, including Google, Cisco, and ESRI. Explore market segmentation by component, location, application, and end-user.

August 2025
Base Year: 2024
No Of Pages: 197
Price: $3800

Unveiling Technology in Real Estate Industry Industry Trends

Discover the booming Technology in Real Estate market! Our in-depth analysis reveals a CAGR of 10.32% and explores key drivers, trends, and regional insights for 2025-2033. Learn about top players like Salesforce and Yardi, and understand the impact of cloud solutions, AI, and data analytics on the industry.

August 2025
Base Year: 2024
No Of Pages: 234
Price: $4750

WaaS as a Service Industry Insightful Market Analysis: Trends and Opportunities 2025-2033

Discover the booming Workload as a Service (WaaS) market! This in-depth analysis reveals a 9.70% CAGR, key drivers, trends, and regional breakdowns (North America, Europe, Asia-Pacific). Learn about leading companies and future growth projections for DaaS, AaaS, and more.

August 2025
Base Year: 2024
No Of Pages: 234
Price: $4750

Asia Pacific Industrial Embedded Systems Market 2025-2033 Overview: Trends, Competitor Dynamics, and Opportunities

The Asia Pacific Industrial Embedded Systems market is booming, projected to reach $12.42 billion by 2025 with an 8.20% CAGR. Discover key growth drivers, trends, and leading companies shaping this dynamic market. Explore regional breakdowns and future forecasts for smart manufacturing and IoT integration.

August 2025
Base Year: 2024
No Of Pages: 210
Price: $4750

Big Data Engineering Services Industry Soars to XXX Million, witnessing a CAGR of XX during the forecast period 2025-2033

The Big Data Engineering Services market is booming, projected to reach $79.34 million in 2025 with a 15.38% CAGR. Discover key drivers, trends, and regional insights in this comprehensive market analysis, including top companies and future growth predictions. Explore the impact of cloud adoption, AI, and data governance on this dynamic industry.

August 2025
Base Year: 2024
No Of Pages: 234
Price: $4750

North America Induction Motor Market Market’s Decade-Long Growth Trends and Future Projections 2025-2033

Discover the booming North America induction motor market! This comprehensive analysis reveals key trends, drivers, restraints, and leading companies shaping the industry's 6.30% CAGR growth to 2033. Explore market segmentation, regional breakdowns (US, Canada, Mexico), and future projections for this dynamic sector.

August 2025
Base Year: 2024
No Of Pages: 210
Price: $4750

Horticulture Lighting Market Market Expansion Strategies

The horticulture lighting market is booming, projected to reach $30 billion by 2033, driven by LED technology advancements and the rise of vertical farming. Explore market trends, key players (Signify, Gavita, Osram), and regional insights in this comprehensive analysis.

August 2025
Base Year: 2024
No Of Pages: 234
Price: $4750

Exploring Key Trends in DTM Industry Market

The Digital Transaction Management (DTM) market is booming, projected to reach $12.52 billion by 2025 and grow at a CAGR of 24.54% through 2033. This comprehensive analysis explores market drivers, trends, restraints, key players (DocuSign, Adobe, etc.), and regional insights. Learn how cloud-based solutions and increasing regulatory compliance are shaping the future of e-signature and document management.

August 2025
Base Year: 2024
No Of Pages: 234
Price: $4750

Thin Film Transistor Industry Market’s Role in Emerging Tech: Insights and Projections 2025-2033

Discover the booming Thin Film Transistor (TFT) market! Explore its 17.34% CAGR, key drivers, and leading companies like Samsung and LG Display. Learn about market segmentation, regional analysis (North America, Europe, Asia Pacific), and future growth projections to 2033. Get insights into LCD, AMOLED, and other display technologies.

August 2025
Base Year: 2024
No Of Pages: 234
Price: $4750

Video Management System Market Growth Pathways: Strategic Analysis and Forecasts 2025-2033

The Video Management System (VMS) market is booming, projected to reach $15.83B in 2025 with a 22.70% CAGR. Discover key trends, drivers, and restraints shaping this dynamic sector, including cloud adoption, AI integration, and competitive landscape analysis. Learn about top players like Honeywell and Hikvision.

August 2025
Base Year: 2024
No Of Pages: 234
Price: $4750

Exploring Innovation in India Electronic Access Control Systems Industry Industry

The India Electronic Access Control Systems market is booming, with a CAGR exceeding 7.60%. This in-depth analysis explores market size, key drivers (biometrics, smart cards), restraints, regional trends (North, South, East, West India), and leading companies like Honeywell and IDEMIA. Discover growth projections for 2025-2033.

August 2025
Base Year: 2024
No Of Pages: 197
Price: $3800

Exploring Innovation in Mexico Data Center Power Market Industry

Discover the booming Mexico data center power market! This in-depth analysis reveals a \$437.80 million market in 2025, projected to grow at a 7.10% CAGR through 2033, driven by cloud adoption and digital transformation. Explore key players, market segments, and future trends impacting PDUs, switchgear, and more.

August 2025
Base Year: 2024
No Of Pages: 197
Price: $3800

Strategic Analysis of Cyber Security Industry in Vietnamese Industry Opportunities

Discover the booming Vietnamese cybersecurity market! This comprehensive analysis reveals a CAGR of 16.80%, driven by digital transformation and rising cyber threats. Explore market size projections, key players (IBM, AWS, Viettel), and growth opportunities in cloud, on-premise, and various end-user segments.

August 2025
Base Year: 2024
No Of Pages: 197
Price: $3800

Heat Pump Market in US Market Report: Trends and Growth

Discover the booming US heat pump market! Explore 2025-2033 growth projections, regional analysis, key drivers, and leading companies shaping this energy-efficient sector. Learn about air-source, water-source, and geothermal heat pump trends.

August 2025
Base Year: 2024
No Of Pages: 197
Price: $3800

Emerging Japan Cloud Computing Market Trends and Opportunities

Discover the booming Japan cloud computing market! This in-depth analysis reveals a $24.61B market in 2025, growing at a 16.65% CAGR through 2033. Learn about key drivers, challenges, and top players like AWS, Google Cloud, and Microsoft Azure. Explore regional market share and future growth projections.

August 2025
Base Year: 2024
No Of Pages: 197
Price: $3800

Malaysia Digital Transformation Market CAGR Trends: Growth Outlook 2025-2033

The Malaysia Digital Transformation Market is booming, projected to reach $8.98B in 2025, with a CAGR of 18.92% (2019-2033). Explore key drivers, trends, and challenges shaping this dynamic sector, including government initiatives, technological advancements, and competitive landscape analysis. Discover insights into market segmentation and leading companies.

August 2025
Base Year: 2024
No Of Pages: 197
Price: $3800

Europe Data Center Rack Market Market Analysis and Forecasts

The European data center rack market is booming, with an 8.80% CAGR projected to 2033. Driven by cloud computing, big data, and digital transformation, this report analyzes market size, key players (Fujitsu, Legrand, HPE, etc.), regional trends (Germany, UK, France leading), and segment growth (IT, BFSI, Government). Discover key insights and forecast data for this rapidly expanding sector.

August 2025
Base Year: 2024
No Of Pages: 210
Price: $4750

APAC Commercial Interior Design Software Market Insightful Market Analysis: Trends and Opportunities 2025-2033

The APAC commercial interior design software market is booming, projected to reach $1.18B by 2025 with an 11.10% CAGR. Discover key drivers, trends, and leading companies shaping this dynamic sector. Learn more about BIM software, market segmentation, and future growth projections in this comprehensive analysis.

August 2025
Base Year: 2024
No Of Pages: 210
Price: $4750

Big Data Services Market: Growth Opportunities and Competitive Landscape Overview 2025-2033

The Big Data Services market is booming, projected to reach \$32.51 billion by 2025 with a CAGR of 27.81%. Discover key trends, drivers, restraints, and regional analysis in this comprehensive market report covering cloud, on-premise solutions across major sectors.

August 2025
Base Year: 2024
No Of Pages: 234
Price: $4750
  • Home
  • About Us
  • Industries
    • Aerospace & Defense
    • Agriculture
    • Animal Nutrition & Wellness
    • Automotive
    • Chemicals & Materials
    • Consumer Goods and Services
    • Energy & Power
    • Financial Services and Investment Intelligence
    • Food & Beverage
    • Home and Property Improvement
    • Hospitality and Tourism
    • Logistics
    • Manufacturing Products and Services
    • Packaging
    • Professional and Commercial Services
    • Real Estate and Construction
    • Retail
    • Technology, Media and Telecom
    • Healthcare
  • Services
  • Contact
Main Logo
  • Home
  • About Us
  • Industries
    • Aerospace & Defense
    • Agriculture
    • Animal Nutrition & Wellness
    • Automotive
    • Chemicals & Materials
    • Consumer Goods and Services
    • Energy & Power
    • Financial Services and Investment Intelligence
    • Food & Beverage
    • Home and Property Improvement
    • Hospitality and Tourism
    • Logistics
    • Manufacturing Products and Services
    • Packaging
    • Professional and Commercial Services
    • Real Estate and Construction
    • Retail
    • Technology, Media and Telecom
    • Healthcare
  • Services
  • Contact
+17162654855
[email protected]

+17162654855

[email protected]

Business Address

Head Office

Ansec House 3 rd floor Tank Road, Yerwada, Pune, Maharashtra 411014

Contact Information

Craig Francis

Business Development Head

+17162654855

[email protected]

Secure Payment Partners

payment image
RetailLogisticsPackagingAutomotiveHealthcareAgricultureEnergy & PowerFood & BeverageAerospace & DefenseChemicals & MaterialsHospitality and TourismAnimal Nutrition & WellnessConsumer Goods and ServicesReal Estate and ConstructionHome and Property ImprovementTechnology, Media and TelecomManufacturing Products and ServicesFinancial Services and Investment Intelligence

© 2025 PRDUA Research & Media Private Limited, All rights reserved

Privacy Policy
Terms and Conditions
FAQ