

Key Insights
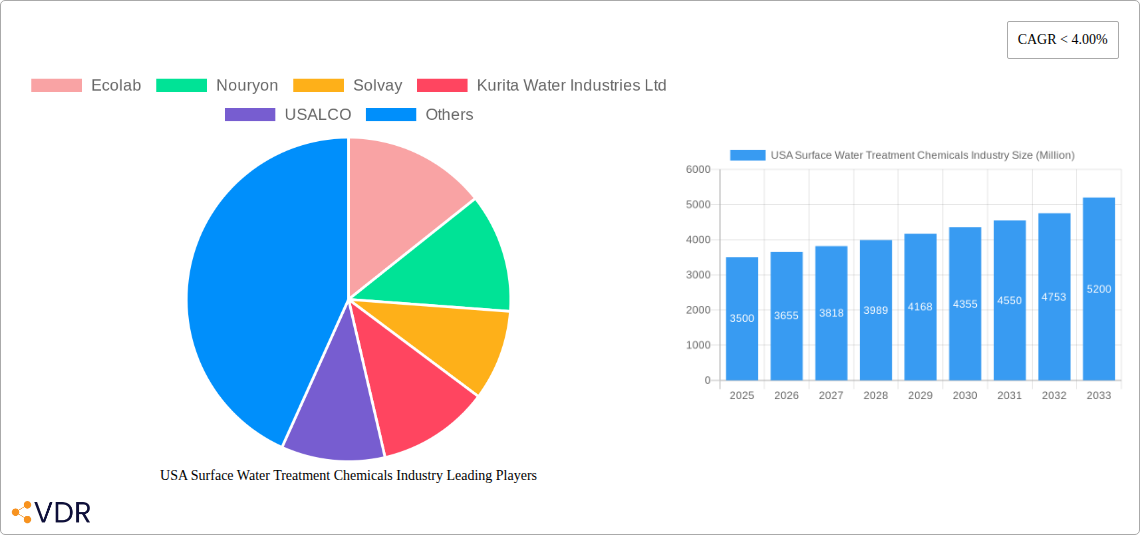
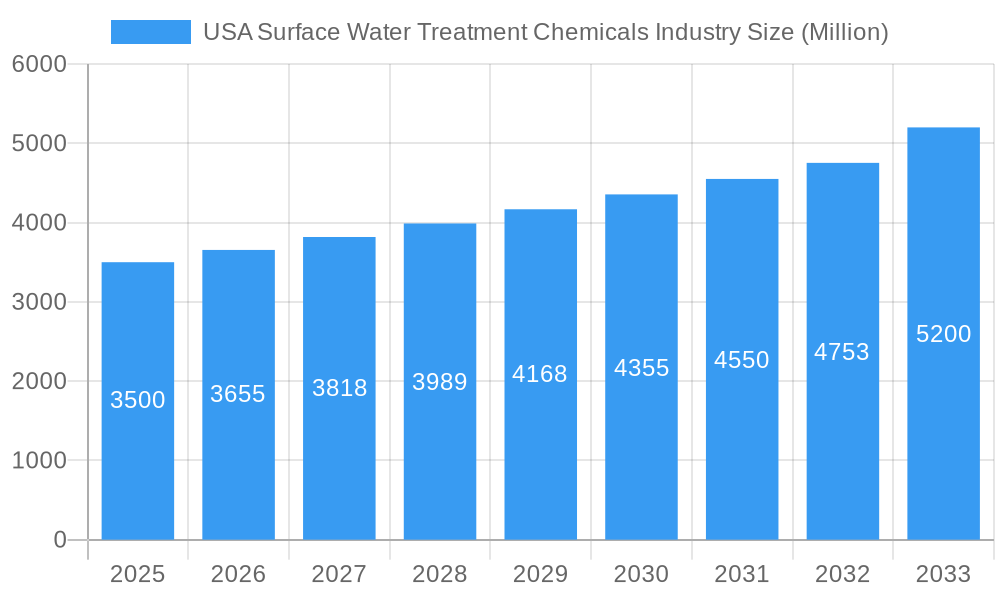
The USA surface water treatment chemicals market is experiencing robust growth, driven by increasing concerns about water quality and stringent government regulations. The historical period (2019-2024) saw significant expansion, fueled by a rising population, industrialization, and the need for safe drinking water. We estimate the market size in 2025 to be $3.5 billion, based on observed trends and projected growth rates in related sectors. This represents a substantial increase from the estimated 2019 market size of $2.5 billion. The growth is further propelled by advancements in water treatment technologies, including membrane filtration and advanced oxidation processes, which require specialized chemicals. Furthermore, the increasing prevalence of waterborne diseases and the growing awareness among consumers about the importance of clean water are also bolstering demand for these chemicals.
USA Surface Water Treatment Chemicals Industry Market Size (In Billion)
Looking ahead to the forecast period (2025-2033), the market is poised for continued expansion, albeit at a slightly moderated pace. We project a Compound Annual Growth Rate (CAGR) of 4.5% for this period, resulting in an estimated market size of approximately $5.2 billion by 2033. This projection takes into account factors such as economic growth, infrastructure development, and evolving regulatory landscapes. However, potential challenges include fluctuations in raw material prices and the emergence of alternative treatment technologies. The market will likely witness increased competition among established players and new entrants, driving innovation and potentially leading to price adjustments. Specific market segments, such as coagulants, disinfectants, and corrosion inhibitors, will exhibit varying growth rates depending on technological advancements and regulatory changes.
USA Surface Water Treatment Chemicals Industry Company Market Share
USA Surface Water Treatment Chemicals Industry: A Comprehensive Market Report (2019-2033)
This comprehensive report provides an in-depth analysis of the USA surface water treatment chemicals market, offering invaluable insights for industry professionals, investors, and strategic decision-makers. With a focus on key market segments and prominent players, this report projects a robust growth trajectory driven by increasing water scarcity, stringent environmental regulations, and technological advancements. The study period spans 2019-2033, with 2025 serving as the base and estimated year.
USA Surface Water Treatment Chemicals Industry Market Dynamics & Structure
The US surface water treatment chemicals market is characterized by moderate concentration, with key players like Ecolab, Nouryon, Solvay, and Kurita Water Industries Ltd holding significant market share. Technological innovation, particularly in biocides and advanced oxidation processes, is a key driver. Stringent EPA regulations regarding water discharge quality exert considerable influence, prompting the adoption of more efficient and environmentally friendly treatment solutions. Competitive substitution from alternative treatment technologies (e.g., membrane filtration) and evolving end-user preferences present ongoing challenges. M&A activity has been relatively moderate in recent years, with approximately xx deals recorded between 2019 and 2024, averaging xx million USD in value.
- Market Concentration: Moderately concentrated, with top 5 players holding approximately 55% market share in 2024.
- Technological Innovation: Focus on sustainable and efficient treatment solutions, driving demand for advanced oxidation processes and bio-based chemicals.
- Regulatory Framework: Stringent EPA regulations drive demand for compliant, high-performance chemicals.
- Competitive Substitutes: Membrane filtration and other advanced treatment technologies pose competitive pressure.
- End-User Demographics: Municipal and industrial sectors (power, oil & gas) are the primary end-users, with increasing demand from the food & beverage sector.
- M&A Trends: Moderate M&A activity, focused on expanding product portfolios and geographical reach.
USA Surface Water Treatment Chemicals Industry Growth Trends & Insights
The US surface water treatment chemicals market experienced steady growth during the historical period (2019-2024), with a CAGR of approximately xx%. Market size reached xx million in 2024. This growth is attributed to increasing industrial activity, rising urbanization, and stricter environmental regulations. Technological advancements, particularly in the development of more effective and sustainable chemicals, have further boosted market adoption. Consumer behavior shifts towards eco-friendly solutions are also influencing market dynamics. The forecast period (2025-2033) anticipates continued growth, driven by increasing water stress and expanding infrastructure projects. We project a CAGR of xx% during this period, resulting in a market size of xx million by 2033. Market penetration in key end-user segments continues to rise, particularly in the municipal and industrial sectors.
Dominant Regions, Countries, or Segments in USA Surface Water Treatment Chemicals Industry
The Western and Southern regions of the USA represent the dominant markets for surface water treatment chemicals, driven by higher industrial activity and population density. Within product types, coagulants and flocculants command the largest market share, followed by biocides and disinfectants. The municipal sector is the largest end-user segment, accounting for approximately xx% of total market value in 2024, followed by the power generation and oil & gas sectors. Growth is predominantly driven by:
- High Industrial Activity: Concentration of industrial facilities in specific regions drives demand.
- Stringent Environmental Regulations: Compliance needs spur adoption of advanced treatment solutions.
- Aging Infrastructure: Need for upgrades and replacements in water treatment plants creates opportunities.
- Population Growth: Increasing urbanization leads to higher water consumption and treatment needs.
- Municipal Investments: Increasing government funding for water infrastructure projects.
USA Surface Water Treatment Chemicals Industry Product Landscape
The market offers a diverse range of chemicals tailored to specific water treatment needs. Innovations focus on enhancing efficacy, reducing environmental impact, and optimizing cost-effectiveness. Biocides are increasingly formulated with lower toxicity profiles, while coagulants and flocculants are designed for improved sedimentation and filtration efficiency. Performance is measured through key parameters like residual chlorine levels, turbidity reduction, and the efficiency of scale inhibition. Unique selling propositions often emphasize sustainability, regulatory compliance, and enhanced process efficiency.
Key Drivers, Barriers & Challenges in USA Surface Water Treatment Chemicals Industry
Key Drivers: Increasing water scarcity, stringent environmental regulations, rising industrial activity, and growing urbanization are key market drivers. Government investments in water infrastructure projects also contribute to market growth.
Challenges: Fluctuating raw material prices, stringent regulatory compliance requirements, and intense competition among established players create significant challenges. Supply chain disruptions due to geopolitical events can impact availability and pricing. The need for continuous innovation to meet evolving regulatory standards and consumer preferences also presents a challenge.
Emerging Opportunities in USA Surface Water Treatment Chemicals Industry
Untapped markets in smaller municipalities and rural areas present significant growth potential. Furthermore, increasing demand for advanced oxidation processes (AOPs) for removing persistent pollutants creates opportunities. The shift towards more sustainable and environmentally friendly chemicals, along with the development of integrated water management solutions, offers further growth avenues.
Growth Accelerators in the USA Surface Water Treatment Chemicals Industry Industry
Technological advancements such as nanotechnology and AI-driven process optimization are accelerating market growth. Strategic partnerships between chemical manufacturers and water treatment companies are fostering innovation. Expanding market access through acquisitions and joint ventures further enhances market growth. Government initiatives to promote sustainable water management also play a crucial role.
Key Players Shaping the USA Surface Water Treatment Chemicals Industry Market
- Ecolab
- Nouryon
- Solvay
- Kurita Water Industries Ltd
- USALCO
- SUEZ
- Kemira
- Dow
- ChemTreat Inc
- Solenis
- Buckman Laboratories Inc
- Veolia
- Albemarle Corporation
- Chemtrade
Notable Milestones in USA Surface Water Treatment Chemicals Industry Sector
- 2020: Ecolab launched a new range of sustainable biocides.
- 2021: Nouryon expanded its production capacity for coagulants.
- 2022: Solvay acquired a smaller water treatment chemicals company, expanding its product portfolio.
- 2023: New EPA regulations on PFAS in water spurred innovation in treatment technologies.
In-Depth USA Surface Water Treatment Chemicals Industry Market Outlook
The US surface water treatment chemicals market is poised for continued expansion, fueled by technological innovation, increasing water scarcity, and stringent environmental regulations. Strategic partnerships, M&A activities, and the development of sustainable solutions will drive long-term growth. The market offers substantial opportunities for companies that can effectively leverage these drivers and adapt to the evolving regulatory landscape. The forecast indicates significant market expansion, presenting attractive investment prospects and fostering innovation within the sector.
USA Surface Water Treatment Chemicals Industry Segmentation
-
1. Product Type
- 1.1. Biocides and Disinfectants
- 1.2. Coagulants and Flocculants
- 1.3. Corrosion and Scale Inhibitors
- 1.4. Defoamers and Defoaming Agents
- 1.5. pH & Adjusters and Softeners
- 1.6. Other Product Types
-
2. End-user Industry
- 2.1. Power
- 2.2. Oil and Gas
- 2.3. Chemical Manufacturing
- 2.4. Mining and Mineral Processing
- 2.5. Municipal
- 2.6. Food and Beverage
- 2.7. Pulp and Paper
- 2.8. Other End-user Industries
USA Surface Water Treatment Chemicals Industry Segmentation By Geography
-
1. North America
- 1.1. United States
- 1.2. Canada
- 1.3. Mexico
-
2. South America
- 2.1. Brazil
- 2.2. Argentina
- 2.3. Rest of South America
-
3. Europe
- 3.1. United Kingdom
- 3.2. Germany
- 3.3. France
- 3.4. Italy
- 3.5. Spain
- 3.6. Russia
- 3.7. Benelux
- 3.8. Nordics
- 3.9. Rest of Europe
-
4. Middle East & Africa
- 4.1. Turkey
- 4.2. Israel
- 4.3. GCC
- 4.4. North Africa
- 4.5. South Africa
- 4.6. Rest of Middle East & Africa
-
5. Asia Pacific
- 5.1. China
- 5.2. India
- 5.3. Japan
- 5.4. South Korea
- 5.5. ASEAN
- 5.6. Oceania
- 5.7. Rest of Asia Pacific
USA Surface Water Treatment Chemicals Industry Regional Market Share
Geographic Coverage of USA Surface Water Treatment Chemicals Industry
USA Surface Water Treatment Chemicals Industry REPORT HIGHLIGHTS
| Aspects | Details |
|---|---|
| Study Period | 2020-2034 |
| Base Year | 2025 |
| Estimated Year | 2026 |
| Forecast Period | 2026-2034 |
| Historical Period | 2020-2025 |
| Growth Rate | CAGR of 4.2% from 2020-2034 |
| Segmentation |
|
Table of Contents
- 1. Introduction
- 1.1. Research Scope
- 1.2. Market Segmentation
- 1.3. Research Objective
- 1.4. Definitions and Assumptions
- 2. Executive Summary
- 2.1. Market Snapshot
- 3. Market Dynamics
- 3.1. Market Drivers
- 3.2. Market Restrains
- 3.3. Market Trends
- 3.4. Market Opportunities
- 4. Market Factor Analysis
- 4.1. Porters Five Forces
- 4.1.1. Bargaining Power of Suppliers
- 4.1.2. Bargaining Power of Buyers
- 4.1.3. Threat of New Entrants
- 4.1.4. Threat of Substitutes
- 4.1.5. Competitive Rivalry
- 4.2. PESTEL analysis
- 4.3. BCG Analysis
- 4.3.1. Stars (High Growth, High Market Share)
- 4.3.2. Cash Cows (Low Growth, High Market Share)
- 4.3.3. Question Mark (High Growth, Low Market Share)
- 4.3.4. Dogs (Low Growth, Low Market Share)
- 4.4. Ansoff Matrix Analysis
- 4.5. Supply Chain Analysis
- 4.6. Regulatory Landscape
- 4.7. Current Market Potential and Opportunity Assessment (TAM–SAM–SOM Framework)
- 4.8. VDR Analyst Note
- 4.1. Porters Five Forces
- 5. Market Analysis, Insights and Forecast 2021-2033
- 5.1. Market Analysis, Insights and Forecast - by Product Type
- 5.1.1. Biocides and Disinfectants
- 5.1.2. Coagulants and Flocculants
- 5.1.3. Corrosion and Scale Inhibitors
- 5.1.4. Defoamers and Defoaming Agents
- 5.1.5. pH & Adjusters and Softeners
- 5.1.6. Other Product Types
- 5.2. Market Analysis, Insights and Forecast - by End-user Industry
- 5.2.1. Power
- 5.2.2. Oil and Gas
- 5.2.3. Chemical Manufacturing
- 5.2.4. Mining and Mineral Processing
- 5.2.5. Municipal
- 5.2.6. Food and Beverage
- 5.2.7. Pulp and Paper
- 5.2.8. Other End-user Industries
- 5.3. Market Analysis, Insights and Forecast - by Region
- 5.3.1. North America
- 5.3.2. South America
- 5.3.3. Europe
- 5.3.4. Middle East & Africa
- 5.3.5. Asia Pacific
- 5.1. Market Analysis, Insights and Forecast - by Product Type
- 6. Global USA Surface Water Treatment Chemicals Industry Analysis, Insights and Forecast, 2021-2033
- 6.1. Market Analysis, Insights and Forecast - by Product Type
- 6.1.1. Biocides and Disinfectants
- 6.1.2. Coagulants and Flocculants
- 6.1.3. Corrosion and Scale Inhibitors
- 6.1.4. Defoamers and Defoaming Agents
- 6.1.5. pH & Adjusters and Softeners
- 6.1.6. Other Product Types
- 6.2. Market Analysis, Insights and Forecast - by End-user Industry
- 6.2.1. Power
- 6.2.2. Oil and Gas
- 6.2.3. Chemical Manufacturing
- 6.2.4. Mining and Mineral Processing
- 6.2.5. Municipal
- 6.2.6. Food and Beverage
- 6.2.7. Pulp and Paper
- 6.2.8. Other End-user Industries
- 6.1. Market Analysis, Insights and Forecast - by Product Type
- 7. North America USA Surface Water Treatment Chemicals Industry Analysis, Insights and Forecast, 2021-2033
- 7.1. Market Analysis, Insights and Forecast - by Product Type
- 7.1.1. Biocides and Disinfectants
- 7.1.2. Coagulants and Flocculants
- 7.1.3. Corrosion and Scale Inhibitors
- 7.1.4. Defoamers and Defoaming Agents
- 7.1.5. pH & Adjusters and Softeners
- 7.1.6. Other Product Types
- 7.2. Market Analysis, Insights and Forecast - by End-user Industry
- 7.2.1. Power
- 7.2.2. Oil and Gas
- 7.2.3. Chemical Manufacturing
- 7.2.4. Mining and Mineral Processing
- 7.2.5. Municipal
- 7.2.6. Food and Beverage
- 7.2.7. Pulp and Paper
- 7.2.8. Other End-user Industries
- 7.1. Market Analysis, Insights and Forecast - by Product Type
- 8. South America USA Surface Water Treatment Chemicals Industry Analysis, Insights and Forecast, 2021-2033
- 8.1. Market Analysis, Insights and Forecast - by Product Type
- 8.1.1. Biocides and Disinfectants
- 8.1.2. Coagulants and Flocculants
- 8.1.3. Corrosion and Scale Inhibitors
- 8.1.4. Defoamers and Defoaming Agents
- 8.1.5. pH & Adjusters and Softeners
- 8.1.6. Other Product Types
- 8.2. Market Analysis, Insights and Forecast - by End-user Industry
- 8.2.1. Power
- 8.2.2. Oil and Gas
- 8.2.3. Chemical Manufacturing
- 8.2.4. Mining and Mineral Processing
- 8.2.5. Municipal
- 8.2.6. Food and Beverage
- 8.2.7. Pulp and Paper
- 8.2.8. Other End-user Industries
- 8.1. Market Analysis, Insights and Forecast - by Product Type
- 9. Europe USA Surface Water Treatment Chemicals Industry Analysis, Insights and Forecast, 2021-2033
- 9.1. Market Analysis, Insights and Forecast - by Product Type
- 9.1.1. Biocides and Disinfectants
- 9.1.2. Coagulants and Flocculants
- 9.1.3. Corrosion and Scale Inhibitors
- 9.1.4. Defoamers and Defoaming Agents
- 9.1.5. pH & Adjusters and Softeners
- 9.1.6. Other Product Types
- 9.2. Market Analysis, Insights and Forecast - by End-user Industry
- 9.2.1. Power
- 9.2.2. Oil and Gas
- 9.2.3. Chemical Manufacturing
- 9.2.4. Mining and Mineral Processing
- 9.2.5. Municipal
- 9.2.6. Food and Beverage
- 9.2.7. Pulp and Paper
- 9.2.8. Other End-user Industries
- 9.1. Market Analysis, Insights and Forecast - by Product Type
- 10. Middle East & Africa USA Surface Water Treatment Chemicals Industry Analysis, Insights and Forecast, 2021-2033
- 10.1. Market Analysis, Insights and Forecast - by Product Type
- 10.1.1. Biocides and Disinfectants
- 10.1.2. Coagulants and Flocculants
- 10.1.3. Corrosion and Scale Inhibitors
- 10.1.4. Defoamers and Defoaming Agents
- 10.1.5. pH & Adjusters and Softeners
- 10.1.6. Other Product Types
- 10.2. Market Analysis, Insights and Forecast - by End-user Industry
- 10.2.1. Power
- 10.2.2. Oil and Gas
- 10.2.3. Chemical Manufacturing
- 10.2.4. Mining and Mineral Processing
- 10.2.5. Municipal
- 10.2.6. Food and Beverage
- 10.2.7. Pulp and Paper
- 10.2.8. Other End-user Industries
- 10.1. Market Analysis, Insights and Forecast - by Product Type
- 11. Asia Pacific USA Surface Water Treatment Chemicals Industry Analysis, Insights and Forecast, 2021-2033
- 11.1. Market Analysis, Insights and Forecast - by Product Type
- 11.1.1. Biocides and Disinfectants
- 11.1.2. Coagulants and Flocculants
- 11.1.3. Corrosion and Scale Inhibitors
- 11.1.4. Defoamers and Defoaming Agents
- 11.1.5. pH & Adjusters and Softeners
- 11.1.6. Other Product Types
- 11.2. Market Analysis, Insights and Forecast - by End-user Industry
- 11.2.1. Power
- 11.2.2. Oil and Gas
- 11.2.3. Chemical Manufacturing
- 11.2.4. Mining and Mineral Processing
- 11.2.5. Municipal
- 11.2.6. Food and Beverage
- 11.2.7. Pulp and Paper
- 11.2.8. Other End-user Industries
- 11.1. Market Analysis, Insights and Forecast - by Product Type
- 12. Competitive Analysis
- 12.1. Company Profiles
- 12.1.1 Ecolab
- 12.1.1.1. Company Overview
- 12.1.1.2. Products
- 12.1.1.3. Company Financials
- 12.1.1.4. SWOT Analysis
- 12.1.2 Nouryon
- 12.1.2.1. Company Overview
- 12.1.2.2. Products
- 12.1.2.3. Company Financials
- 12.1.2.4. SWOT Analysis
- 12.1.3 Solvay
- 12.1.3.1. Company Overview
- 12.1.3.2. Products
- 12.1.3.3. Company Financials
- 12.1.3.4. SWOT Analysis
- 12.1.4 Kurita Water Industries Ltd
- 12.1.4.1. Company Overview
- 12.1.4.2. Products
- 12.1.4.3. Company Financials
- 12.1.4.4. SWOT Analysis
- 12.1.5 USALCO
- 12.1.5.1. Company Overview
- 12.1.5.2. Products
- 12.1.5.3. Company Financials
- 12.1.5.4. SWOT Analysis
- 12.1.6 SUEZ
- 12.1.6.1. Company Overview
- 12.1.6.2. Products
- 12.1.6.3. Company Financials
- 12.1.6.4. SWOT Analysis
- 12.1.7 Kemira
- 12.1.7.1. Company Overview
- 12.1.7.2. Products
- 12.1.7.3. Company Financials
- 12.1.7.4. SWOT Analysis
- 12.1.8 Dow
- 12.1.8.1. Company Overview
- 12.1.8.2. Products
- 12.1.8.3. Company Financials
- 12.1.8.4. SWOT Analysis
- 12.1.9 ChemTreat Inc
- 12.1.9.1. Company Overview
- 12.1.9.2. Products
- 12.1.9.3. Company Financials
- 12.1.9.4. SWOT Analysis
- 12.1.10 Solenis
- 12.1.10.1. Company Overview
- 12.1.10.2. Products
- 12.1.10.3. Company Financials
- 12.1.10.4. SWOT Analysis
- 12.1.11 Buckman Laboratories Inc
- 12.1.11.1. Company Overview
- 12.1.11.2. Products
- 12.1.11.3. Company Financials
- 12.1.11.4. SWOT Analysis
- 12.1.12 Veolia
- 12.1.12.1. Company Overview
- 12.1.12.2. Products
- 12.1.12.3. Company Financials
- 12.1.12.4. SWOT Analysis
- 12.1.13 Albemarle Corporation
- 12.1.13.1. Company Overview
- 12.1.13.2. Products
- 12.1.13.3. Company Financials
- 12.1.13.4. SWOT Analysis
- 12.1.14 Chemtrade
- 12.1.14.1. Company Overview
- 12.1.14.2. Products
- 12.1.14.3. Company Financials
- 12.1.14.4. SWOT Analysis
- 12.1.1 Ecolab
- 12.2. Market Entropy
- 12.2.1 Company's Key Areas Served
- 12.2.2 Recent Developments
- 12.3. Company Market Share Analysis 2025
- 12.3.1 Top 5 Companies Market Share Analysis
- 12.3.2 Top 3 Companies Market Share Analysis
- 12.4. List of Potential Customers
- 13. Research Methodology
List of Figures
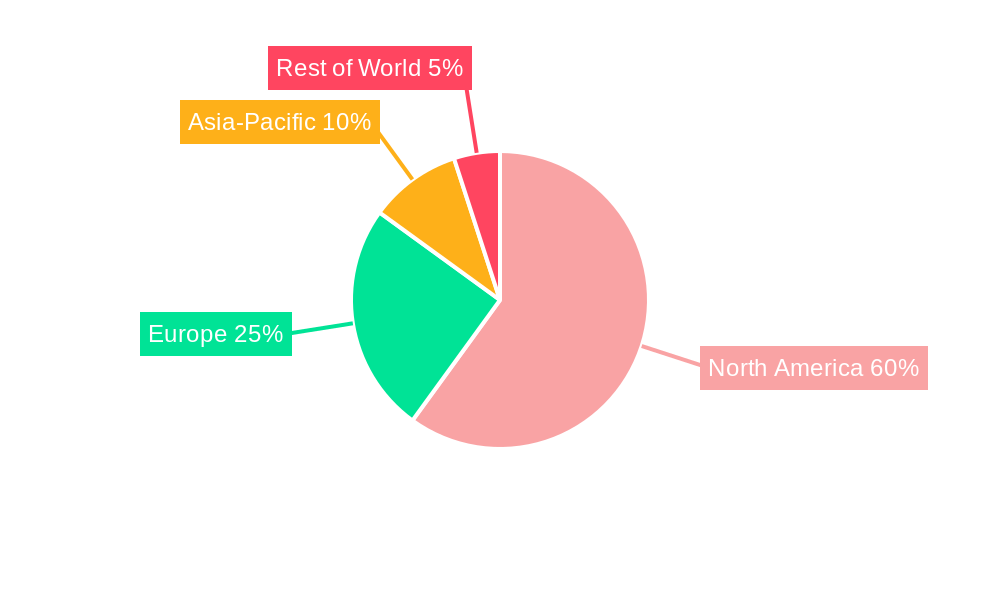
- Figure 1: Global USA Surface Water Treatment Chemicals Industry Revenue Breakdown (billion, %) by Region 2025 & 2033
- Figure 2: Global USA Surface Water Treatment Chemicals Industry Volume Breakdown (K Tons, %) by Region 2025 & 2033
- Figure 3: North America USA Surface Water Treatment Chemicals Industry Revenue (billion), by Product Type 2025 & 2033
- Figure 4: North America USA Surface Water Treatment Chemicals Industry Volume (K Tons), by Product Type 2025 & 2033
- Figure 5: North America USA Surface Water Treatment Chemicals Industry Revenue Share (%), by Product Type 2025 & 2033
- Figure 6: North America USA Surface Water Treatment Chemicals Industry Volume Share (%), by Product Type 2025 & 2033
- Figure 7: North America USA Surface Water Treatment Chemicals Industry Revenue (billion), by End-user Industry 2025 & 2033
- Figure 8: North America USA Surface Water Treatment Chemicals Industry Volume (K Tons), by End-user Industry 2025 & 2033
- Figure 9: North America USA Surface Water Treatment Chemicals Industry Revenue Share (%), by End-user Industry 2025 & 2033
- Figure 10: North America USA Surface Water Treatment Chemicals Industry Volume Share (%), by End-user Industry 2025 & 2033
- Figure 11: North America USA Surface Water Treatment Chemicals Industry Revenue (billion), by Country 2025 & 2033
- Figure 12: North America USA Surface Water Treatment Chemicals Industry Volume (K Tons), by Country 2025 & 2033
- Figure 13: North America USA Surface Water Treatment Chemicals Industry Revenue Share (%), by Country 2025 & 2033
- Figure 14: North America USA Surface Water Treatment Chemicals Industry Volume Share (%), by Country 2025 & 2033
- Figure 15: South America USA Surface Water Treatment Chemicals Industry Revenue (billion), by Product Type 2025 & 2033
- Figure 16: South America USA Surface Water Treatment Chemicals Industry Volume (K Tons), by Product Type 2025 & 2033
- Figure 17: South America USA Surface Water Treatment Chemicals Industry Revenue Share (%), by Product Type 2025 & 2033
- Figure 18: South America USA Surface Water Treatment Chemicals Industry Volume Share (%), by Product Type 2025 & 2033
- Figure 19: South America USA Surface Water Treatment Chemicals Industry Revenue (billion), by End-user Industry 2025 & 2033
- Figure 20: South America USA Surface Water Treatment Chemicals Industry Volume (K Tons), by End-user Industry 2025 & 2033
- Figure 21: South America USA Surface Water Treatment Chemicals Industry Revenue Share (%), by End-user Industry 2025 & 2033
- Figure 22: South America USA Surface Water Treatment Chemicals Industry Volume Share (%), by End-user Industry 2025 & 2033
- Figure 23: South America USA Surface Water Treatment Chemicals Industry Revenue (billion), by Country 2025 & 2033
- Figure 24: South America USA Surface Water Treatment Chemicals Industry Volume (K Tons), by Country 2025 & 2033
- Figure 25: South America USA Surface Water Treatment Chemicals Industry Revenue Share (%), by Country 2025 & 2033
- Figure 26: South America USA Surface Water Treatment Chemicals Industry Volume Share (%), by Country 2025 & 2033
- Figure 27: Europe USA Surface Water Treatment Chemicals Industry Revenue (billion), by Product Type 2025 & 2033
- Figure 28: Europe USA Surface Water Treatment Chemicals Industry Volume (K Tons), by Product Type 2025 & 2033
- Figure 29: Europe USA Surface Water Treatment Chemicals Industry Revenue Share (%), by Product Type 2025 & 2033
- Figure 30: Europe USA Surface Water Treatment Chemicals Industry Volume Share (%), by Product Type 2025 & 2033
- Figure 31: Europe USA Surface Water Treatment Chemicals Industry Revenue (billion), by End-user Industry 2025 & 2033
- Figure 32: Europe USA Surface Water Treatment Chemicals Industry Volume (K Tons), by End-user Industry 2025 & 2033
- Figure 33: Europe USA Surface Water Treatment Chemicals Industry Revenue Share (%), by End-user Industry 2025 & 2033
- Figure 34: Europe USA Surface Water Treatment Chemicals Industry Volume Share (%), by End-user Industry 2025 & 2033
- Figure 35: Europe USA Surface Water Treatment Chemicals Industry Revenue (billion), by Country 2025 & 2033
- Figure 36: Europe USA Surface Water Treatment Chemicals Industry Volume (K Tons), by Country 2025 & 2033
- Figure 37: Europe USA Surface Water Treatment Chemicals Industry Revenue Share (%), by Country 2025 & 2033
- Figure 38: Europe USA Surface Water Treatment Chemicals Industry Volume Share (%), by Country 2025 & 2033
- Figure 39: Middle East & Africa USA Surface Water Treatment Chemicals Industry Revenue (billion), by Product Type 2025 & 2033
- Figure 40: Middle East & Africa USA Surface Water Treatment Chemicals Industry Volume (K Tons), by Product Type 2025 & 2033
- Figure 41: Middle East & Africa USA Surface Water Treatment Chemicals Industry Revenue Share (%), by Product Type 2025 & 2033
- Figure 42: Middle East & Africa USA Surface Water Treatment Chemicals Industry Volume Share (%), by Product Type 2025 & 2033
- Figure 43: Middle East & Africa USA Surface Water Treatment Chemicals Industry Revenue (billion), by End-user Industry 2025 & 2033
- Figure 44: Middle East & Africa USA Surface Water Treatment Chemicals Industry Volume (K Tons), by End-user Industry 2025 & 2033
- Figure 45: Middle East & Africa USA Surface Water Treatment Chemicals Industry Revenue Share (%), by End-user Industry 2025 & 2033
- Figure 46: Middle East & Africa USA Surface Water Treatment Chemicals Industry Volume Share (%), by End-user Industry 2025 & 2033
- Figure 47: Middle East & Africa USA Surface Water Treatment Chemicals Industry Revenue (billion), by Country 2025 & 2033
- Figure 48: Middle East & Africa USA Surface Water Treatment Chemicals Industry Volume (K Tons), by Country 2025 & 2033
- Figure 49: Middle East & Africa USA Surface Water Treatment Chemicals Industry Revenue Share (%), by Country 2025 & 2033
- Figure 50: Middle East & Africa USA Surface Water Treatment Chemicals Industry Volume Share (%), by Country 2025 & 2033
- Figure 51: Asia Pacific USA Surface Water Treatment Chemicals Industry Revenue (billion), by Product Type 2025 & 2033
- Figure 52: Asia Pacific USA Surface Water Treatment Chemicals Industry Volume (K Tons), by Product Type 2025 & 2033
- Figure 53: Asia Pacific USA Surface Water Treatment Chemicals Industry Revenue Share (%), by Product Type 2025 & 2033
- Figure 54: Asia Pacific USA Surface Water Treatment Chemicals Industry Volume Share (%), by Product Type 2025 & 2033
- Figure 55: Asia Pacific USA Surface Water Treatment Chemicals Industry Revenue (billion), by End-user Industry 2025 & 2033
- Figure 56: Asia Pacific USA Surface Water Treatment Chemicals Industry Volume (K Tons), by End-user Industry 2025 & 2033
- Figure 57: Asia Pacific USA Surface Water Treatment Chemicals Industry Revenue Share (%), by End-user Industry 2025 & 2033
- Figure 58: Asia Pacific USA Surface Water Treatment Chemicals Industry Volume Share (%), by End-user Industry 2025 & 2033
- Figure 59: Asia Pacific USA Surface Water Treatment Chemicals Industry Revenue (billion), by Country 2025 & 2033
- Figure 60: Asia Pacific USA Surface Water Treatment Chemicals Industry Volume (K Tons), by Country 2025 & 2033
- Figure 61: Asia Pacific USA Surface Water Treatment Chemicals Industry Revenue Share (%), by Country 2025 & 2033
- Figure 62: Asia Pacific USA Surface Water Treatment Chemicals Industry Volume Share (%), by Country 2025 & 2033
List of Tables
- Table 1: Global USA Surface Water Treatment Chemicals Industry Revenue billion Forecast, by Product Type 2020 & 2033
- Table 2: Global USA Surface Water Treatment Chemicals Industry Volume K Tons Forecast, by Product Type 2020 & 2033
- Table 3: Global USA Surface Water Treatment Chemicals Industry Revenue billion Forecast, by End-user Industry 2020 & 2033
- Table 4: Global USA Surface Water Treatment Chemicals Industry Volume K Tons Forecast, by End-user Industry 2020 & 2033
- Table 5: Global USA Surface Water Treatment Chemicals Industry Revenue billion Forecast, by Region 2020 & 2033
- Table 6: Global USA Surface Water Treatment Chemicals Industry Volume K Tons Forecast, by Region 2020 & 2033
- Table 7: Global USA Surface Water Treatment Chemicals Industry Revenue billion Forecast, by Product Type 2020 & 2033
- Table 8: Global USA Surface Water Treatment Chemicals Industry Volume K Tons Forecast, by Product Type 2020 & 2033
- Table 9: Global USA Surface Water Treatment Chemicals Industry Revenue billion Forecast, by End-user Industry 2020 & 2033
- Table 10: Global USA Surface Water Treatment Chemicals Industry Volume K Tons Forecast, by End-user Industry 2020 & 2033
- Table 11: Global USA Surface Water Treatment Chemicals Industry Revenue billion Forecast, by Country 2020 & 2033
- Table 12: Global USA Surface Water Treatment Chemicals Industry Volume K Tons Forecast, by Country 2020 & 2033
- Table 13: United States USA Surface Water Treatment Chemicals Industry Revenue (billion) Forecast, by Application 2020 & 2033
- Table 14: United States USA Surface Water Treatment Chemicals Industry Volume (K Tons) Forecast, by Application 2020 & 2033
- Table 15: Canada USA Surface Water Treatment Chemicals Industry Revenue (billion) Forecast, by Application 2020 & 2033
- Table 16: Canada USA Surface Water Treatment Chemicals Industry Volume (K Tons) Forecast, by Application 2020 & 2033
- Table 17: Mexico USA Surface Water Treatment Chemicals Industry Revenue (billion) Forecast, by Application 2020 & 2033
- Table 18: Mexico USA Surface Water Treatment Chemicals Industry Volume (K Tons) Forecast, by Application 2020 & 2033
- Table 19: Global USA Surface Water Treatment Chemicals Industry Revenue billion Forecast, by Product Type 2020 & 2033
- Table 20: Global USA Surface Water Treatment Chemicals Industry Volume K Tons Forecast, by Product Type 2020 & 2033
- Table 21: Global USA Surface Water Treatment Chemicals Industry Revenue billion Forecast, by End-user Industry 2020 & 2033
- Table 22: Global USA Surface Water Treatment Chemicals Industry Volume K Tons Forecast, by End-user Industry 2020 & 2033
- Table 23: Global USA Surface Water Treatment Chemicals Industry Revenue billion Forecast, by Country 2020 & 2033
- Table 24: Global USA Surface Water Treatment Chemicals Industry Volume K Tons Forecast, by Country 2020 & 2033
- Table 25: Brazil USA Surface Water Treatment Chemicals Industry Revenue (billion) Forecast, by Application 2020 & 2033
- Table 26: Brazil USA Surface Water Treatment Chemicals Industry Volume (K Tons) Forecast, by Application 2020 & 2033
- Table 27: Argentina USA Surface Water Treatment Chemicals Industry Revenue (billion) Forecast, by Application 2020 & 2033
- Table 28: Argentina USA Surface Water Treatment Chemicals Industry Volume (K Tons) Forecast, by Application 2020 & 2033
- Table 29: Rest of South America USA Surface Water Treatment Chemicals Industry Revenue (billion) Forecast, by Application 2020 & 2033
- Table 30: Rest of South America USA Surface Water Treatment Chemicals Industry Volume (K Tons) Forecast, by Application 2020 & 2033
- Table 31: Global USA Surface Water Treatment Chemicals Industry Revenue billion Forecast, by Product Type 2020 & 2033
- Table 32: Global USA Surface Water Treatment Chemicals Industry Volume K Tons Forecast, by Product Type 2020 & 2033
- Table 33: Global USA Surface Water Treatment Chemicals Industry Revenue billion Forecast, by End-user Industry 2020 & 2033
- Table 34: Global USA Surface Water Treatment Chemicals Industry Volume K Tons Forecast, by End-user Industry 2020 & 2033
- Table 35: Global USA Surface Water Treatment Chemicals Industry Revenue billion Forecast, by Country 2020 & 2033
- Table 36: Global USA Surface Water Treatment Chemicals Industry Volume K Tons Forecast, by Country 2020 & 2033
- Table 37: United Kingdom USA Surface Water Treatment Chemicals Industry Revenue (billion) Forecast, by Application 2020 & 2033
- Table 38: United Kingdom USA Surface Water Treatment Chemicals Industry Volume (K Tons) Forecast, by Application 2020 & 2033
- Table 39: Germany USA Surface Water Treatment Chemicals Industry Revenue (billion) Forecast, by Application 2020 & 2033
- Table 40: Germany USA Surface Water Treatment Chemicals Industry Volume (K Tons) Forecast, by Application 2020 & 2033
- Table 41: France USA Surface Water Treatment Chemicals Industry Revenue (billion) Forecast, by Application 2020 & 2033
- Table 42: France USA Surface Water Treatment Chemicals Industry Volume (K Tons) Forecast, by Application 2020 & 2033
- Table 43: Italy USA Surface Water Treatment Chemicals Industry Revenue (billion) Forecast, by Application 2020 & 2033
- Table 44: Italy USA Surface Water Treatment Chemicals Industry Volume (K Tons) Forecast, by Application 2020 & 2033
- Table 45: Spain USA Surface Water Treatment Chemicals Industry Revenue (billion) Forecast, by Application 2020 & 2033
- Table 46: Spain USA Surface Water Treatment Chemicals Industry Volume (K Tons) Forecast, by Application 2020 & 2033
- Table 47: Russia USA Surface Water Treatment Chemicals Industry Revenue (billion) Forecast, by Application 2020 & 2033
- Table 48: Russia USA Surface Water Treatment Chemicals Industry Volume (K Tons) Forecast, by Application 2020 & 2033
- Table 49: Benelux USA Surface Water Treatment Chemicals Industry Revenue (billion) Forecast, by Application 2020 & 2033
- Table 50: Benelux USA Surface Water Treatment Chemicals Industry Volume (K Tons) Forecast, by Application 2020 & 2033
- Table 51: Nordics USA Surface Water Treatment Chemicals Industry Revenue (billion) Forecast, by Application 2020 & 2033
- Table 52: Nordics USA Surface Water Treatment Chemicals Industry Volume (K Tons) Forecast, by Application 2020 & 2033
- Table 53: Rest of Europe USA Surface Water Treatment Chemicals Industry Revenue (billion) Forecast, by Application 2020 & 2033
- Table 54: Rest of Europe USA Surface Water Treatment Chemicals Industry Volume (K Tons) Forecast, by Application 2020 & 2033
- Table 55: Global USA Surface Water Treatment Chemicals Industry Revenue billion Forecast, by Product Type 2020 & 2033
- Table 56: Global USA Surface Water Treatment Chemicals Industry Volume K Tons Forecast, by Product Type 2020 & 2033
- Table 57: Global USA Surface Water Treatment Chemicals Industry Revenue billion Forecast, by End-user Industry 2020 & 2033
- Table 58: Global USA Surface Water Treatment Chemicals Industry Volume K Tons Forecast, by End-user Industry 2020 & 2033
- Table 59: Global USA Surface Water Treatment Chemicals Industry Revenue billion Forecast, by Country 2020 & 2033
- Table 60: Global USA Surface Water Treatment Chemicals Industry Volume K Tons Forecast, by Country 2020 & 2033
- Table 61: Turkey USA Surface Water Treatment Chemicals Industry Revenue (billion) Forecast, by Application 2020 & 2033
- Table 62: Turkey USA Surface Water Treatment Chemicals Industry Volume (K Tons) Forecast, by Application 2020 & 2033
- Table 63: Israel USA Surface Water Treatment Chemicals Industry Revenue (billion) Forecast, by Application 2020 & 2033
- Table 64: Israel USA Surface Water Treatment Chemicals Industry Volume (K Tons) Forecast, by Application 2020 & 2033
- Table 65: GCC USA Surface Water Treatment Chemicals Industry Revenue (billion) Forecast, by Application 2020 & 2033
- Table 66: GCC USA Surface Water Treatment Chemicals Industry Volume (K Tons) Forecast, by Application 2020 & 2033
- Table 67: North Africa USA Surface Water Treatment Chemicals Industry Revenue (billion) Forecast, by Application 2020 & 2033
- Table 68: North Africa USA Surface Water Treatment Chemicals Industry Volume (K Tons) Forecast, by Application 2020 & 2033
- Table 69: South Africa USA Surface Water Treatment Chemicals Industry Revenue (billion) Forecast, by Application 2020 & 2033
- Table 70: South Africa USA Surface Water Treatment Chemicals Industry Volume (K Tons) Forecast, by Application 2020 & 2033
- Table 71: Rest of Middle East & Africa USA Surface Water Treatment Chemicals Industry Revenue (billion) Forecast, by Application 2020 & 2033
- Table 72: Rest of Middle East & Africa USA Surface Water Treatment Chemicals Industry Volume (K Tons) Forecast, by Application 2020 & 2033
- Table 73: Global USA Surface Water Treatment Chemicals Industry Revenue billion Forecast, by Product Type 2020 & 2033
- Table 74: Global USA Surface Water Treatment Chemicals Industry Volume K Tons Forecast, by Product Type 2020 & 2033
- Table 75: Global USA Surface Water Treatment Chemicals Industry Revenue billion Forecast, by End-user Industry 2020 & 2033
- Table 76: Global USA Surface Water Treatment Chemicals Industry Volume K Tons Forecast, by End-user Industry 2020 & 2033
- Table 77: Global USA Surface Water Treatment Chemicals Industry Revenue billion Forecast, by Country 2020 & 2033
- Table 78: Global USA Surface Water Treatment Chemicals Industry Volume K Tons Forecast, by Country 2020 & 2033
- Table 79: China USA Surface Water Treatment Chemicals Industry Revenue (billion) Forecast, by Application 2020 & 2033
- Table 80: China USA Surface Water Treatment Chemicals Industry Volume (K Tons) Forecast, by Application 2020 & 2033
- Table 81: India USA Surface Water Treatment Chemicals Industry Revenue (billion) Forecast, by Application 2020 & 2033
- Table 82: India USA Surface Water Treatment Chemicals Industry Volume (K Tons) Forecast, by Application 2020 & 2033
- Table 83: Japan USA Surface Water Treatment Chemicals Industry Revenue (billion) Forecast, by Application 2020 & 2033
- Table 84: Japan USA Surface Water Treatment Chemicals Industry Volume (K Tons) Forecast, by Application 2020 & 2033
- Table 85: South Korea USA Surface Water Treatment Chemicals Industry Revenue (billion) Forecast, by Application 2020 & 2033
- Table 86: South Korea USA Surface Water Treatment Chemicals Industry Volume (K Tons) Forecast, by Application 2020 & 2033
- Table 87: ASEAN USA Surface Water Treatment Chemicals Industry Revenue (billion) Forecast, by Application 2020 & 2033
- Table 88: ASEAN USA Surface Water Treatment Chemicals Industry Volume (K Tons) Forecast, by Application 2020 & 2033
- Table 89: Oceania USA Surface Water Treatment Chemicals Industry Revenue (billion) Forecast, by Application 2020 & 2033
- Table 90: Oceania USA Surface Water Treatment Chemicals Industry Volume (K Tons) Forecast, by Application 2020 & 2033
- Table 91: Rest of Asia Pacific USA Surface Water Treatment Chemicals Industry Revenue (billion) Forecast, by Application 2020 & 2033
- Table 92: Rest of Asia Pacific USA Surface Water Treatment Chemicals Industry Volume (K Tons) Forecast, by Application 2020 & 2033
Frequently Asked Questions
1. What is the projected Compound Annual Growth Rate (CAGR) of the USA Surface Water Treatment Chemicals Industry?
The projected CAGR is approximately 4.2%.
2. Which companies are prominent players in the USA Surface Water Treatment Chemicals Industry?
Key companies in the market include Ecolab, Nouryon, Solvay, Kurita Water Industries Ltd, USALCO, SUEZ, Kemira, Dow, ChemTreat Inc, Solenis, Buckman Laboratories Inc, Veolia, Albemarle Corporation, Chemtrade.
3. What are the main segments of the USA Surface Water Treatment Chemicals Industry?
The market segments include Product Type, End-user Industry.
4. Can you provide details about the market size?
The market size is estimated to be USD 35.8 billion as of 2022.
5. What are some drivers contributing to market growth?
; Government Initiatives to Control Production and Disposal of wastewater; Other Drivers.
6. What are the notable trends driving market growth?
Corrosion and Scale Inhibitors to Dominate the market.
7. Are there any restraints impacting market growth?
; Impact of COVID-19 on the Industry; High Cost and Hazardous Nature.
8. Can you provide examples of recent developments in the market?
N/A
9. What pricing options are available for accessing the report?
Pricing options include single-user, multi-user, and enterprise licenses priced at USD 3,950, USD 4,950, and USD 6,950 respectively.
10. Is the market size provided in terms of value or volume?
The market size is provided in terms of value, measured in billion and volume, measured in K Tons.
11. Are there any specific market keywords associated with the report?
Yes, the market keyword associated with the report is "USA Surface Water Treatment Chemicals Industry," which aids in identifying and referencing the specific market segment covered.
12. How do I determine which pricing option suits my needs best?
The pricing options vary based on user requirements and access needs. Individual users may opt for single-user licenses, while businesses requiring broader access may choose multi-user or enterprise licenses for cost-effective access to the report.
13. Are there any additional resources or data provided in the USA Surface Water Treatment Chemicals Industry report?
While the report offers comprehensive insights, it's advisable to review the specific contents or supplementary materials provided to ascertain if additional resources or data are available.
14. How can I stay updated on further developments or reports in the USA Surface Water Treatment Chemicals Industry?
To stay informed about further developments, trends, and reports in the USA Surface Water Treatment Chemicals Industry, consider subscribing to industry newsletters, following relevant companies and organizations, or regularly checking reputable industry news sources and publications.
Methodology
Step 1 - Identification of Relevant Samples Size from Population Database


Step 2 - Approaches for Defining Global Market Size (Value, Volume* & Price*)

Note*: In applicable scenarios
Step 3 - Data Sources
Primary Research
- Web Analytics
- Survey Reports
- Research Institute
- Latest Research Reports
- Opinion Leaders
Secondary Research
- Annual Reports
- White Paper
- Latest Press Release
- Industry Association
- Paid Database
- Investor Presentations

Step 4 - Data Triangulation
Involves using different sources of information in order to increase the validity of a study
These sources are likely to be stakeholders in a program - participants, other researchers, program staff, other community members, and so on.
Then we put all data in single framework & apply various statistical tools to find out the dynamic on the market.
During the analysis stage, feedback from the stakeholder groups would be compared to determine areas of agreement as well as areas of divergence