

Key Insights
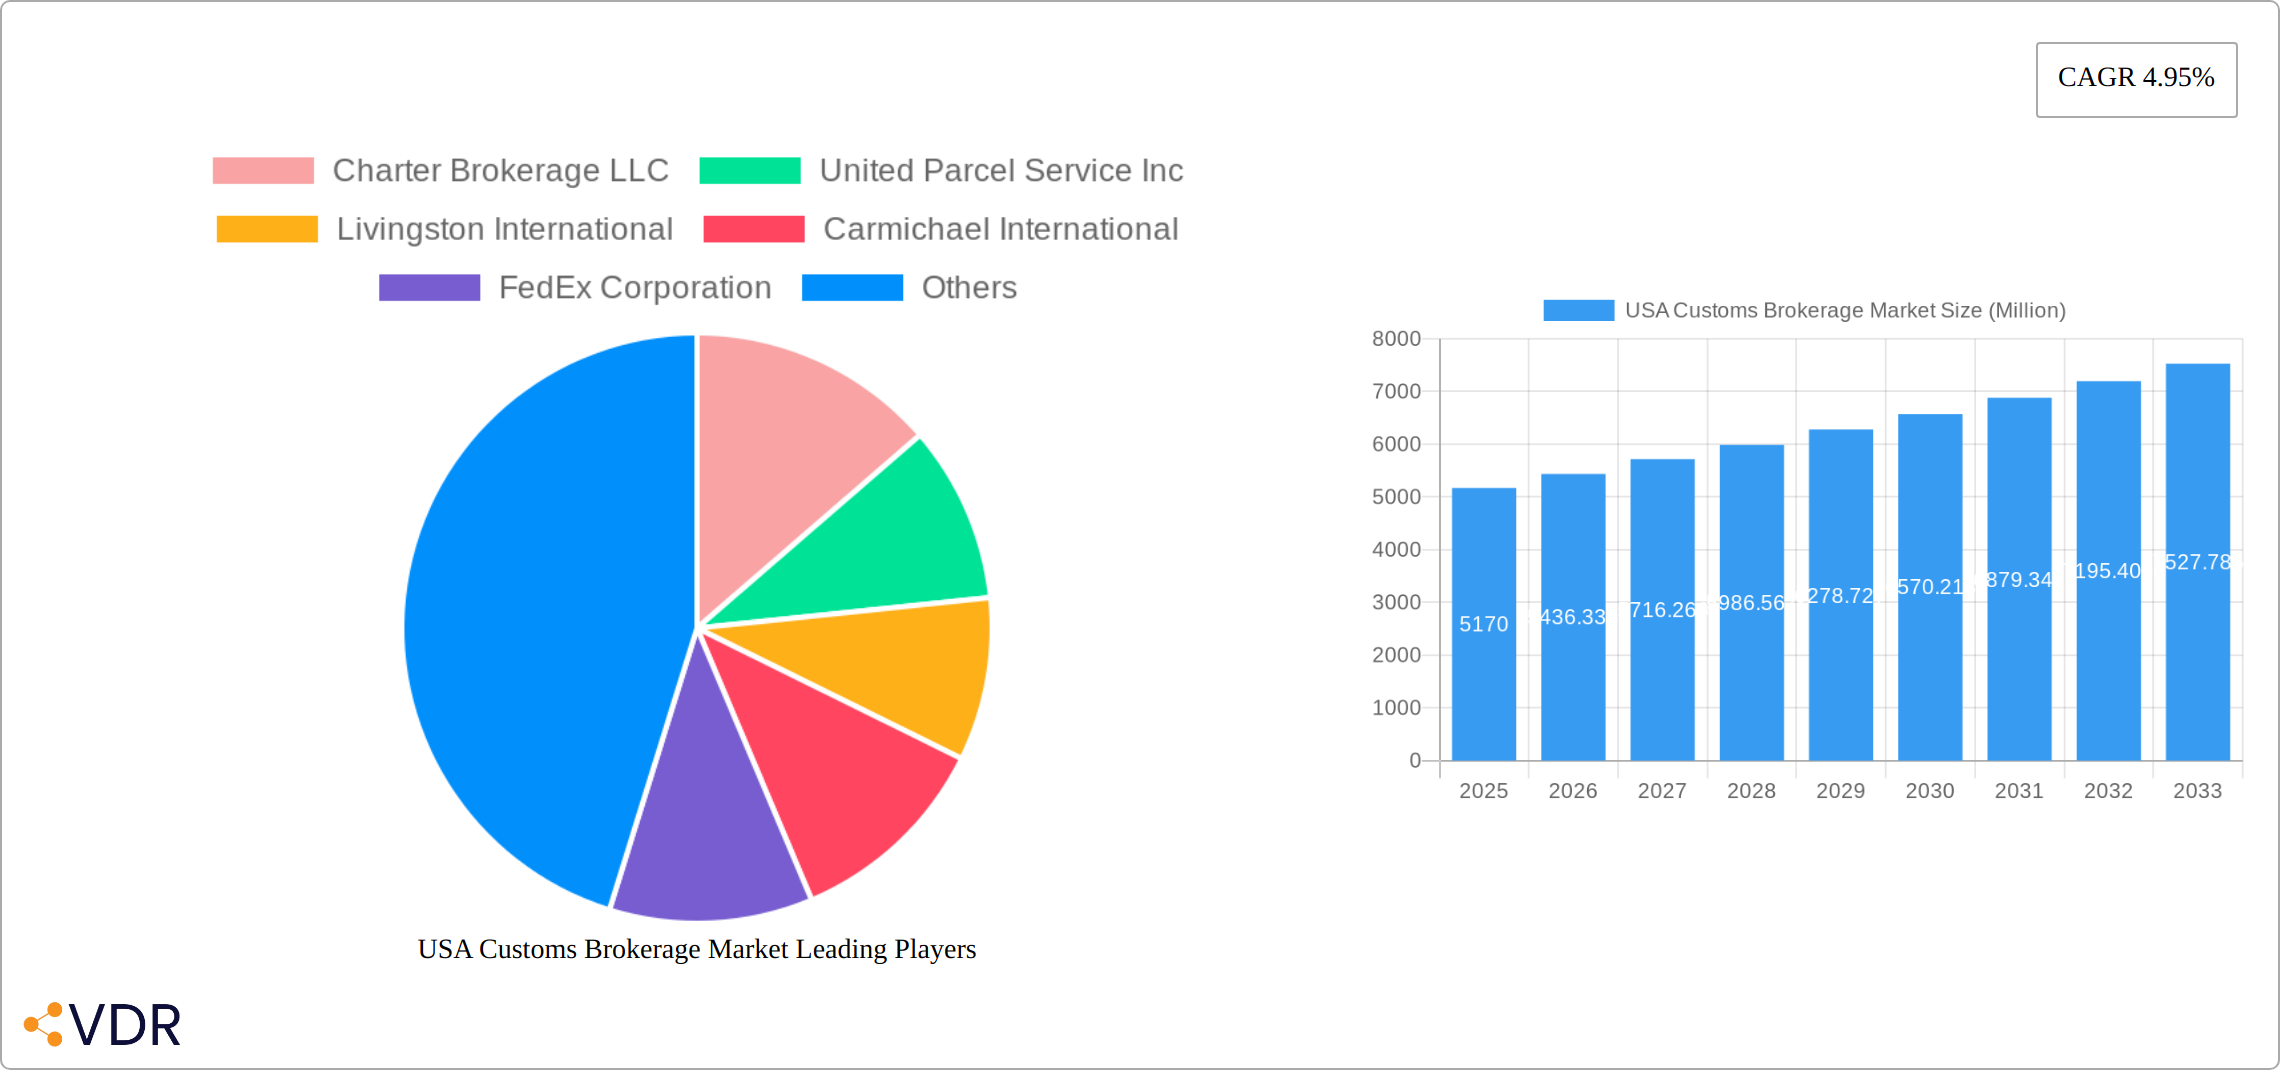
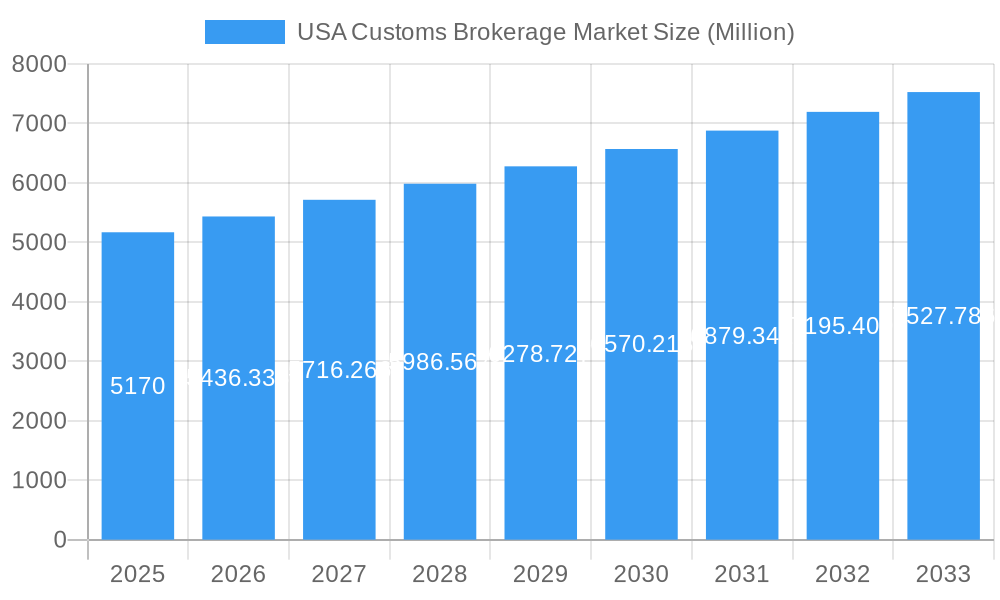
The US Customs Brokerage Market, valued at $5.17 billion in 2025, is projected to experience robust growth, driven by the increasing volume of international trade and the complexity of customs regulations. A Compound Annual Growth Rate (CAGR) of 4.95% is anticipated from 2025 to 2033, indicating a significant expansion of the market. Key drivers include the growth of e-commerce, necessitating efficient customs clearance for cross-border shipments. Furthermore, the rising demand for specialized services like trade compliance consulting and customs valuation expertise fuels market expansion. The market is segmented by mode of transport (sea, air, and cross-border land transport), with sea freight likely dominating due to the high volume of goods transported via this method. Major players like FedEx, DHL, and UPS, along with numerous smaller specialized brokerage firms, contribute to a competitive landscape. Regional variations in market share are expected, with the Northeast and West Coast regions potentially experiencing higher demand due to their major port locations and significant international trade activity. Growth might be slightly restrained by fluctuating global economic conditions and potential changes in trade policies. However, the overall outlook remains positive, fueled by the continued expansion of global trade and the ever-increasing need for efficient and compliant customs brokerage services.
USA Customs Brokerage Market Market Size (In Billion)
The competitive landscape is characterized by a mix of large multinational corporations and smaller, specialized firms. Large players benefit from established global networks and comprehensive service offerings, while smaller firms often focus on niche markets or specific industries. The increasing use of technology, such as automation and digital platforms, is transforming the industry, improving efficiency and transparency. The increasing adoption of data analytics and AI for better risk management and compliance is a key trend shaping this market. Regulatory compliance remains a significant challenge for market participants, demanding constant adaptation to evolving regulations and best practices. The focus on compliance, along with the demand for enhanced security measures and streamlined processes, will continue to drive innovation and investment within the US Customs Brokerage market. This includes the development of more robust technological solutions aimed at optimizing customs clearance and reducing delays.
USA Customs Brokerage Market Company Market Share
This comprehensive report provides a detailed analysis of the USA Customs Brokerage Market, offering invaluable insights for industry professionals, investors, and strategic decision-makers. With a focus on market dynamics, growth trends, key players, and future opportunities, this report is your essential guide to navigating this dynamic sector. The report covers the period 2019-2033, with 2025 as the base and estimated year.
USA Customs Brokerage Market Dynamics & Structure
The USA Customs Brokerage market, valued at $XX million in 2024, is characterized by a moderately consolidated structure with several large players and numerous smaller, specialized firms. Market concentration is influenced by the significant capital investment required for technology and regulatory compliance. Technological innovation, particularly in areas like automation, AI-powered customs clearance software, and blockchain for supply chain transparency, is a key driver. However, high initial investment and integration challenges present innovation barriers for smaller firms. Stringent regulatory frameworks, including CBP compliance requirements, heavily influence market operations. The market faces competition from alternative methods like self-clearance, though this remains limited due to complexity and risk for most businesses. The end-user demographics are broad, encompassing importers and exporters across diverse industries. Recent M&A activity reflects a trend toward consolidation, with larger players acquiring smaller firms to expand their service offerings and geographic reach. For example, the acquisition of smaller firms by Kuehne+Nagel and Rock-It Global in late 2023 signaled this consolidation trend.
- Market Concentration: Moderately Consolidated (HHI: xx)
- M&A Deal Volume (2019-2024): xx deals
- Technological Innovation Drivers: AI, Automation, Blockchain
- Regulatory Framework: Stringent CBP compliance
- Competitive Substitutes: Limited self-clearance options
USA Customs Brokerage Market Growth Trends & Insights
The USA Customs Brokerage market exhibits robust growth, driven by increasing global trade, e-commerce expansion, and the growing complexity of customs regulations. The market size is projected to reach $XX million by 2033, exhibiting a CAGR of xx% during the forecast period (2025-2033). Adoption rates are high among larger companies but remain lower among smaller businesses due to cost and complexity. Technological disruptions, including the rise of digital platforms and AI-powered solutions, are transforming industry operations, improving efficiency, and reducing processing times. Consumer behavior shifts, such as a preference for faster, more transparent customs clearance processes, are driving demand for advanced brokerage services.
Dominant Regions, Countries, or Segments in USA Customs Brokerage Market
The Sea freight segment dominates the USA Customs Brokerage market, accounting for xx% of the total market share in 2024. This dominance is attributed to the high volume of seaborne trade passing through US ports. The Air freight segment holds a significant share (xx%), fueled by the rapid growth of global express delivery and e-commerce. The Cross-border Land Transport segment experiences comparatively slower growth (xx%), mainly due to infrastructure limitations and tighter border controls.
- Sea Freight: High volume of imports & exports, established port infrastructure.
- Air Freight: Rapid growth of e-commerce and express deliveries.
- Cross-border Land Transport: Limited by infrastructure and border controls.
USA Customs Brokerage Market Product Landscape
The US Customs Brokerage market offers a diverse product landscape encompassing traditional brokerage services, specialized solutions tailored to specific industries (e.g., automotive, pharmaceuticals, high-tech, perishables), and cutting-edge technology-driven platforms. These platforms include automated customs clearance systems, sophisticated supply chain visibility tools, and advanced data analytics dashboards. Innovation is rapidly reshaping the industry, focusing on enhancing efficiency, boosting transparency, ensuring regulatory compliance, and providing proactive risk mitigation. Key differentiators for brokerage firms include streamlined and agile processes, deep industry-specific expertise, seamless technology integration, and personalized client support emphasizing proactive communication and problem-solving.
Key Drivers, Barriers & Challenges in USA Customs Brokerage Market
Key Drivers: Increased global trade, e-commerce boom, rising complexity of customs regulations, demand for faster & transparent customs clearance, technological advancements (AI, automation).
Challenges & Restraints: Stringent regulatory compliance, potential supply chain disruptions (e.g., port congestion), competition from self-clearance options (limited impact), and price pressures from increasing competition. The impact of regulatory hurdles contributes to xx% of the overall operational costs for smaller companies.
Emerging Opportunities in USA Customs Brokerage Market
Significant growth opportunities abound within the US Customs Brokerage market. These include catering to specialized needs within niche industries experiencing rapid expansion, leveraging the power of AI and machine learning for predictive analytics and proactive risk management, integrating blockchain technology for unprecedented supply chain transparency and traceability, and expanding into underserved market segments such as e-commerce fulfillment and cross-border B2C logistics. The ever-increasing demand for accelerated, efficient, and compliant customs clearance solutions continues to fuel innovation and growth for forward-thinking companies. Furthermore, the need for navigating increasingly complex trade regulations and tariffs presents a crucial opportunity for specialized expertise and strategic partnerships.
Growth Accelerators in the USA Customs Brokerage Market Industry
Sustained growth within the US Customs Brokerage market is propelled by several key factors. Continuous technological advancements deliver more efficient and cost-effective solutions, reducing processing times and minimizing errors. Strategic alliances between established brokerage firms and innovative technology providers create powerful synergies, enhancing service offerings and market reach. Expansion into new geographical markets and untapped industry verticals presents significant growth potential. Further market consolidation through mergers and acquisitions (M&A) activity is anticipated, leading to the emergence of larger, more integrated players with enhanced capabilities and global reach. Finally, increasing government regulations and the need for compliance will drive demand for specialized expertise.
Key Players Shaping the USA Customs Brokerage Market Market
- Charter Brokerage LLC
- United Parcel Service Inc
- Livingston International
- Carmichael International
- FedEx Corporation
- Deutsche Post DHL group
- Trans American Customhouse Brokers Inc
- GHY International
- Flexport Inc
- Purolator International
- Samuel Shapiro & Company Inc
- Scarbrough International Ltd
- Expeditors International
- A N Deringer
- C H Robinson
- CH Powell Company
- 8 Other Companies (Key Information/Overview)
Notable Milestones in USA Customs Brokerage Market Sector
- November 2023: Kuehne+Nagel acquires Farrow, expanding cross-border capabilities in North America.
- October 2023: Rock-It Global acquires Dell Will, strengthening its position in the motorsports sector.
In-Depth USA Customs Brokerage Market Market Outlook
The future of the USA Customs Brokerage market is bright, driven by technological innovation, increasing global trade, and the evolving needs of businesses. Opportunities for growth exist in specialized services, technological advancements, and strategic partnerships. The market is poised for continued consolidation, with larger players strategically acquiring smaller firms to expand their market share and service capabilities. This creates both opportunities and challenges for players across the market spectrum.
USA Customs Brokerage Market Segmentation
-
1. Mode of Transport
- 1.1. Sea
- 1.2. Air
- 1.3. Cross-border Land Transport
USA Customs Brokerage Market Segmentation By Geography
-
1. North America
- 1.1. United States
- 1.2. Canada
- 1.3. Mexico
-
2. South America
- 2.1. Brazil
- 2.2. Argentina
- 2.3. Rest of South America
-
3. Europe
- 3.1. United Kingdom
- 3.2. Germany
- 3.3. France
- 3.4. Italy
- 3.5. Spain
- 3.6. Russia
- 3.7. Benelux
- 3.8. Nordics
- 3.9. Rest of Europe
-
4. Middle East & Africa
- 4.1. Turkey
- 4.2. Israel
- 4.3. GCC
- 4.4. North Africa
- 4.5. South Africa
- 4.6. Rest of Middle East & Africa
-
5. Asia Pacific
- 5.1. China
- 5.2. India
- 5.3. Japan
- 5.4. South Korea
- 5.5. ASEAN
- 5.6. Oceania
- 5.7. Rest of Asia Pacific
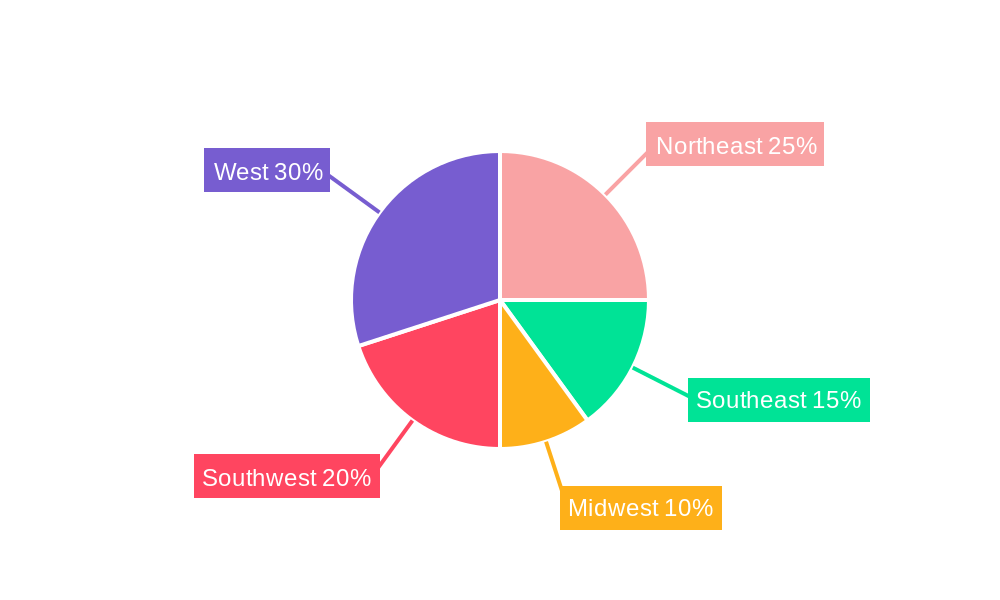
USA Customs Brokerage Market Regional Market Share
Geographic Coverage of USA Customs Brokerage Market
USA Customs Brokerage Market REPORT HIGHLIGHTS
| Aspects | Details |
|---|---|
| Study Period | 2020-2034 |
| Base Year | 2025 |
| Estimated Year | 2026 |
| Forecast Period | 2026-2034 |
| Historical Period | 2020-2025 |
| Growth Rate | CAGR of 4.95% from 2020-2034 |
| Segmentation |
|
Table of Contents
- 1. Introduction
- 1.1. Research Scope
- 1.2. Market Segmentation
- 1.3. Research Objective
- 1.4. Definitions and Assumptions
- 2. Executive Summary
- 2.1. Market Snapshot
- 3. Market Dynamics
- 3.1. Market Drivers
- 3.2. Market Restrains
- 3.3. Market Trends
- 3.4. Market Opportunities
- 4. Market Factor Analysis
- 4.1. Porters Five Forces
- 4.1.1. Bargaining Power of Suppliers
- 4.1.2. Bargaining Power of Buyers
- 4.1.3. Threat of New Entrants
- 4.1.4. Threat of Substitutes
- 4.1.5. Competitive Rivalry
- 4.2. PESTEL analysis
- 4.3. BCG Analysis
- 4.3.1. Stars (High Growth, High Market Share)
- 4.3.2. Cash Cows (Low Growth, High Market Share)
- 4.3.3. Question Mark (High Growth, Low Market Share)
- 4.3.4. Dogs (Low Growth, Low Market Share)
- 4.4. Ansoff Matrix Analysis
- 4.5. Supply Chain Analysis
- 4.6. Regulatory Landscape
- 4.7. Current Market Potential and Opportunity Assessment (TAM–SAM–SOM Framework)
- 4.8. VDR Analyst Note
- 4.1. Porters Five Forces
- 5. Market Analysis, Insights and Forecast 2021-2033
- 5.1. Market Analysis, Insights and Forecast - by Mode of Transport
- 5.1.1. Sea
- 5.1.2. Air
- 5.1.3. Cross-border Land Transport
- 5.2. Market Analysis, Insights and Forecast - by Region
- 5.2.1. North America
- 5.2.2. South America
- 5.2.3. Europe
- 5.2.4. Middle East & Africa
- 5.2.5. Asia Pacific
- 5.1. Market Analysis, Insights and Forecast - by Mode of Transport
- 6. Global USA Customs Brokerage Market Analysis, Insights and Forecast, 2021-2033
- 6.1. Market Analysis, Insights and Forecast - by Mode of Transport
- 6.1.1. Sea
- 6.1.2. Air
- 6.1.3. Cross-border Land Transport
- 6.1. Market Analysis, Insights and Forecast - by Mode of Transport
- 7. North America USA Customs Brokerage Market Analysis, Insights and Forecast, 2021-2033
- 7.1. Market Analysis, Insights and Forecast - by Mode of Transport
- 7.1.1. Sea
- 7.1.2. Air
- 7.1.3. Cross-border Land Transport
- 7.1. Market Analysis, Insights and Forecast - by Mode of Transport
- 8. South America USA Customs Brokerage Market Analysis, Insights and Forecast, 2021-2033
- 8.1. Market Analysis, Insights and Forecast - by Mode of Transport
- 8.1.1. Sea
- 8.1.2. Air
- 8.1.3. Cross-border Land Transport
- 8.1. Market Analysis, Insights and Forecast - by Mode of Transport
- 9. Europe USA Customs Brokerage Market Analysis, Insights and Forecast, 2021-2033
- 9.1. Market Analysis, Insights and Forecast - by Mode of Transport
- 9.1.1. Sea
- 9.1.2. Air
- 9.1.3. Cross-border Land Transport
- 9.1. Market Analysis, Insights and Forecast - by Mode of Transport
- 10. Middle East & Africa USA Customs Brokerage Market Analysis, Insights and Forecast, 2021-2033
- 10.1. Market Analysis, Insights and Forecast - by Mode of Transport
- 10.1.1. Sea
- 10.1.2. Air
- 10.1.3. Cross-border Land Transport
- 10.1. Market Analysis, Insights and Forecast - by Mode of Transport
- 11. Asia Pacific USA Customs Brokerage Market Analysis, Insights and Forecast, 2021-2033
- 11.1. Market Analysis, Insights and Forecast - by Mode of Transport
- 11.1.1. Sea
- 11.1.2. Air
- 11.1.3. Cross-border Land Transport
- 11.1. Market Analysis, Insights and Forecast - by Mode of Transport
- 12. Competitive Analysis
- 12.1. Company Profiles
- 12.1.1 Charter Brokerage LLC
- 12.1.1.1. Company Overview
- 12.1.1.2. Products
- 12.1.1.3. Company Financials
- 12.1.1.4. SWOT Analysis
- 12.1.2 United Parcel Service Inc
- 12.1.2.1. Company Overview
- 12.1.2.2. Products
- 12.1.2.3. Company Financials
- 12.1.2.4. SWOT Analysis
- 12.1.3 Livingston International
- 12.1.3.1. Company Overview
- 12.1.3.2. Products
- 12.1.3.3. Company Financials
- 12.1.3.4. SWOT Analysis
- 12.1.4 Carmichael International
- 12.1.4.1. Company Overview
- 12.1.4.2. Products
- 12.1.4.3. Company Financials
- 12.1.4.4. SWOT Analysis
- 12.1.5 FedEx Corporation
- 12.1.5.1. Company Overview
- 12.1.5.2. Products
- 12.1.5.3. Company Financials
- 12.1.5.4. SWOT Analysis
- 12.1.6 Deutsche Post DHL group
- 12.1.6.1. Company Overview
- 12.1.6.2. Products
- 12.1.6.3. Company Financials
- 12.1.6.4. SWOT Analysis
- 12.1.7 Trans American Customhouse Brokers Inc GHY International Flexport Inc Purolator International Samuel Shapiro & Company Inc Scarbrough International Ltd
- 12.1.7.1. Company Overview
- 12.1.7.2. Products
- 12.1.7.3. Company Financials
- 12.1.7.4. SWOT Analysis
- 12.1.8 Expeditors International
- 12.1.8.1. Company Overview
- 12.1.8.2. Products
- 12.1.8.3. Company Financials
- 12.1.8.4. SWOT Analysis
- 12.1.9 A N Deringer
- 12.1.9.1. Company Overview
- 12.1.9.2. Products
- 12.1.9.3. Company Financials
- 12.1.9.4. SWOT Analysis
- 12.1.10 C H Robinson
- 12.1.10.1. Company Overview
- 12.1.10.2. Products
- 12.1.10.3. Company Financials
- 12.1.10.4. SWOT Analysis
- 12.1.11 CH Powell Company**List Not Exhaustive 8 3 Other Companies (Key Information/Overview)
- 12.1.11.1. Company Overview
- 12.1.11.2. Products
- 12.1.11.3. Company Financials
- 12.1.11.4. SWOT Analysis
- 12.1.1 Charter Brokerage LLC
- 12.2. Market Entropy
- 12.2.1 Company's Key Areas Served
- 12.2.2 Recent Developments
- 12.3. Company Market Share Analysis 2025
- 12.3.1 Top 5 Companies Market Share Analysis
- 12.3.2 Top 3 Companies Market Share Analysis
- 12.4. List of Potential Customers
- 13. Research Methodology
List of Figures
- Figure 1: Global USA Customs Brokerage Market Revenue Breakdown (Million, %) by Region 2025 & 2033
- Figure 2: North America USA Customs Brokerage Market Revenue (Million), by Mode of Transport 2025 & 2033
- Figure 3: North America USA Customs Brokerage Market Revenue Share (%), by Mode of Transport 2025 & 2033
- Figure 4: North America USA Customs Brokerage Market Revenue (Million), by Country 2025 & 2033
- Figure 5: North America USA Customs Brokerage Market Revenue Share (%), by Country 2025 & 2033
- Figure 6: South America USA Customs Brokerage Market Revenue (Million), by Mode of Transport 2025 & 2033
- Figure 7: South America USA Customs Brokerage Market Revenue Share (%), by Mode of Transport 2025 & 2033
- Figure 8: South America USA Customs Brokerage Market Revenue (Million), by Country 2025 & 2033
- Figure 9: South America USA Customs Brokerage Market Revenue Share (%), by Country 2025 & 2033
- Figure 10: Europe USA Customs Brokerage Market Revenue (Million), by Mode of Transport 2025 & 2033
- Figure 11: Europe USA Customs Brokerage Market Revenue Share (%), by Mode of Transport 2025 & 2033
- Figure 12: Europe USA Customs Brokerage Market Revenue (Million), by Country 2025 & 2033
- Figure 13: Europe USA Customs Brokerage Market Revenue Share (%), by Country 2025 & 2033
- Figure 14: Middle East & Africa USA Customs Brokerage Market Revenue (Million), by Mode of Transport 2025 & 2033
- Figure 15: Middle East & Africa USA Customs Brokerage Market Revenue Share (%), by Mode of Transport 2025 & 2033
- Figure 16: Middle East & Africa USA Customs Brokerage Market Revenue (Million), by Country 2025 & 2033
- Figure 17: Middle East & Africa USA Customs Brokerage Market Revenue Share (%), by Country 2025 & 2033
- Figure 18: Asia Pacific USA Customs Brokerage Market Revenue (Million), by Mode of Transport 2025 & 2033
- Figure 19: Asia Pacific USA Customs Brokerage Market Revenue Share (%), by Mode of Transport 2025 & 2033
- Figure 20: Asia Pacific USA Customs Brokerage Market Revenue (Million), by Country 2025 & 2033
- Figure 21: Asia Pacific USA Customs Brokerage Market Revenue Share (%), by Country 2025 & 2033
List of Tables
- Table 1: Global USA Customs Brokerage Market Revenue Million Forecast, by Mode of Transport 2020 & 2033
- Table 2: Global USA Customs Brokerage Market Revenue Million Forecast, by Region 2020 & 2033
- Table 3: Global USA Customs Brokerage Market Revenue Million Forecast, by Mode of Transport 2020 & 2033
- Table 4: Global USA Customs Brokerage Market Revenue Million Forecast, by Country 2020 & 2033
- Table 5: United States USA Customs Brokerage Market Revenue (Million) Forecast, by Application 2020 & 2033
- Table 6: Canada USA Customs Brokerage Market Revenue (Million) Forecast, by Application 2020 & 2033
- Table 7: Mexico USA Customs Brokerage Market Revenue (Million) Forecast, by Application 2020 & 2033
- Table 8: Global USA Customs Brokerage Market Revenue Million Forecast, by Mode of Transport 2020 & 2033
- Table 9: Global USA Customs Brokerage Market Revenue Million Forecast, by Country 2020 & 2033
- Table 10: Brazil USA Customs Brokerage Market Revenue (Million) Forecast, by Application 2020 & 2033
- Table 11: Argentina USA Customs Brokerage Market Revenue (Million) Forecast, by Application 2020 & 2033
- Table 12: Rest of South America USA Customs Brokerage Market Revenue (Million) Forecast, by Application 2020 & 2033
- Table 13: Global USA Customs Brokerage Market Revenue Million Forecast, by Mode of Transport 2020 & 2033
- Table 14: Global USA Customs Brokerage Market Revenue Million Forecast, by Country 2020 & 2033
- Table 15: United Kingdom USA Customs Brokerage Market Revenue (Million) Forecast, by Application 2020 & 2033
- Table 16: Germany USA Customs Brokerage Market Revenue (Million) Forecast, by Application 2020 & 2033
- Table 17: France USA Customs Brokerage Market Revenue (Million) Forecast, by Application 2020 & 2033
- Table 18: Italy USA Customs Brokerage Market Revenue (Million) Forecast, by Application 2020 & 2033
- Table 19: Spain USA Customs Brokerage Market Revenue (Million) Forecast, by Application 2020 & 2033
- Table 20: Russia USA Customs Brokerage Market Revenue (Million) Forecast, by Application 2020 & 2033
- Table 21: Benelux USA Customs Brokerage Market Revenue (Million) Forecast, by Application 2020 & 2033
- Table 22: Nordics USA Customs Brokerage Market Revenue (Million) Forecast, by Application 2020 & 2033
- Table 23: Rest of Europe USA Customs Brokerage Market Revenue (Million) Forecast, by Application 2020 & 2033
- Table 24: Global USA Customs Brokerage Market Revenue Million Forecast, by Mode of Transport 2020 & 2033
- Table 25: Global USA Customs Brokerage Market Revenue Million Forecast, by Country 2020 & 2033
- Table 26: Turkey USA Customs Brokerage Market Revenue (Million) Forecast, by Application 2020 & 2033
- Table 27: Israel USA Customs Brokerage Market Revenue (Million) Forecast, by Application 2020 & 2033
- Table 28: GCC USA Customs Brokerage Market Revenue (Million) Forecast, by Application 2020 & 2033
- Table 29: North Africa USA Customs Brokerage Market Revenue (Million) Forecast, by Application 2020 & 2033
- Table 30: South Africa USA Customs Brokerage Market Revenue (Million) Forecast, by Application 2020 & 2033
- Table 31: Rest of Middle East & Africa USA Customs Brokerage Market Revenue (Million) Forecast, by Application 2020 & 2033
- Table 32: Global USA Customs Brokerage Market Revenue Million Forecast, by Mode of Transport 2020 & 2033
- Table 33: Global USA Customs Brokerage Market Revenue Million Forecast, by Country 2020 & 2033
- Table 34: China USA Customs Brokerage Market Revenue (Million) Forecast, by Application 2020 & 2033
- Table 35: India USA Customs Brokerage Market Revenue (Million) Forecast, by Application 2020 & 2033
- Table 36: Japan USA Customs Brokerage Market Revenue (Million) Forecast, by Application 2020 & 2033
- Table 37: South Korea USA Customs Brokerage Market Revenue (Million) Forecast, by Application 2020 & 2033
- Table 38: ASEAN USA Customs Brokerage Market Revenue (Million) Forecast, by Application 2020 & 2033
- Table 39: Oceania USA Customs Brokerage Market Revenue (Million) Forecast, by Application 2020 & 2033
- Table 40: Rest of Asia Pacific USA Customs Brokerage Market Revenue (Million) Forecast, by Application 2020 & 2033
Frequently Asked Questions
1. What is the projected Compound Annual Growth Rate (CAGR) of the USA Customs Brokerage Market?
The projected CAGR is approximately 4.95%.
2. Which companies are prominent players in the USA Customs Brokerage Market?
Key companies in the market include Charter Brokerage LLC, United Parcel Service Inc, Livingston International, Carmichael International, FedEx Corporation, Deutsche Post DHL group, Trans American Customhouse Brokers Inc GHY International Flexport Inc Purolator International Samuel Shapiro & Company Inc Scarbrough International Ltd, Expeditors International, A N Deringer, C H Robinson, CH Powell Company**List Not Exhaustive 8 3 Other Companies (Key Information/Overview).
3. What are the main segments of the USA Customs Brokerage Market?
The market segments include Mode of Transport.
4. Can you provide details about the market size?
The market size is estimated to be USD 5.17 Million as of 2022.
5. What are some drivers contributing to market growth?
Increasing international trade; Advancements in technology.
6. What are the notable trends driving market growth?
Growth in Imports Driving the US Customs Brokerage Market.
7. Are there any restraints impacting market growth?
Geopolitical uncertainities; Changing trade policies.
8. Can you provide examples of recent developments in the market?
November 2023: Kuehne+Nagel completed the acquisition of Farrow, a Canada-based customs broker. This strategic move enhances cross-border capabilities at the US borders with Canada and Mexico.
9. What pricing options are available for accessing the report?
Pricing options include single-user, multi-user, and enterprise licenses priced at USD 3800, USD 4500, and USD 5800 respectively.
10. Is the market size provided in terms of value or volume?
The market size is provided in terms of value, measured in Million.
11. Are there any specific market keywords associated with the report?
Yes, the market keyword associated with the report is "USA Customs Brokerage Market," which aids in identifying and referencing the specific market segment covered.
12. How do I determine which pricing option suits my needs best?
The pricing options vary based on user requirements and access needs. Individual users may opt for single-user licenses, while businesses requiring broader access may choose multi-user or enterprise licenses for cost-effective access to the report.
13. Are there any additional resources or data provided in the USA Customs Brokerage Market report?
While the report offers comprehensive insights, it's advisable to review the specific contents or supplementary materials provided to ascertain if additional resources or data are available.
14. How can I stay updated on further developments or reports in the USA Customs Brokerage Market?
To stay informed about further developments, trends, and reports in the USA Customs Brokerage Market, consider subscribing to industry newsletters, following relevant companies and organizations, or regularly checking reputable industry news sources and publications.
Methodology
Step 1 - Identification of Relevant Samples Size from Population Database


Step 2 - Approaches for Defining Global Market Size (Value, Volume* & Price*)

Note*: In applicable scenarios
Step 3 - Data Sources
Primary Research
- Web Analytics
- Survey Reports
- Research Institute
- Latest Research Reports
- Opinion Leaders
Secondary Research
- Annual Reports
- White Paper
- Latest Press Release
- Industry Association
- Paid Database
- Investor Presentations

Step 4 - Data Triangulation
Involves using different sources of information in order to increase the validity of a study
These sources are likely to be stakeholders in a program - participants, other researchers, program staff, other community members, and so on.
Then we put all data in single framework & apply various statistical tools to find out the dynamic on the market.
During the analysis stage, feedback from the stakeholder groups would be compared to determine areas of agreement as well as areas of divergence