

Key Insights
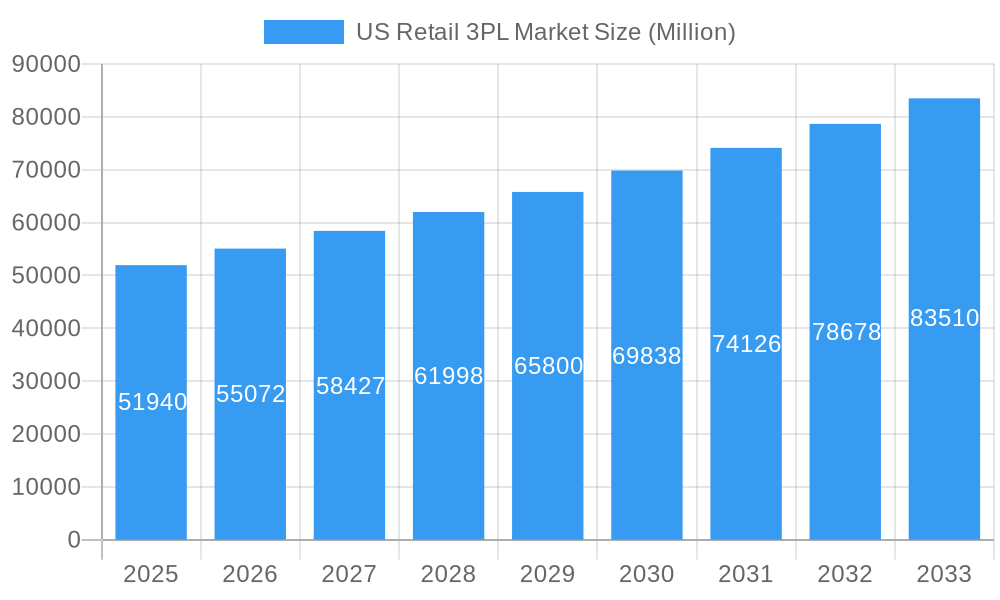
The US retail 3PL (Third-Party Logistics) market, valued at $51.94 billion in 2025, is experiencing robust growth, projected to expand at a Compound Annual Growth Rate (CAGR) of 6.00% from 2025 to 2033. This expansion is driven by several key factors. The rise of e-commerce continues to fuel demand for efficient and reliable logistics solutions, particularly for last-mile delivery and fulfillment. Retailers are increasingly outsourcing their logistics operations to 3PL providers to focus on core competencies and improve supply chain agility. Furthermore, advancements in technology, such as warehouse automation and sophisticated route optimization software, are enhancing efficiency and reducing costs, further stimulating market growth. Growth is also being observed across various product segments including food and beverages, personal care items, apparel, and electronics, reflecting the broad applicability of 3PL services across the retail landscape. Regional variations exist, with growth likely strongest in regions experiencing high e-commerce penetration and population density.
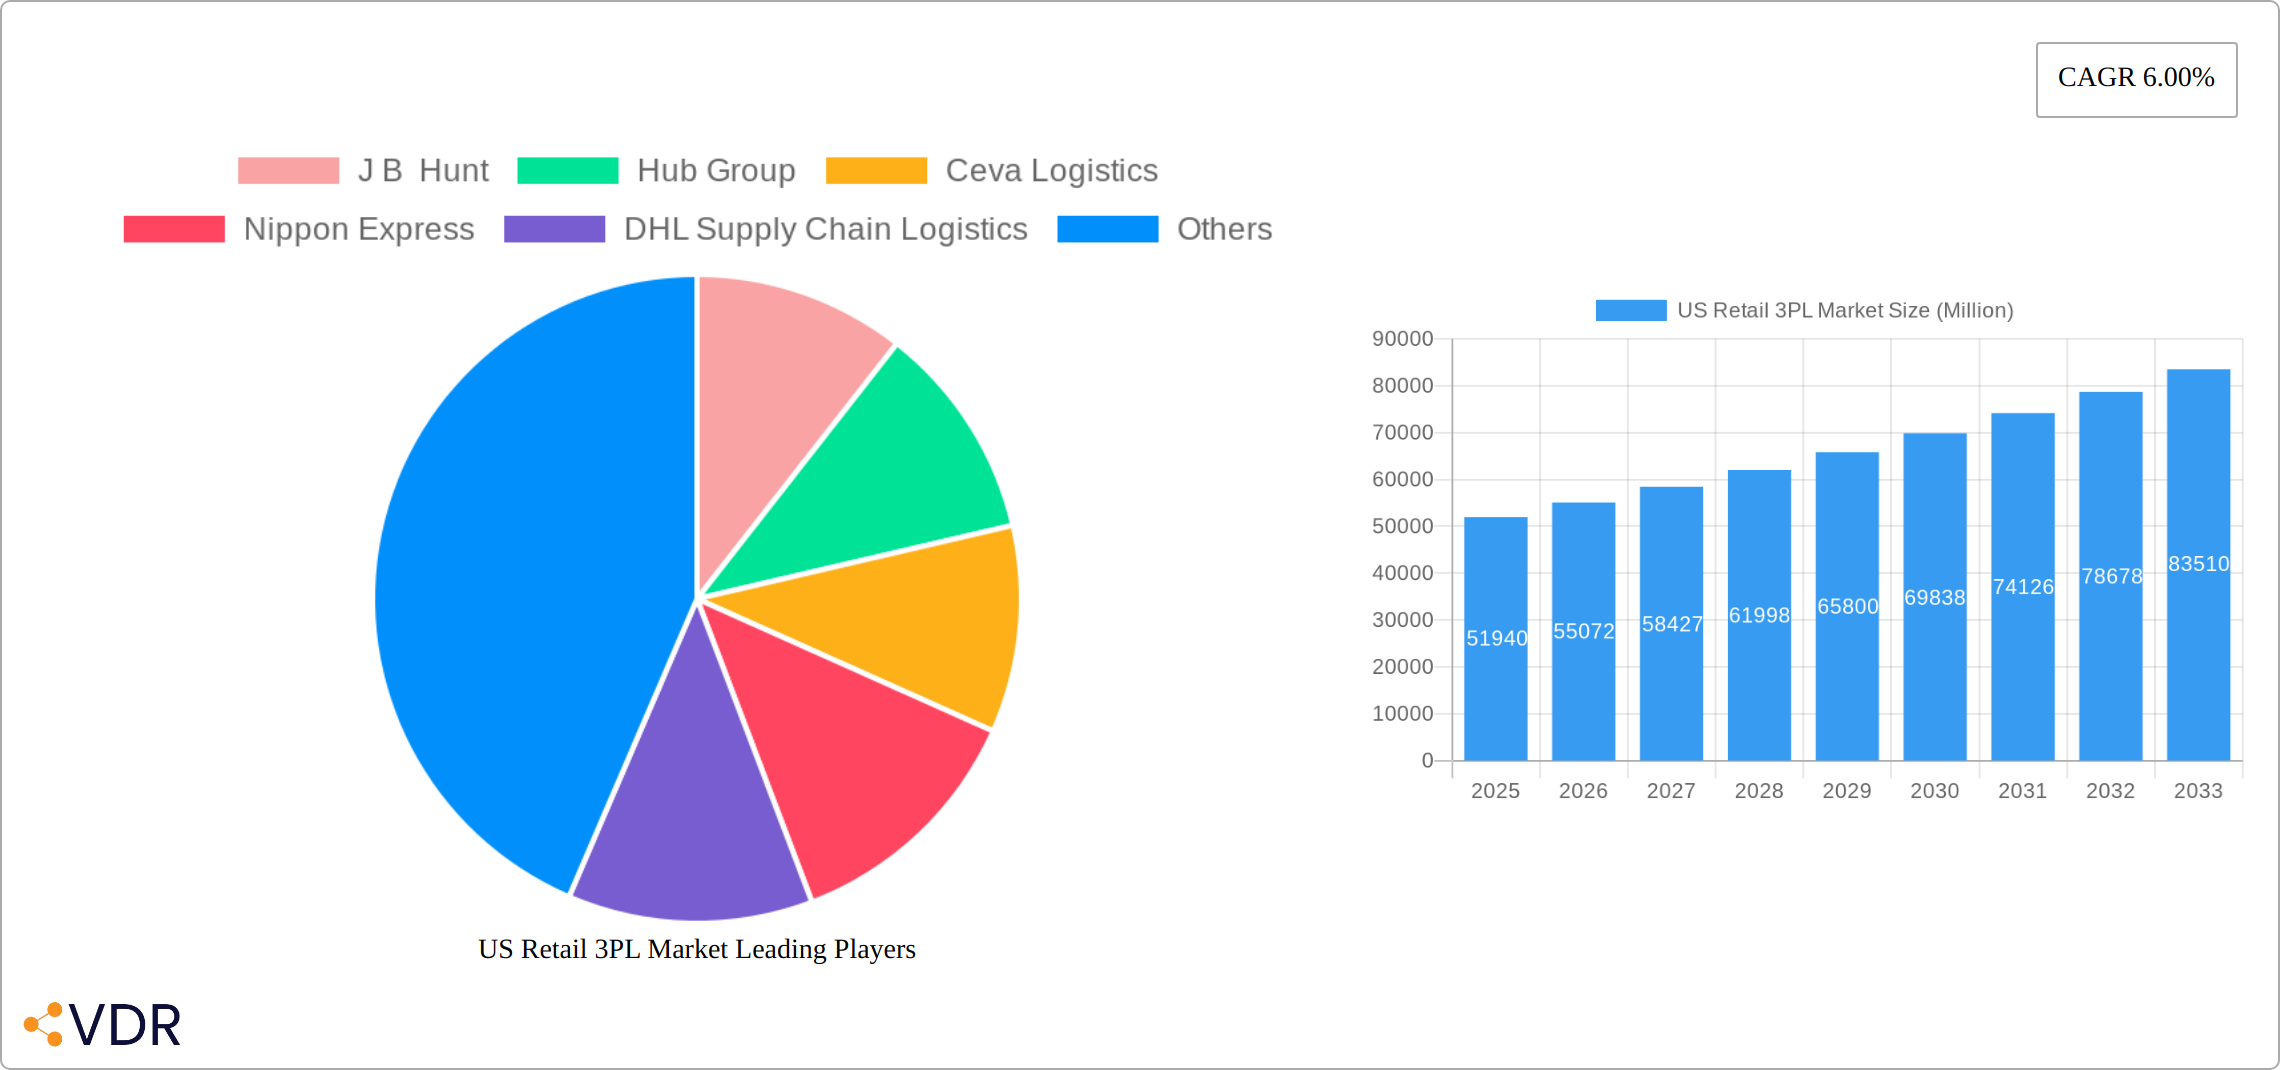
US Retail 3PL Market Market Size (In Billion)
Despite the positive outlook, the market faces some challenges. Rising fuel costs and labor shortages pose significant operational hurdles for 3PL providers, potentially impacting profitability and service delivery. Increased competition, especially from large, established players, also necessitates continuous innovation and strategic differentiation to maintain market share. Nonetheless, the overall market trajectory is positive, indicating strong prospects for growth and investment in the coming years. The diverse range of services offered by major players like J.B. Hunt, Hub Group, DHL Supply Chain, and UPS Supply Chain Solutions underscores the market's maturity and dynamism. The continued expansion of e-commerce and the increasing need for supply chain resilience will likely drive continued growth throughout the forecast period.
US Retail 3PL Market Company Market Share
US Retail 3PL Market: A Comprehensive Report (2019-2033)
This in-depth report provides a comprehensive analysis of the US Retail 3PL (Third-Party Logistics) market, offering crucial insights for industry professionals, investors, and strategists. The report covers the period 2019-2033, with a focus on the 2025-2033 forecast period and utilizes 2025 as the base year. The market is segmented by distribution channel (supermarkets/hypermarkets, convenience stores, department stores, specialty stores, online, and other channels) and product type (food and beverages, personal and household care, apparel, footwear & accessories, furniture, toys & hobby, electronic and household appliances, and other products). The report's value is expressed in millions of USD.
US Retail 3PL Market Dynamics & Structure
The US Retail 3PL market is characterized by a dynamic interplay of factors influencing its structure and growth. Market concentration is moderate, with several large players holding significant shares, alongside numerous smaller niche providers. Technological innovation, particularly in areas like automation, AI-powered logistics, and blockchain for supply chain transparency, is a key driver. The regulatory framework, including transportation regulations and data privacy laws, significantly impacts operations. Competitive substitutes include in-house logistics operations for larger retailers. End-user demographics, particularly the rise of e-commerce and changing consumer expectations, are reshaping the market landscape. The market has witnessed significant M&A activity in recent years.
- Market Concentration: Moderate, with top 5 players holding approximately xx% market share in 2025.
- Technological Innovation: Rapid adoption of automation, AI, and blockchain is transforming efficiency and visibility.
- Regulatory Framework: Stringent regulations concerning transportation, safety, and data privacy.
- M&A Activity: Significant deal volume observed in recent years, with xx deals recorded between 2019 and 2024. (e.g., Knight-Swift's acquisition of U.S. Xpress).
- Innovation Barriers: High initial investment costs for advanced technologies, integration challenges, and skills gap.
US Retail 3PL Market Growth Trends & Insights
The US Retail 3PL market demonstrated robust growth from 2019-2024, fueled by the e-commerce boom and retailers' increasing reliance on outsourced logistics solutions. Valued at an estimated xx million in 2025, the market is projected to expand at a CAGR of xx% through 2033. This sustained growth trajectory is driven by several key factors: the ongoing adoption of technologies that streamline operations and reduce costs, the escalating consumer demand for faster and more reliable deliveries, and the increasing penetration of 3PL services, expected to reach xx% by 2033. Emerging technological disruptions, such as autonomous vehicles and drone delivery, present both significant opportunities and challenges for established players. Further fueling market expansion are evolving consumer preferences, including the embrace of omnichannel retail and subscription models, which necessitate flexible and scalable 3PL solutions. The market is also experiencing increased competition and consolidation, leading to strategic mergers and acquisitions that are reshaping the landscape.
Dominant Regions, Countries, or Segments in US Retail 3PL Market
Within the US Retail 3PL market, the online segment (by distribution channel) exhibits the most robust growth, mirroring the explosive expansion of e-commerce. Similarly, within the "by product" category, the Food and Beverages segment displays significant growth potential, largely driven by the rising need for efficient cold chain logistics.
- Key Drivers (Online Segment): The meteoric rise of e-commerce, the strong consumer preference for home delivery, and substantial investments in optimizing last-mile delivery solutions.
- Key Drivers (Food and Beverages Segment): Stringent food safety regulations, the booming online grocery delivery market, and the critical need for reliable temperature-controlled transportation and storage facilities.
- Dominance Factors: High market share, substantial growth potential, and a favorable regulatory environment conducive to expansion and innovation.
US Retail 3PL Market Product Landscape
The US Retail 3PL market encompasses a wide array of services, including warehousing, transportation management, order fulfillment, and value-added services such as customized packaging and labeling. Recent innovations are focused on enhancing supply chain visibility through real-time tracking and data analytics platforms; improving efficiency through the integration of automation and robotics; and building supply chain resilience through the diversification of logistics networks. Successful 3PL providers are differentiating themselves through customized solutions tailored to individual retailer needs, advanced technology integration, and a commitment to exceptional customer support. The increasing demand for sustainable and environmentally friendly practices is also shaping the service offerings.
Key Drivers, Barriers & Challenges in US Retail 3PL Market
Key Drivers:
- Rising e-commerce penetration.
- Growing demand for faster and more reliable deliveries.
- Technological advancements enhancing efficiency and cost savings.
- Increasing outsourcing of logistics functions by retailers.
Key Challenges:
- Supply chain disruptions (e.g., labor shortages, port congestion). These resulted in a xx% increase in transportation costs in 2022.
- Rising fuel costs and inflation impacting operational profitability.
- Intense competition and pressure to reduce prices.
- Regulatory compliance requirements.
Emerging Opportunities in US Retail 3PL Market
- Significant growth potential in omnichannel fulfillment, requiring flexible and integrated solutions.
- Expansion into currently underserved rural markets, presenting opportunities for innovative last-mile delivery strategies.
- Increasing adoption of sustainable and environmentally friendly logistics practices, driven by consumer and regulatory pressures.
- Development of specialized solutions catering to the unique needs of niche product categories, demanding specialized handling and expertise.
- The integration of Artificial Intelligence and Machine Learning to improve forecasting, optimize routing, and enhance overall efficiency.
Growth Accelerators in the US Retail 3PL Market Industry
Long-term growth in the US Retail 3PL market will be fueled by several factors, including ongoing technological innovation in areas like AI and automation, strategic partnerships between 3PL providers and retailers, and expansion into new markets and service offerings. The increasing focus on supply chain resilience and risk mitigation in the wake of recent global events will also drive demand for robust and adaptable 3PL solutions.
Key Players Shaping the US Retail 3PL Market Market
- J B Hunt
- Hub Group
- Ceva Logistics
- Nippon Express
- DHL Supply Chain Logistics
- XPO Logistics
- C H Robinson
- U S Xpress Enterprises
- DHL Supply Chain
- UPS Supply Chain Solutions
- DSV Panalpina
Notable Milestones in US Retail 3PL Market Sector
- July 2023: Knight-Swift Transportation Holdings Inc.'s acquisition of U.S. Xpress Enterprises marked a significant consolidation event, altering the competitive landscape and influencing market share dynamics.
- March 2023: DSV's acquisition of S&M Moving Systems West and Global Diversity Logistics expanded its North American footprint and enhanced its cross-border logistics capabilities.
- [Add other relevant milestones with dates and brief descriptions]
In-Depth US Retail 3PL Market Market Outlook
The future of the US Retail 3PL market appears bright, with continued growth driven by technological advancements, strategic partnerships, and evolving consumer expectations. The increasing complexity of supply chains and the growing demand for flexible, scalable, and sustainable logistics solutions present significant opportunities for 3PL providers to expand their service offerings and capture market share. Strategic investments in technology, talent, and infrastructure will be key to success in this dynamic market.
US Retail 3PL Market Segmentation
-
1. Product
- 1.1. Food and Beverages
- 1.2. Personal and Household Care
- 1.3. Apparel, Footwear, and Accessories
- 1.4. Furniture, Toys, and Hobby
- 1.5. Electronic and Household Appliances
- 1.6. Other Products
-
2. Distribution Channel
- 2.1. Supermar
- 2.2. Specialty Stores
- 2.3. Online
- 2.4. Other Distribution Channels
US Retail 3PL Market Segmentation By Geography
-
1. North America
- 1.1. United States
- 1.2. Canada
- 1.3. Mexico
-
2. South America
- 2.1. Brazil
- 2.2. Argentina
- 2.3. Rest of South America
-
3. Europe
- 3.1. United Kingdom
- 3.2. Germany
- 3.3. France
- 3.4. Italy
- 3.5. Spain
- 3.6. Russia
- 3.7. Benelux
- 3.8. Nordics
- 3.9. Rest of Europe
-
4. Middle East & Africa
- 4.1. Turkey
- 4.2. Israel
- 4.3. GCC
- 4.4. North Africa
- 4.5. South Africa
- 4.6. Rest of Middle East & Africa
-
5. Asia Pacific
- 5.1. China
- 5.2. India
- 5.3. Japan
- 5.4. South Korea
- 5.5. ASEAN
- 5.6. Oceania
- 5.7. Rest of Asia Pacific
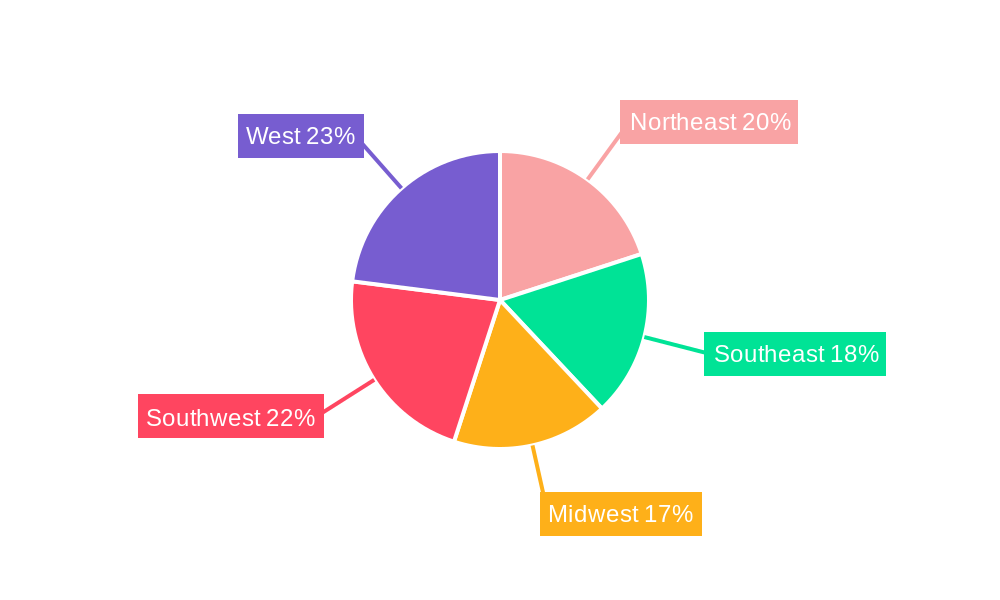
US Retail 3PL Market Regional Market Share
Geographic Coverage of US Retail 3PL Market
US Retail 3PL Market REPORT HIGHLIGHTS
| Aspects | Details |
|---|---|
| Study Period | 2020-2034 |
| Base Year | 2025 |
| Estimated Year | 2026 |
| Forecast Period | 2026-2034 |
| Historical Period | 2020-2025 |
| Growth Rate | CAGR of 6.00% from 2020-2034 |
| Segmentation |
|
Table of Contents
- 1. Introduction
- 1.1. Research Scope
- 1.2. Market Segmentation
- 1.3. Research Objective
- 1.4. Definitions and Assumptions
- 2. Executive Summary
- 2.1. Market Snapshot
- 3. Market Dynamics
- 3.1. Market Drivers
- 3.2. Market Restrains
- 3.3. Market Trends
- 3.4. Market Opportunities
- 4. Market Factor Analysis
- 4.1. Porters Five Forces
- 4.1.1. Bargaining Power of Suppliers
- 4.1.2. Bargaining Power of Buyers
- 4.1.3. Threat of New Entrants
- 4.1.4. Threat of Substitutes
- 4.1.5. Competitive Rivalry
- 4.2. PESTEL analysis
- 4.3. BCG Analysis
- 4.3.1. Stars (High Growth, High Market Share)
- 4.3.2. Cash Cows (Low Growth, High Market Share)
- 4.3.3. Question Mark (High Growth, Low Market Share)
- 4.3.4. Dogs (Low Growth, Low Market Share)
- 4.4. Ansoff Matrix Analysis
- 4.5. Supply Chain Analysis
- 4.6. Regulatory Landscape
- 4.7. Current Market Potential and Opportunity Assessment (TAM–SAM–SOM Framework)
- 4.8. VDR Analyst Note
- 4.1. Porters Five Forces
- 5. Market Analysis, Insights and Forecast 2021-2033
- 5.1. Market Analysis, Insights and Forecast - by Product
- 5.1.1. Food and Beverages
- 5.1.2. Personal and Household Care
- 5.1.3. Apparel, Footwear, and Accessories
- 5.1.4. Furniture, Toys, and Hobby
- 5.1.5. Electronic and Household Appliances
- 5.1.6. Other Products
- 5.2. Market Analysis, Insights and Forecast - by Distribution Channel
- 5.2.1. Supermar
- 5.2.2. Specialty Stores
- 5.2.3. Online
- 5.2.4. Other Distribution Channels
- 5.3. Market Analysis, Insights and Forecast - by Region
- 5.3.1. North America
- 5.3.2. South America
- 5.3.3. Europe
- 5.3.4. Middle East & Africa
- 5.3.5. Asia Pacific
- 5.1. Market Analysis, Insights and Forecast - by Product
- 6. Global US Retail 3PL Market Analysis, Insights and Forecast, 2021-2033
- 6.1. Market Analysis, Insights and Forecast - by Product
- 6.1.1. Food and Beverages
- 6.1.2. Personal and Household Care
- 6.1.3. Apparel, Footwear, and Accessories
- 6.1.4. Furniture, Toys, and Hobby
- 6.1.5. Electronic and Household Appliances
- 6.1.6. Other Products
- 6.2. Market Analysis, Insights and Forecast - by Distribution Channel
- 6.2.1. Supermar
- 6.2.2. Specialty Stores
- 6.2.3. Online
- 6.2.4. Other Distribution Channels
- 6.1. Market Analysis, Insights and Forecast - by Product
- 7. North America US Retail 3PL Market Analysis, Insights and Forecast, 2021-2033
- 7.1. Market Analysis, Insights and Forecast - by Product
- 7.1.1. Food and Beverages
- 7.1.2. Personal and Household Care
- 7.1.3. Apparel, Footwear, and Accessories
- 7.1.4. Furniture, Toys, and Hobby
- 7.1.5. Electronic and Household Appliances
- 7.1.6. Other Products
- 7.2. Market Analysis, Insights and Forecast - by Distribution Channel
- 7.2.1. Supermar
- 7.2.2. Specialty Stores
- 7.2.3. Online
- 7.2.4. Other Distribution Channels
- 7.1. Market Analysis, Insights and Forecast - by Product
- 8. South America US Retail 3PL Market Analysis, Insights and Forecast, 2021-2033
- 8.1. Market Analysis, Insights and Forecast - by Product
- 8.1.1. Food and Beverages
- 8.1.2. Personal and Household Care
- 8.1.3. Apparel, Footwear, and Accessories
- 8.1.4. Furniture, Toys, and Hobby
- 8.1.5. Electronic and Household Appliances
- 8.1.6. Other Products
- 8.2. Market Analysis, Insights and Forecast - by Distribution Channel
- 8.2.1. Supermar
- 8.2.2. Specialty Stores
- 8.2.3. Online
- 8.2.4. Other Distribution Channels
- 8.1. Market Analysis, Insights and Forecast - by Product
- 9. Europe US Retail 3PL Market Analysis, Insights and Forecast, 2021-2033
- 9.1. Market Analysis, Insights and Forecast - by Product
- 9.1.1. Food and Beverages
- 9.1.2. Personal and Household Care
- 9.1.3. Apparel, Footwear, and Accessories
- 9.1.4. Furniture, Toys, and Hobby
- 9.1.5. Electronic and Household Appliances
- 9.1.6. Other Products
- 9.2. Market Analysis, Insights and Forecast - by Distribution Channel
- 9.2.1. Supermar
- 9.2.2. Specialty Stores
- 9.2.3. Online
- 9.2.4. Other Distribution Channels
- 9.1. Market Analysis, Insights and Forecast - by Product
- 10. Middle East & Africa US Retail 3PL Market Analysis, Insights and Forecast, 2021-2033
- 10.1. Market Analysis, Insights and Forecast - by Product
- 10.1.1. Food and Beverages
- 10.1.2. Personal and Household Care
- 10.1.3. Apparel, Footwear, and Accessories
- 10.1.4. Furniture, Toys, and Hobby
- 10.1.5. Electronic and Household Appliances
- 10.1.6. Other Products
- 10.2. Market Analysis, Insights and Forecast - by Distribution Channel
- 10.2.1. Supermar
- 10.2.2. Specialty Stores
- 10.2.3. Online
- 10.2.4. Other Distribution Channels
- 10.1. Market Analysis, Insights and Forecast - by Product
- 11. Asia Pacific US Retail 3PL Market Analysis, Insights and Forecast, 2021-2033
- 11.1. Market Analysis, Insights and Forecast - by Product
- 11.1.1. Food and Beverages
- 11.1.2. Personal and Household Care
- 11.1.3. Apparel, Footwear, and Accessories
- 11.1.4. Furniture, Toys, and Hobby
- 11.1.5. Electronic and Household Appliances
- 11.1.6. Other Products
- 11.2. Market Analysis, Insights and Forecast - by Distribution Channel
- 11.2.1. Supermar
- 11.2.2. Specialty Stores
- 11.2.3. Online
- 11.2.4. Other Distribution Channels
- 11.1. Market Analysis, Insights and Forecast - by Product
- 12. Competitive Analysis
- 12.1. Company Profiles
- 12.1.1 J B Hunt
- 12.1.1.1. Company Overview
- 12.1.1.2. Products
- 12.1.1.3. Company Financials
- 12.1.1.4. SWOT Analysis
- 12.1.2 Hub Group
- 12.1.2.1. Company Overview
- 12.1.2.2. Products
- 12.1.2.3. Company Financials
- 12.1.2.4. SWOT Analysis
- 12.1.3 Ceva Logistics
- 12.1.3.1. Company Overview
- 12.1.3.2. Products
- 12.1.3.3. Company Financials
- 12.1.3.4. SWOT Analysis
- 12.1.4 Nippon Express
- 12.1.4.1. Company Overview
- 12.1.4.2. Products
- 12.1.4.3. Company Financials
- 12.1.4.4. SWOT Analysis
- 12.1.5 DHL Supply Chain Logistics
- 12.1.5.1. Company Overview
- 12.1.5.2. Products
- 12.1.5.3. Company Financials
- 12.1.5.4. SWOT Analysis
- 12.1.6 XPO Logistics
- 12.1.6.1. Company Overview
- 12.1.6.2. Products
- 12.1.6.3. Company Financials
- 12.1.6.4. SWOT Analysis
- 12.1.7 C H Robinson
- 12.1.7.1. Company Overview
- 12.1.7.2. Products
- 12.1.7.3. Company Financials
- 12.1.7.4. SWOT Analysis
- 12.1.8 U S Xpress Enterprises
- 12.1.8.1. Company Overview
- 12.1.8.2. Products
- 12.1.8.3. Company Financials
- 12.1.8.4. SWOT Analysis
- 12.1.9 DHL Supply Chain
- 12.1.9.1. Company Overview
- 12.1.9.2. Products
- 12.1.9.3. Company Financials
- 12.1.9.4. SWOT Analysis
- 12.1.10 UPS Supply Chain Solutions**List Not Exhaustive
- 12.1.10.1. Company Overview
- 12.1.10.2. Products
- 12.1.10.3. Company Financials
- 12.1.10.4. SWOT Analysis
- 12.1.11 DSV Panalpina
- 12.1.11.1. Company Overview
- 12.1.11.2. Products
- 12.1.11.3. Company Financials
- 12.1.11.4. SWOT Analysis
- 12.1.1 J B Hunt
- 12.2. Market Entropy
- 12.2.1 Company's Key Areas Served
- 12.2.2 Recent Developments
- 12.3. Company Market Share Analysis 2025
- 12.3.1 Top 5 Companies Market Share Analysis
- 12.3.2 Top 3 Companies Market Share Analysis
- 12.4. List of Potential Customers
- 13. Research Methodology
List of Figures
- Figure 1: Global US Retail 3PL Market Revenue Breakdown (Million, %) by Region 2025 & 2033
- Figure 2: North America US Retail 3PL Market Revenue (Million), by Product 2025 & 2033
- Figure 3: North America US Retail 3PL Market Revenue Share (%), by Product 2025 & 2033
- Figure 4: North America US Retail 3PL Market Revenue (Million), by Distribution Channel 2025 & 2033
- Figure 5: North America US Retail 3PL Market Revenue Share (%), by Distribution Channel 2025 & 2033
- Figure 6: North America US Retail 3PL Market Revenue (Million), by Country 2025 & 2033
- Figure 7: North America US Retail 3PL Market Revenue Share (%), by Country 2025 & 2033
- Figure 8: South America US Retail 3PL Market Revenue (Million), by Product 2025 & 2033
- Figure 9: South America US Retail 3PL Market Revenue Share (%), by Product 2025 & 2033
- Figure 10: South America US Retail 3PL Market Revenue (Million), by Distribution Channel 2025 & 2033
- Figure 11: South America US Retail 3PL Market Revenue Share (%), by Distribution Channel 2025 & 2033
- Figure 12: South America US Retail 3PL Market Revenue (Million), by Country 2025 & 2033
- Figure 13: South America US Retail 3PL Market Revenue Share (%), by Country 2025 & 2033
- Figure 14: Europe US Retail 3PL Market Revenue (Million), by Product 2025 & 2033
- Figure 15: Europe US Retail 3PL Market Revenue Share (%), by Product 2025 & 2033
- Figure 16: Europe US Retail 3PL Market Revenue (Million), by Distribution Channel 2025 & 2033
- Figure 17: Europe US Retail 3PL Market Revenue Share (%), by Distribution Channel 2025 & 2033
- Figure 18: Europe US Retail 3PL Market Revenue (Million), by Country 2025 & 2033
- Figure 19: Europe US Retail 3PL Market Revenue Share (%), by Country 2025 & 2033
- Figure 20: Middle East & Africa US Retail 3PL Market Revenue (Million), by Product 2025 & 2033
- Figure 21: Middle East & Africa US Retail 3PL Market Revenue Share (%), by Product 2025 & 2033
- Figure 22: Middle East & Africa US Retail 3PL Market Revenue (Million), by Distribution Channel 2025 & 2033
- Figure 23: Middle East & Africa US Retail 3PL Market Revenue Share (%), by Distribution Channel 2025 & 2033
- Figure 24: Middle East & Africa US Retail 3PL Market Revenue (Million), by Country 2025 & 2033
- Figure 25: Middle East & Africa US Retail 3PL Market Revenue Share (%), by Country 2025 & 2033
- Figure 26: Asia Pacific US Retail 3PL Market Revenue (Million), by Product 2025 & 2033
- Figure 27: Asia Pacific US Retail 3PL Market Revenue Share (%), by Product 2025 & 2033
- Figure 28: Asia Pacific US Retail 3PL Market Revenue (Million), by Distribution Channel 2025 & 2033
- Figure 29: Asia Pacific US Retail 3PL Market Revenue Share (%), by Distribution Channel 2025 & 2033
- Figure 30: Asia Pacific US Retail 3PL Market Revenue (Million), by Country 2025 & 2033
- Figure 31: Asia Pacific US Retail 3PL Market Revenue Share (%), by Country 2025 & 2033
List of Tables
- Table 1: Global US Retail 3PL Market Revenue Million Forecast, by Product 2020 & 2033
- Table 2: Global US Retail 3PL Market Revenue Million Forecast, by Distribution Channel 2020 & 2033
- Table 3: Global US Retail 3PL Market Revenue Million Forecast, by Region 2020 & 2033
- Table 4: Global US Retail 3PL Market Revenue Million Forecast, by Product 2020 & 2033
- Table 5: Global US Retail 3PL Market Revenue Million Forecast, by Distribution Channel 2020 & 2033
- Table 6: Global US Retail 3PL Market Revenue Million Forecast, by Country 2020 & 2033
- Table 7: United States US Retail 3PL Market Revenue (Million) Forecast, by Application 2020 & 2033
- Table 8: Canada US Retail 3PL Market Revenue (Million) Forecast, by Application 2020 & 2033
- Table 9: Mexico US Retail 3PL Market Revenue (Million) Forecast, by Application 2020 & 2033
- Table 10: Global US Retail 3PL Market Revenue Million Forecast, by Product 2020 & 2033
- Table 11: Global US Retail 3PL Market Revenue Million Forecast, by Distribution Channel 2020 & 2033
- Table 12: Global US Retail 3PL Market Revenue Million Forecast, by Country 2020 & 2033
- Table 13: Brazil US Retail 3PL Market Revenue (Million) Forecast, by Application 2020 & 2033
- Table 14: Argentina US Retail 3PL Market Revenue (Million) Forecast, by Application 2020 & 2033
- Table 15: Rest of South America US Retail 3PL Market Revenue (Million) Forecast, by Application 2020 & 2033
- Table 16: Global US Retail 3PL Market Revenue Million Forecast, by Product 2020 & 2033
- Table 17: Global US Retail 3PL Market Revenue Million Forecast, by Distribution Channel 2020 & 2033
- Table 18: Global US Retail 3PL Market Revenue Million Forecast, by Country 2020 & 2033
- Table 19: United Kingdom US Retail 3PL Market Revenue (Million) Forecast, by Application 2020 & 2033
- Table 20: Germany US Retail 3PL Market Revenue (Million) Forecast, by Application 2020 & 2033
- Table 21: France US Retail 3PL Market Revenue (Million) Forecast, by Application 2020 & 2033
- Table 22: Italy US Retail 3PL Market Revenue (Million) Forecast, by Application 2020 & 2033
- Table 23: Spain US Retail 3PL Market Revenue (Million) Forecast, by Application 2020 & 2033
- Table 24: Russia US Retail 3PL Market Revenue (Million) Forecast, by Application 2020 & 2033
- Table 25: Benelux US Retail 3PL Market Revenue (Million) Forecast, by Application 2020 & 2033
- Table 26: Nordics US Retail 3PL Market Revenue (Million) Forecast, by Application 2020 & 2033
- Table 27: Rest of Europe US Retail 3PL Market Revenue (Million) Forecast, by Application 2020 & 2033
- Table 28: Global US Retail 3PL Market Revenue Million Forecast, by Product 2020 & 2033
- Table 29: Global US Retail 3PL Market Revenue Million Forecast, by Distribution Channel 2020 & 2033
- Table 30: Global US Retail 3PL Market Revenue Million Forecast, by Country 2020 & 2033
- Table 31: Turkey US Retail 3PL Market Revenue (Million) Forecast, by Application 2020 & 2033
- Table 32: Israel US Retail 3PL Market Revenue (Million) Forecast, by Application 2020 & 2033
- Table 33: GCC US Retail 3PL Market Revenue (Million) Forecast, by Application 2020 & 2033
- Table 34: North Africa US Retail 3PL Market Revenue (Million) Forecast, by Application 2020 & 2033
- Table 35: South Africa US Retail 3PL Market Revenue (Million) Forecast, by Application 2020 & 2033
- Table 36: Rest of Middle East & Africa US Retail 3PL Market Revenue (Million) Forecast, by Application 2020 & 2033
- Table 37: Global US Retail 3PL Market Revenue Million Forecast, by Product 2020 & 2033
- Table 38: Global US Retail 3PL Market Revenue Million Forecast, by Distribution Channel 2020 & 2033
- Table 39: Global US Retail 3PL Market Revenue Million Forecast, by Country 2020 & 2033
- Table 40: China US Retail 3PL Market Revenue (Million) Forecast, by Application 2020 & 2033
- Table 41: India US Retail 3PL Market Revenue (Million) Forecast, by Application 2020 & 2033
- Table 42: Japan US Retail 3PL Market Revenue (Million) Forecast, by Application 2020 & 2033
- Table 43: South Korea US Retail 3PL Market Revenue (Million) Forecast, by Application 2020 & 2033
- Table 44: ASEAN US Retail 3PL Market Revenue (Million) Forecast, by Application 2020 & 2033
- Table 45: Oceania US Retail 3PL Market Revenue (Million) Forecast, by Application 2020 & 2033
- Table 46: Rest of Asia Pacific US Retail 3PL Market Revenue (Million) Forecast, by Application 2020 & 2033
Frequently Asked Questions
1. What is the projected Compound Annual Growth Rate (CAGR) of the US Retail 3PL Market?
The projected CAGR is approximately 6.00%.
2. Which companies are prominent players in the US Retail 3PL Market?
Key companies in the market include J B Hunt, Hub Group, Ceva Logistics, Nippon Express, DHL Supply Chain Logistics, XPO Logistics, C H Robinson, U S Xpress Enterprises, DHL Supply Chain, UPS Supply Chain Solutions**List Not Exhaustive, DSV Panalpina.
3. What are the main segments of the US Retail 3PL Market?
The market segments include Product, Distribution Channel.
4. Can you provide details about the market size?
The market size is estimated to be USD 51.94 Million as of 2022.
5. What are some drivers contributing to market growth?
4.; Increasing E-commerce Sales.
6. What are the notable trends driving market growth?
Growth In E-commerce Driving the Market.
7. Are there any restraints impacting market growth?
4.; Drivers Availability.
8. Can you provide examples of recent developments in the market?
July 2023: Knight-Swift Transportation Holdings Inc. (a transportation company), acquired the United States’ truck carrier U.S. Xpress. following the approval by U.S. Xpress’ shareholders on June 29, 2023. Upon completion of the transaction, U.S. Xpress was de-listed from the New York Stock Exchange.
9. What pricing options are available for accessing the report?
Pricing options include single-user, multi-user, and enterprise licenses priced at USD 3800, USD 4500, and USD 5800 respectively.
10. Is the market size provided in terms of value or volume?
The market size is provided in terms of value, measured in Million.
11. Are there any specific market keywords associated with the report?
Yes, the market keyword associated with the report is "US Retail 3PL Market," which aids in identifying and referencing the specific market segment covered.
12. How do I determine which pricing option suits my needs best?
The pricing options vary based on user requirements and access needs. Individual users may opt for single-user licenses, while businesses requiring broader access may choose multi-user or enterprise licenses for cost-effective access to the report.
13. Are there any additional resources or data provided in the US Retail 3PL Market report?
While the report offers comprehensive insights, it's advisable to review the specific contents or supplementary materials provided to ascertain if additional resources or data are available.
14. How can I stay updated on further developments or reports in the US Retail 3PL Market?
To stay informed about further developments, trends, and reports in the US Retail 3PL Market, consider subscribing to industry newsletters, following relevant companies and organizations, or regularly checking reputable industry news sources and publications.
Methodology
Step 1 - Identification of Relevant Samples Size from Population Database


Step 2 - Approaches for Defining Global Market Size (Value, Volume* & Price*)

Note*: In applicable scenarios
Step 3 - Data Sources
Primary Research
- Web Analytics
- Survey Reports
- Research Institute
- Latest Research Reports
- Opinion Leaders
Secondary Research
- Annual Reports
- White Paper
- Latest Press Release
- Industry Association
- Paid Database
- Investor Presentations

Step 4 - Data Triangulation
Involves using different sources of information in order to increase the validity of a study
These sources are likely to be stakeholders in a program - participants, other researchers, program staff, other community members, and so on.
Then we put all data in single framework & apply various statistical tools to find out the dynamic on the market.
During the analysis stage, feedback from the stakeholder groups would be compared to determine areas of agreement as well as areas of divergence