

Key Insights
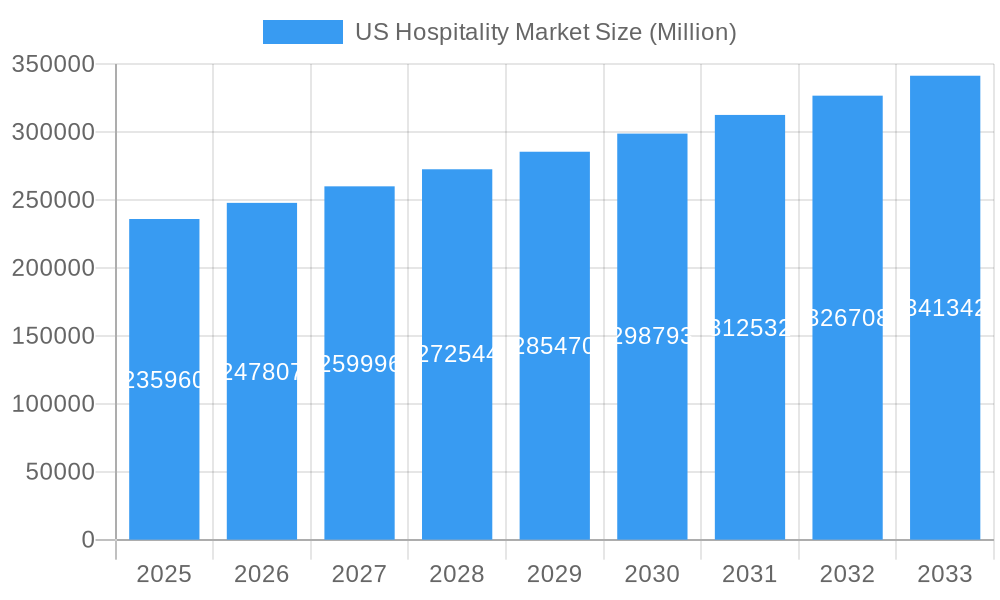
The US hospitality market, valued at $235.96 billion in 2025, is projected to experience robust growth, driven by a rising domestic and international tourism, increasing disposable incomes, and a growing preference for unique travel experiences. The market's Compound Annual Growth Rate (CAGR) of 4.87% from 2025 to 2033 indicates a significant expansion over the forecast period. Key growth drivers include the resurgence of business travel post-pandemic, the rise of experiential tourism, and the increasing popularity of boutique and independent hotels catering to discerning travelers seeking personalized services. The segment encompassing mid-scale and upper-mid-scale hotels is expected to dominate the market share, reflecting the demand for comfortable and reasonably priced accommodations. However, the market faces certain constraints, including fluctuating fuel prices impacting travel costs and potential economic downturns that could curb consumer spending on leisure activities. Competition from alternative accommodation providers like Airbnb also presents a challenge to traditional hotels. The market's segmentation by type (chain vs. independent hotels) and by service level (budget, mid-scale, luxury) allows for a nuanced understanding of the diverse consumer preferences shaping the industry's trajectory. Regional variations within the United States, with potential differences in growth rates across the Northeast, Southeast, Midwest, Southwest, and West, will also influence the overall market performance.
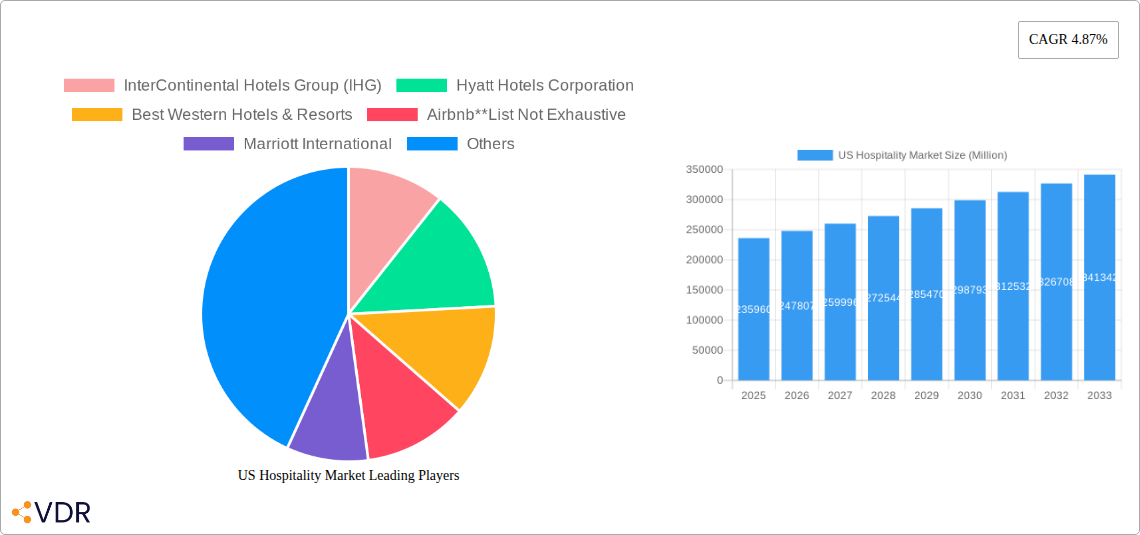
US Hospitality Market Market Size (In Billion)
The competitive landscape is fiercely contested, with major players like Marriott International, Hilton Worldwide, IHG, Hyatt, and Airbnb vying for market share. These companies are constantly innovating to meet evolving consumer expectations, investing in technology, enhancing customer loyalty programs, and focusing on sustainability initiatives to attract environmentally conscious travelers. The success of individual companies will depend on their ability to adapt to shifting travel trends, effectively manage operational costs, and offer compelling value propositions to attract and retain customers. Future growth will be influenced by factors such as infrastructure development, government policies related to tourism, and the broader macroeconomic environment. Understanding these dynamics is crucial for investors and industry stakeholders to make informed decisions and capitalize on opportunities within this dynamic sector.
US Hospitality Market Company Market Share
US Hospitality Market Report: 2019-2033 Forecast
This comprehensive report provides an in-depth analysis of the US Hospitality Market, covering its dynamics, growth trends, dominant segments, and key players. With a study period spanning 2019-2033, a base year of 2025, and a forecast period of 2025-2033, this report offers invaluable insights for industry professionals, investors, and strategic decision-makers. The report analyzes parent markets (Accommodation and Food Services) and child markets (e.g., Budget Hotels, Luxury Hotels, Service Apartments) to provide a holistic view.
US Hospitality Market Market Dynamics & Structure
The US hospitality market is a vibrant and intensely competitive arena, populated by both established industry leaders and innovative newcomers. Market concentration is currently moderate; while a few dominant players command a significant share, a multitude of independent hotels and bespoke boutique establishments contribute substantially to the overall market volume and diversity. The relentless pace of technological advancement is a primary catalyst, with the widespread adoption of online booking platforms, sophisticated revenue management systems, and the growing emphasis on crafting personalized guest experiences fundamentally reshaping industry operations and guest satisfaction.
The operational landscape is significantly influenced by a comprehensive regulatory framework, which includes zoning laws, stringent health and safety standards, and evolving labor regulations, all of which impact operational expenditures and market entry barriers. The competitive environment is further intensified by the proliferation of product substitutes, most notably vacation rental platforms like Airbnb and other alternative accommodation providers, which present a growing challenge to traditional hotel models. The end-user demographic is exceptionally diverse, encompassing business travelers with distinct needs and leisure tourists with varied preferences and spending capacities, necessitating sophisticated segmentation strategies. Furthermore, mergers and acquisitions (M&A) remain a pervasive trend, with larger hotel chains strategically fortifying their market positions through the acquisition of smaller entities and independent properties.
- Market Concentration: Moderate, with the top 10 players holding approximately 45% of the market share in 2024.
- M&A Deal Volume (2019-2024): Over 200 deals, totaling an estimated 25 Billion USD in value, reflecting ongoing consolidation.
- Technological Innovation Drivers: Advanced online booking platforms, dynamic revenue management systems, AI-powered customer service and personalization, contactless guest solutions.
- Regulatory Framework Impact: Increasing compliance costs related to sustainability mandates, evolving labor regulations impacting wage structures and operational efficiency.
- Competitive Substitutes: Airbnb, VRBO, extended-stay apartment rentals, and unique glamping/experiential accommodations.
- End-User Demographics: Business travelers (estimated 150 Million annually), Leisure travelers (estimated 220 Million annually), with a growing segment of "bleisure" travelers.
US Hospitality Market Growth Trends & Insights
The US hospitality market demonstrated robust growth in the preceding period (2019-2024), albeit with a notable disruption caused by the global pandemic. A strong rebound is currently in progress, fueled by substantial pent-up demand for travel and leisure pursuits. The market is forecast to achieve a Compound Annual Growth Rate (CAGR) of approximately 6.5% during the forecast period (2025-2033), with projections indicating a market size of over 350 Billion USD by 2033. Key growth accelerators include the continued surge in online booking platform adoption, technological advancements driving enhanced operational efficiency, and a significant evolution in consumer preferences towards highly personalized and experiential travel. The penetration of online booking platforms has escalated dramatically, rising from around 70% in 2019 to an estimated 90% in 2024, underscoring the industry's increasing reliance on digital distribution channels.
Emerging consumer behavior trends highlight a growing inclination towards sustainable and eco-friendly lodging options, prompting considerable investment in green initiatives by hotels. The rise of "bleisure" travel, the seamless integration of business and leisure trips, also presents a substantial and expanding opportunity for the market to cater to a more flexible and modern traveler.
Dominant Regions, Countries, or Segments in US Hospitality Market
The US hospitality market exhibits distinct regional variations in terms of growth trajectory and market dominance. States such as California, Florida, and New York consistently emerge as leading destinations, largely attributed to their high volumes of both international and domestic tourism, alongside robust business travel activity. Within market segments, the Luxury Hotels segment is anticipated to exhibit the most significant growth potential, propelled by rising disposable incomes and an increasing consumer appetite for premium, high-value experiences. While chain hotels continue to hold a dominant position owing to their established brand recognition, extensive loyalty programs, and economies of scale, independent hotels are also experiencing resurgence by effectively catering to niche markets and delivering unique, personalized guest experiences.
- Leading Regions: California, Florida, New York (collectively contributing an estimated 55% of the total market revenue in 2024).
- Fastest-Growing Segment: Luxury Hotels (projected CAGR of 7.8% during 2025-2033).
- Dominant Hotel Type: Chain Hotels (holding approximately 70% market share in 2024).
- Key Drivers for Growth: Resilient tourism and business travel sectors, sustained growth in disposable incomes, supportive economic policies, and significant infrastructure development in key tourist hubs.
US Hospitality Market Product Landscape
The US hospitality market boasts an exceptionally diverse product and service portfolio, meticulously designed to meet a wide spectrum of traveler preferences and budget considerations. Innovations are heavily concentrated on elevating the guest experience through cutting-edge technological integrations, including seamless mobile check-in/check-out processes, highly personalized in-room entertainment options, and advanced smart room technologies that automate various aspects of the guest's stay. Unique selling propositions are increasingly centered on the adoption of sustainable operational practices, the curation of authentic local experiences, and the integration of enhanced wellness amenities. The pervasive influence of technological advancements is particularly evident in the widespread implementation of sophisticated revenue management systems, crucial for optimizing pricing strategies and maximizing occupancy rates.
Key Drivers, Barriers & Challenges in US Hospitality Market
Key Drivers: Increased tourism, rising disposable incomes, technological advancements (e.g., AI-powered guest services), and the expansion of the bleisure travel segment.
Key Challenges: Labor shortages, rising operating costs (e.g., energy prices), economic downturns impacting travel spending, intense competition, and evolving regulatory landscapes. The impact of labor shortages on operational efficiency is estimated to be a xx% reduction in productivity in 2024, resulting in increased labor costs.
Emerging Opportunities in US Hospitality Market
Emerging opportunities lie in the growing demand for sustainable and eco-friendly accommodations, the expansion of the "experiential travel" segment, and the development of innovative technological solutions to enhance the guest experience (e.g., AI-powered concierge services, personalized recommendations). The untapped potential of rural and less-visited destinations also presents opportunities for growth.
Growth Accelerators in the US Hospitality Market Industry
Technological advancements, strategic partnerships between hotels and technology companies, and expansion into new markets are key growth accelerators. The development of sophisticated revenue management systems, personalized marketing strategies, and a focus on building strong brand loyalty will further fuel growth in the coming years.
Key Players Shaping the US Hospitality Market Market
- InterContinental Hotels Group (IHG)
- Hyatt Hotels Corporation
- Best Western Hotels & Resorts
- Airbnb
- Marriott International
- G6 Hospitality
- Hilton Worldwide
- Choice Hotels International
- Wyndham Hotels & Resorts
- Aimbridge Hospitality
Notable Milestones in US Hospitality Market Sector
- September 2023: IHG Hotels & Resorts strategically expanded its footprint by opening a new Holiday Inn in South Philadelphia, reinforcing its presence in a critical urban market and catering to both business and leisure travelers.
- August 2023: Wyndham Hotels & Resorts further solidified its market position through a significant expansion agreement with LuxUrban Hotels Inc., integrating 16 hotels into its Trademark Collection, a move that substantially broadens its offerings and reach across the US market.
In-Depth US Hospitality Market Market Outlook
The US hospitality market is poised for continued growth, driven by the resurgence of travel, technological innovation, and evolving consumer preferences. Strategic partnerships, expansion into new markets (both domestic and international), and a focus on sustainability will shape the future of the industry. The market's future growth will be largely influenced by macroeconomic factors, including economic growth, inflation, and global events. The market is expected to reach xx Million USD by 2033, representing substantial growth potential for investors and industry players.
US Hospitality Market Segmentation
-
1. Type
- 1.1. Chain Hotels
- 1.2. Independent Hotels
-
2. Segment
- 2.1. Service Apartments
- 2.2. Budget and Economy Hotels
- 2.3. Mid and Upper Mid-Scale Hotels
- 2.4. Luxury Hotels
US Hospitality Market Segmentation By Geography
-
1. North America
- 1.1. United States
- 1.2. Canada
- 1.3. Mexico
-
2. South America
- 2.1. Brazil
- 2.2. Argentina
- 2.3. Rest of South America
-
3. Europe
- 3.1. United Kingdom
- 3.2. Germany
- 3.3. France
- 3.4. Italy
- 3.5. Spain
- 3.6. Russia
- 3.7. Benelux
- 3.8. Nordics
- 3.9. Rest of Europe
-
4. Middle East & Africa
- 4.1. Turkey
- 4.2. Israel
- 4.3. GCC
- 4.4. North Africa
- 4.5. South Africa
- 4.6. Rest of Middle East & Africa
-
5. Asia Pacific
- 5.1. China
- 5.2. India
- 5.3. Japan
- 5.4. South Korea
- 5.5. ASEAN
- 5.6. Oceania
- 5.7. Rest of Asia Pacific
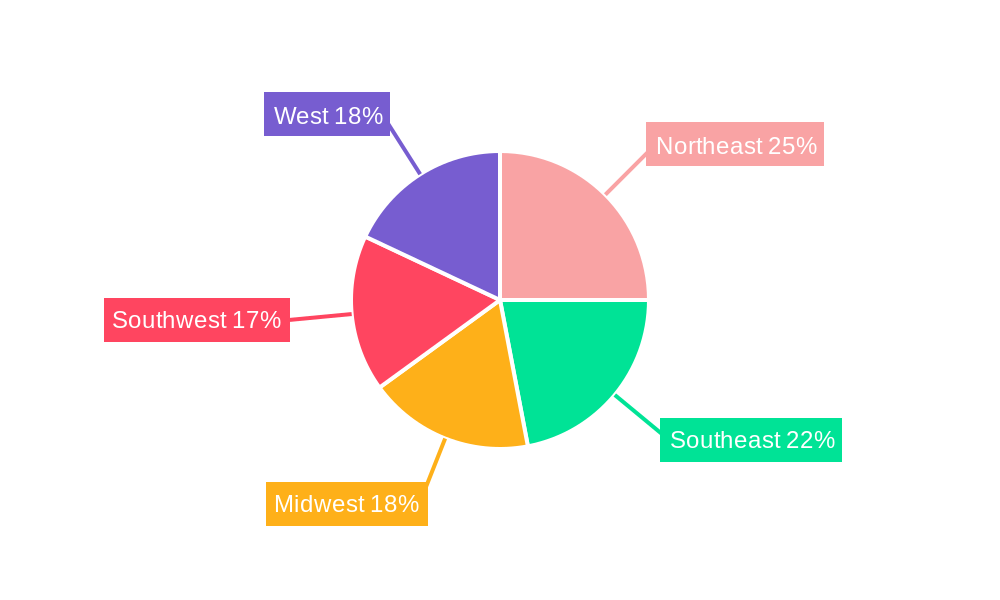
US Hospitality Market Regional Market Share
Geographic Coverage of US Hospitality Market
US Hospitality Market REPORT HIGHLIGHTS
| Aspects | Details |
|---|---|
| Study Period | 2020-2034 |
| Base Year | 2025 |
| Estimated Year | 2026 |
| Forecast Period | 2026-2034 |
| Historical Period | 2020-2025 |
| Growth Rate | CAGR of 4.87% from 2020-2034 |
| Segmentation |
|
Table of Contents
- 1. Introduction
- 1.1. Research Scope
- 1.2. Market Segmentation
- 1.3. Research Objective
- 1.4. Definitions and Assumptions
- 2. Executive Summary
- 2.1. Market Snapshot
- 3. Market Dynamics
- 3.1. Market Drivers
- 3.2. Market Restrains
- 3.3. Market Trends
- 3.4. Market Opportunities
- 4. Market Factor Analysis
- 4.1. Porters Five Forces
- 4.1.1. Bargaining Power of Suppliers
- 4.1.2. Bargaining Power of Buyers
- 4.1.3. Threat of New Entrants
- 4.1.4. Threat of Substitutes
- 4.1.5. Competitive Rivalry
- 4.2. PESTEL analysis
- 4.3. BCG Analysis
- 4.3.1. Stars (High Growth, High Market Share)
- 4.3.2. Cash Cows (Low Growth, High Market Share)
- 4.3.3. Question Mark (High Growth, Low Market Share)
- 4.3.4. Dogs (Low Growth, Low Market Share)
- 4.4. Ansoff Matrix Analysis
- 4.5. Supply Chain Analysis
- 4.6. Regulatory Landscape
- 4.7. Current Market Potential and Opportunity Assessment (TAM–SAM–SOM Framework)
- 4.8. VDR Analyst Note
- 4.1. Porters Five Forces
- 5. Market Analysis, Insights and Forecast 2021-2033
- 5.1. Market Analysis, Insights and Forecast - by Type
- 5.1.1. Chain Hotels
- 5.1.2. Independent Hotels
- 5.2. Market Analysis, Insights and Forecast - by Segment
- 5.2.1. Service Apartments
- 5.2.2. Budget and Economy Hotels
- 5.2.3. Mid and Upper Mid-Scale Hotels
- 5.2.4. Luxury Hotels
- 5.3. Market Analysis, Insights and Forecast - by Region
- 5.3.1. North America
- 5.3.2. South America
- 5.3.3. Europe
- 5.3.4. Middle East & Africa
- 5.3.5. Asia Pacific
- 5.1. Market Analysis, Insights and Forecast - by Type
- 6. Global US Hospitality Market Analysis, Insights and Forecast, 2021-2033
- 6.1. Market Analysis, Insights and Forecast - by Type
- 6.1.1. Chain Hotels
- 6.1.2. Independent Hotels
- 6.2. Market Analysis, Insights and Forecast - by Segment
- 6.2.1. Service Apartments
- 6.2.2. Budget and Economy Hotels
- 6.2.3. Mid and Upper Mid-Scale Hotels
- 6.2.4. Luxury Hotels
- 6.1. Market Analysis, Insights and Forecast - by Type
- 7. North America US Hospitality Market Analysis, Insights and Forecast, 2021-2033
- 7.1. Market Analysis, Insights and Forecast - by Type
- 7.1.1. Chain Hotels
- 7.1.2. Independent Hotels
- 7.2. Market Analysis, Insights and Forecast - by Segment
- 7.2.1. Service Apartments
- 7.2.2. Budget and Economy Hotels
- 7.2.3. Mid and Upper Mid-Scale Hotels
- 7.2.4. Luxury Hotels
- 7.1. Market Analysis, Insights and Forecast - by Type
- 8. South America US Hospitality Market Analysis, Insights and Forecast, 2021-2033
- 8.1. Market Analysis, Insights and Forecast - by Type
- 8.1.1. Chain Hotels
- 8.1.2. Independent Hotels
- 8.2. Market Analysis, Insights and Forecast - by Segment
- 8.2.1. Service Apartments
- 8.2.2. Budget and Economy Hotels
- 8.2.3. Mid and Upper Mid-Scale Hotels
- 8.2.4. Luxury Hotels
- 8.1. Market Analysis, Insights and Forecast - by Type
- 9. Europe US Hospitality Market Analysis, Insights and Forecast, 2021-2033
- 9.1. Market Analysis, Insights and Forecast - by Type
- 9.1.1. Chain Hotels
- 9.1.2. Independent Hotels
- 9.2. Market Analysis, Insights and Forecast - by Segment
- 9.2.1. Service Apartments
- 9.2.2. Budget and Economy Hotels
- 9.2.3. Mid and Upper Mid-Scale Hotels
- 9.2.4. Luxury Hotels
- 9.1. Market Analysis, Insights and Forecast - by Type
- 10. Middle East & Africa US Hospitality Market Analysis, Insights and Forecast, 2021-2033
- 10.1. Market Analysis, Insights and Forecast - by Type
- 10.1.1. Chain Hotels
- 10.1.2. Independent Hotels
- 10.2. Market Analysis, Insights and Forecast - by Segment
- 10.2.1. Service Apartments
- 10.2.2. Budget and Economy Hotels
- 10.2.3. Mid and Upper Mid-Scale Hotels
- 10.2.4. Luxury Hotels
- 10.1. Market Analysis, Insights and Forecast - by Type
- 11. Asia Pacific US Hospitality Market Analysis, Insights and Forecast, 2021-2033
- 11.1. Market Analysis, Insights and Forecast - by Type
- 11.1.1. Chain Hotels
- 11.1.2. Independent Hotels
- 11.2. Market Analysis, Insights and Forecast - by Segment
- 11.2.1. Service Apartments
- 11.2.2. Budget and Economy Hotels
- 11.2.3. Mid and Upper Mid-Scale Hotels
- 11.2.4. Luxury Hotels
- 11.1. Market Analysis, Insights and Forecast - by Type
- 12. Competitive Analysis
- 12.1. Company Profiles
- 12.1.1 InterContinental Hotels Group (IHG)
- 12.1.1.1. Company Overview
- 12.1.1.2. Products
- 12.1.1.3. Company Financials
- 12.1.1.4. SWOT Analysis
- 12.1.2 Hyatt Hotels Corporation
- 12.1.2.1. Company Overview
- 12.1.2.2. Products
- 12.1.2.3. Company Financials
- 12.1.2.4. SWOT Analysis
- 12.1.3 Best Western Hotels & Resorts
- 12.1.3.1. Company Overview
- 12.1.3.2. Products
- 12.1.3.3. Company Financials
- 12.1.3.4. SWOT Analysis
- 12.1.4 Airbnb**List Not Exhaustive
- 12.1.4.1. Company Overview
- 12.1.4.2. Products
- 12.1.4.3. Company Financials
- 12.1.4.4. SWOT Analysis
- 12.1.5 Marriott International
- 12.1.5.1. Company Overview
- 12.1.5.2. Products
- 12.1.5.3. Company Financials
- 12.1.5.4. SWOT Analysis
- 12.1.6 G6 Hospitality
- 12.1.6.1. Company Overview
- 12.1.6.2. Products
- 12.1.6.3. Company Financials
- 12.1.6.4. SWOT Analysis
- 12.1.7 Hilton Worldwide
- 12.1.7.1. Company Overview
- 12.1.7.2. Products
- 12.1.7.3. Company Financials
- 12.1.7.4. SWOT Analysis
- 12.1.8 Choice Hotels International
- 12.1.8.1. Company Overview
- 12.1.8.2. Products
- 12.1.8.3. Company Financials
- 12.1.8.4. SWOT Analysis
- 12.1.9 Wyndham Hotels & Resorts
- 12.1.9.1. Company Overview
- 12.1.9.2. Products
- 12.1.9.3. Company Financials
- 12.1.9.4. SWOT Analysis
- 12.1.10 Aimbridge Hospitality
- 12.1.10.1. Company Overview
- 12.1.10.2. Products
- 12.1.10.3. Company Financials
- 12.1.10.4. SWOT Analysis
- 12.1.1 InterContinental Hotels Group (IHG)
- 12.2. Market Entropy
- 12.2.1 Company's Key Areas Served
- 12.2.2 Recent Developments
- 12.3. Company Market Share Analysis 2025
- 12.3.1 Top 5 Companies Market Share Analysis
- 12.3.2 Top 3 Companies Market Share Analysis
- 12.4. List of Potential Customers
- 13. Research Methodology
List of Figures
- Figure 1: Global US Hospitality Market Revenue Breakdown (Million, %) by Region 2025 & 2033
- Figure 2: North America US Hospitality Market Revenue (Million), by Type 2025 & 2033
- Figure 3: North America US Hospitality Market Revenue Share (%), by Type 2025 & 2033
- Figure 4: North America US Hospitality Market Revenue (Million), by Segment 2025 & 2033
- Figure 5: North America US Hospitality Market Revenue Share (%), by Segment 2025 & 2033
- Figure 6: North America US Hospitality Market Revenue (Million), by Country 2025 & 2033
- Figure 7: North America US Hospitality Market Revenue Share (%), by Country 2025 & 2033
- Figure 8: South America US Hospitality Market Revenue (Million), by Type 2025 & 2033
- Figure 9: South America US Hospitality Market Revenue Share (%), by Type 2025 & 2033
- Figure 10: South America US Hospitality Market Revenue (Million), by Segment 2025 & 2033
- Figure 11: South America US Hospitality Market Revenue Share (%), by Segment 2025 & 2033
- Figure 12: South America US Hospitality Market Revenue (Million), by Country 2025 & 2033
- Figure 13: South America US Hospitality Market Revenue Share (%), by Country 2025 & 2033
- Figure 14: Europe US Hospitality Market Revenue (Million), by Type 2025 & 2033
- Figure 15: Europe US Hospitality Market Revenue Share (%), by Type 2025 & 2033
- Figure 16: Europe US Hospitality Market Revenue (Million), by Segment 2025 & 2033
- Figure 17: Europe US Hospitality Market Revenue Share (%), by Segment 2025 & 2033
- Figure 18: Europe US Hospitality Market Revenue (Million), by Country 2025 & 2033
- Figure 19: Europe US Hospitality Market Revenue Share (%), by Country 2025 & 2033
- Figure 20: Middle East & Africa US Hospitality Market Revenue (Million), by Type 2025 & 2033
- Figure 21: Middle East & Africa US Hospitality Market Revenue Share (%), by Type 2025 & 2033
- Figure 22: Middle East & Africa US Hospitality Market Revenue (Million), by Segment 2025 & 2033
- Figure 23: Middle East & Africa US Hospitality Market Revenue Share (%), by Segment 2025 & 2033
- Figure 24: Middle East & Africa US Hospitality Market Revenue (Million), by Country 2025 & 2033
- Figure 25: Middle East & Africa US Hospitality Market Revenue Share (%), by Country 2025 & 2033
- Figure 26: Asia Pacific US Hospitality Market Revenue (Million), by Type 2025 & 2033
- Figure 27: Asia Pacific US Hospitality Market Revenue Share (%), by Type 2025 & 2033
- Figure 28: Asia Pacific US Hospitality Market Revenue (Million), by Segment 2025 & 2033
- Figure 29: Asia Pacific US Hospitality Market Revenue Share (%), by Segment 2025 & 2033
- Figure 30: Asia Pacific US Hospitality Market Revenue (Million), by Country 2025 & 2033
- Figure 31: Asia Pacific US Hospitality Market Revenue Share (%), by Country 2025 & 2033
List of Tables
- Table 1: Global US Hospitality Market Revenue Million Forecast, by Type 2020 & 2033
- Table 2: Global US Hospitality Market Revenue Million Forecast, by Segment 2020 & 2033
- Table 3: Global US Hospitality Market Revenue Million Forecast, by Region 2020 & 2033
- Table 4: Global US Hospitality Market Revenue Million Forecast, by Type 2020 & 2033
- Table 5: Global US Hospitality Market Revenue Million Forecast, by Segment 2020 & 2033
- Table 6: Global US Hospitality Market Revenue Million Forecast, by Country 2020 & 2033
- Table 7: United States US Hospitality Market Revenue (Million) Forecast, by Application 2020 & 2033
- Table 8: Canada US Hospitality Market Revenue (Million) Forecast, by Application 2020 & 2033
- Table 9: Mexico US Hospitality Market Revenue (Million) Forecast, by Application 2020 & 2033
- Table 10: Global US Hospitality Market Revenue Million Forecast, by Type 2020 & 2033
- Table 11: Global US Hospitality Market Revenue Million Forecast, by Segment 2020 & 2033
- Table 12: Global US Hospitality Market Revenue Million Forecast, by Country 2020 & 2033
- Table 13: Brazil US Hospitality Market Revenue (Million) Forecast, by Application 2020 & 2033
- Table 14: Argentina US Hospitality Market Revenue (Million) Forecast, by Application 2020 & 2033
- Table 15: Rest of South America US Hospitality Market Revenue (Million) Forecast, by Application 2020 & 2033
- Table 16: Global US Hospitality Market Revenue Million Forecast, by Type 2020 & 2033
- Table 17: Global US Hospitality Market Revenue Million Forecast, by Segment 2020 & 2033
- Table 18: Global US Hospitality Market Revenue Million Forecast, by Country 2020 & 2033
- Table 19: United Kingdom US Hospitality Market Revenue (Million) Forecast, by Application 2020 & 2033
- Table 20: Germany US Hospitality Market Revenue (Million) Forecast, by Application 2020 & 2033
- Table 21: France US Hospitality Market Revenue (Million) Forecast, by Application 2020 & 2033
- Table 22: Italy US Hospitality Market Revenue (Million) Forecast, by Application 2020 & 2033
- Table 23: Spain US Hospitality Market Revenue (Million) Forecast, by Application 2020 & 2033
- Table 24: Russia US Hospitality Market Revenue (Million) Forecast, by Application 2020 & 2033
- Table 25: Benelux US Hospitality Market Revenue (Million) Forecast, by Application 2020 & 2033
- Table 26: Nordics US Hospitality Market Revenue (Million) Forecast, by Application 2020 & 2033
- Table 27: Rest of Europe US Hospitality Market Revenue (Million) Forecast, by Application 2020 & 2033
- Table 28: Global US Hospitality Market Revenue Million Forecast, by Type 2020 & 2033
- Table 29: Global US Hospitality Market Revenue Million Forecast, by Segment 2020 & 2033
- Table 30: Global US Hospitality Market Revenue Million Forecast, by Country 2020 & 2033
- Table 31: Turkey US Hospitality Market Revenue (Million) Forecast, by Application 2020 & 2033
- Table 32: Israel US Hospitality Market Revenue (Million) Forecast, by Application 2020 & 2033
- Table 33: GCC US Hospitality Market Revenue (Million) Forecast, by Application 2020 & 2033
- Table 34: North Africa US Hospitality Market Revenue (Million) Forecast, by Application 2020 & 2033
- Table 35: South Africa US Hospitality Market Revenue (Million) Forecast, by Application 2020 & 2033
- Table 36: Rest of Middle East & Africa US Hospitality Market Revenue (Million) Forecast, by Application 2020 & 2033
- Table 37: Global US Hospitality Market Revenue Million Forecast, by Type 2020 & 2033
- Table 38: Global US Hospitality Market Revenue Million Forecast, by Segment 2020 & 2033
- Table 39: Global US Hospitality Market Revenue Million Forecast, by Country 2020 & 2033
- Table 40: China US Hospitality Market Revenue (Million) Forecast, by Application 2020 & 2033
- Table 41: India US Hospitality Market Revenue (Million) Forecast, by Application 2020 & 2033
- Table 42: Japan US Hospitality Market Revenue (Million) Forecast, by Application 2020 & 2033
- Table 43: South Korea US Hospitality Market Revenue (Million) Forecast, by Application 2020 & 2033
- Table 44: ASEAN US Hospitality Market Revenue (Million) Forecast, by Application 2020 & 2033
- Table 45: Oceania US Hospitality Market Revenue (Million) Forecast, by Application 2020 & 2033
- Table 46: Rest of Asia Pacific US Hospitality Market Revenue (Million) Forecast, by Application 2020 & 2033
Frequently Asked Questions
1. What is the projected Compound Annual Growth Rate (CAGR) of the US Hospitality Market?
The projected CAGR is approximately 4.87%.
2. Which companies are prominent players in the US Hospitality Market?
Key companies in the market include InterContinental Hotels Group (IHG), Hyatt Hotels Corporation, Best Western Hotels & Resorts, Airbnb**List Not Exhaustive, Marriott International, G6 Hospitality, Hilton Worldwide, Choice Hotels International, Wyndham Hotels & Resorts, Aimbridge Hospitality.
3. What are the main segments of the US Hospitality Market?
The market segments include Type, Segment.
4. Can you provide details about the market size?
The market size is estimated to be USD 235.96 Million as of 2022.
5. What are some drivers contributing to market growth?
Growing Tourism Increasing Demand for Hospitality Services; Consistent Demand for Business Travel and Corporate Hospitality Services.
6. What are the notable trends driving market growth?
US Hotel Occupancy Soars. Fueled by Diverse Factors and Economic Uptick.
7. Are there any restraints impacting market growth?
Stringent Government Policies and Regulations Limiting the Market Growth; Lack of Skilled Labor is a Challenge for the Market.
8. Can you provide examples of recent developments in the market?
September 2023: IHG Hotels & Resorts opened a new Holiday Inn property in South Philadelphia following a conversion and renovation. Located minutes from Philadelphia International Airport and within walking distance of the city’s primary sports and entertainment facilities complex (which includes Lincoln Financial Field, Citizens Bank Park, and Wells Fargo Center), Holiday Inn Philadelphia Airport Stadium Area delivers a convenient, comfortable, and welcoming experience appropriate for the “City of Brotherly Love.”
9. What pricing options are available for accessing the report?
Pricing options include single-user, multi-user, and enterprise licenses priced at USD 3800, USD 4500, and USD 5800 respectively.
10. Is the market size provided in terms of value or volume?
The market size is provided in terms of value, measured in Million.
11. Are there any specific market keywords associated with the report?
Yes, the market keyword associated with the report is "US Hospitality Market," which aids in identifying and referencing the specific market segment covered.
12. How do I determine which pricing option suits my needs best?
The pricing options vary based on user requirements and access needs. Individual users may opt for single-user licenses, while businesses requiring broader access may choose multi-user or enterprise licenses for cost-effective access to the report.
13. Are there any additional resources or data provided in the US Hospitality Market report?
While the report offers comprehensive insights, it's advisable to review the specific contents or supplementary materials provided to ascertain if additional resources or data are available.
14. How can I stay updated on further developments or reports in the US Hospitality Market?
To stay informed about further developments, trends, and reports in the US Hospitality Market, consider subscribing to industry newsletters, following relevant companies and organizations, or regularly checking reputable industry news sources and publications.
Methodology
Step 1 - Identification of Relevant Samples Size from Population Database


Step 2 - Approaches for Defining Global Market Size (Value, Volume* & Price*)

Note*: In applicable scenarios
Step 3 - Data Sources
Primary Research
- Web Analytics
- Survey Reports
- Research Institute
- Latest Research Reports
- Opinion Leaders
Secondary Research
- Annual Reports
- White Paper
- Latest Press Release
- Industry Association
- Paid Database
- Investor Presentations

Step 4 - Data Triangulation
Involves using different sources of information in order to increase the validity of a study
These sources are likely to be stakeholders in a program - participants, other researchers, program staff, other community members, and so on.
Then we put all data in single framework & apply various statistical tools to find out the dynamic on the market.
During the analysis stage, feedback from the stakeholder groups would be compared to determine areas of agreement as well as areas of divergence