

Key Insights
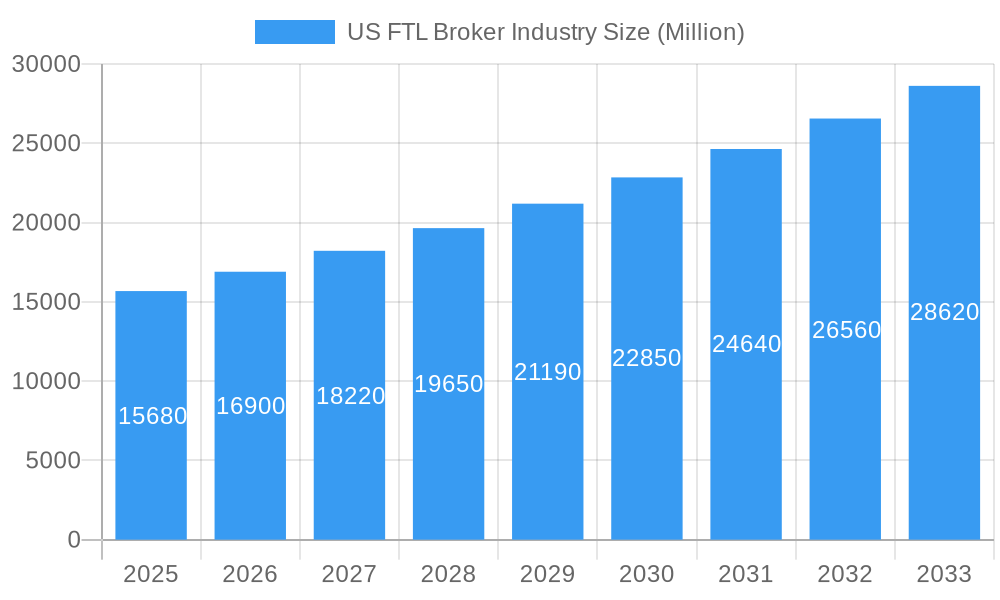
The US full truckload (FTL) brokerage market, valued at $15.68 billion in 2025, is projected to experience robust growth, driven by a compound annual growth rate (CAGR) of 7.86% from 2025 to 2033. This expansion is fueled by several key factors. The increasing reliance on efficient logistics solutions by manufacturers, particularly in the automotive and manufacturing sectors, is a significant driver. E-commerce's continued growth necessitates faster and more reliable delivery networks, bolstering demand for FTL brokerage services. Furthermore, advancements in transportation management systems (TMS) and digital freight matching platforms are streamlining operations and enhancing transparency, attracting new businesses and improving efficiency within the industry. The diversification of end-user industries, including oil and gas, mining, construction, and agriculture, further contributes to market expansion. While potential regulatory changes and fluctuating fuel prices pose challenges, the overall market outlook remains positive, with considerable opportunities for growth and innovation within the FTL brokerage sector.
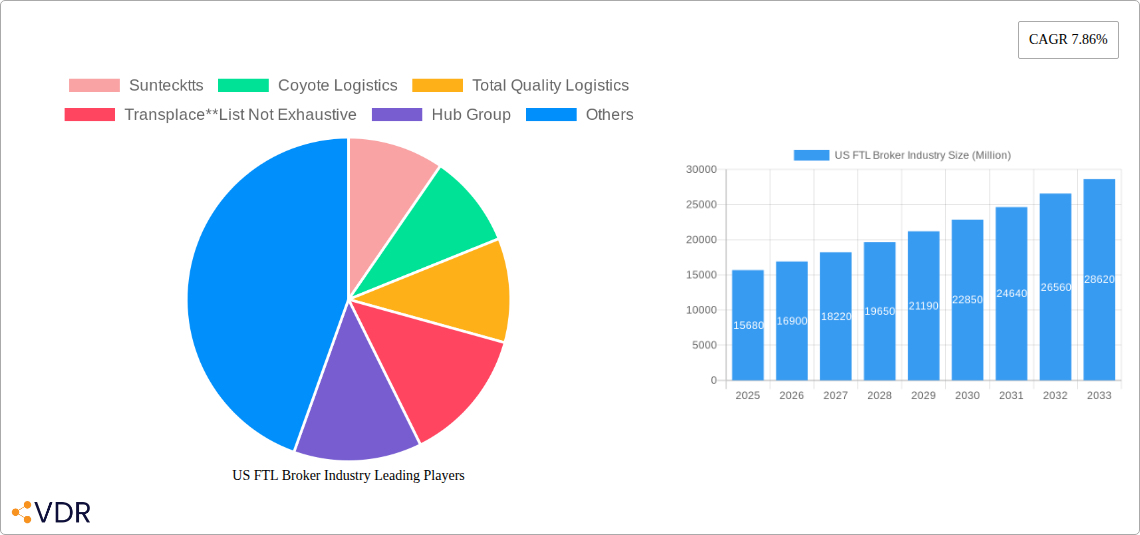
US FTL Broker Industry Market Size (In Billion)
The competitive landscape is characterized by a mix of large, established players and smaller, specialized firms. Major players like Coyote Logistics, C.H. Robinson, and Schneider National leverage their extensive networks and technological capabilities to maintain market share. However, smaller firms are carving niches by focusing on specific industry verticals or geographical regions. The market is witnessing increased consolidation, with mergers and acquisitions shaping the competitive dynamic. Technological advancements continue to disrupt the industry, fostering efficiency and improving customer experience. The adoption of real-time tracking, predictive analytics, and automated routing enhances service offerings and reduces operational costs. This trend creates opportunities for companies that effectively integrate technology into their services, improving visibility and responsiveness in the supply chain. The demand for sustainable and environmentally friendly transportation solutions will also influence future growth, prompting companies to adopt greener practices.
US FTL Broker Industry Company Market Share
US FTL Broker Industry Market Report: 2019-2033
This comprehensive report provides a deep dive into the dynamics, growth trends, and future outlook of the US Full Truckload (FTL) Broker industry, a crucial segment of the broader US Logistics and Transportation market. The report analyzes the market from 2019 to 2033, offering historical data, current estimates, and future projections. Key players like Coyote Logistics, Total Quality Logistics, and C.H. Robinson are profiled, alongside an analysis of key segments like Manufacturing and Automotive and Oil & Gas. This report is essential for industry professionals, investors, and anyone seeking a thorough understanding of this dynamic market.
US FTL Broker Industry Market Dynamics & Structure
The US FTL broker industry is characterized by a moderately consolidated market structure, with a few large players holding significant market share. Market concentration is influenced by factors such as technological advancements, economies of scale, and regulatory frameworks. The industry witnesses continuous technological innovation, driven by the need for enhanced efficiency, transparency, and real-time tracking capabilities. Regulatory changes, particularly those impacting trucking regulations and safety standards, significantly influence market operations. Competitive pressures from alternative transportation modes (e.g., rail) and the emergence of digital freight platforms also shape the landscape. M&A activity is relatively frequent, driven by the pursuit of scale, geographic expansion, and access to new technologies.
- Market Concentration: Top 5 players hold approximately xx% of market share (2024).
- Technological Innovation: Increased adoption of TMS (Transportation Management Systems), AI-powered route optimization, and blockchain for enhanced transparency.
- Regulatory Framework: Compliance with FMCSA regulations significantly impacts operational costs and efficiency.
- Competitive Substitutes: Rail freight and LTL (Less-than-Truckload) shipping present alternative options.
- M&A Activity: An average of xx M&A deals annually in the past 5 years (2019-2024), totaling approximately $xx billion.
- End-User Demographics: Manufacturing and Automotive remains the largest end-user segment, followed by Oil & Gas and Distributive Trade.
US FTL Broker Industry Growth Trends & Insights
The US FTL broker market exhibited a CAGR of xx% during the historical period (2019-2024), reaching an estimated market size of $xx billion in 2024. This growth is attributed to several factors, including increasing e-commerce activity, fluctuations in fuel prices, the growth of the manufacturing and automotive sector, and the adoption of advanced technologies in logistics. The market is expected to continue its growth trajectory, with a projected CAGR of xx% during the forecast period (2025-2033), reaching $xx billion by 2033. Technological disruptions, such as the rise of digital freight matching platforms and autonomous trucking technologies, are expected to further transform the industry. Shifting consumer preferences towards faster delivery times and increased transparency in supply chains also contribute to market growth.
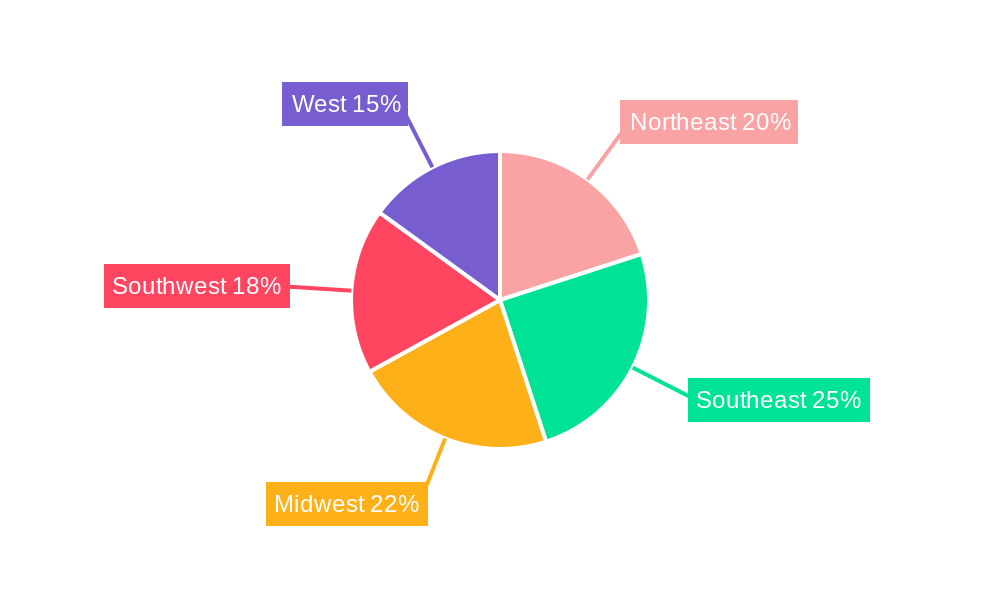
Dominant Regions, Countries, or Segments in US FTL Broker Industry
The Manufacturing and Automotive segment dominates the US FTL broker market, accounting for approximately xx% of the total market share in 2024. This dominance stems from the high volume of goods transported within this sector, necessitating efficient and cost-effective logistics solutions. Other significant segments include Oil & Gas, Distributive Trade, and Construction. Growth in these segments is influenced by economic conditions, infrastructure development, and government policies. Specific regions within the US, like the Southeast and Midwest, show higher growth potential due to factors like increased industrial activity and robust infrastructure.
- Key Drivers in Manufacturing and Automotive: High volume of goods transportation, just-in-time delivery requirements, and stringent supply chain management.
- Key Drivers in Oil & Gas: Transportation of raw materials and finished products across long distances.
- Regional Growth: Midwest and Southeast regions show strong potential due to industrial expansion and logistical infrastructure.
- Market Share: Manufacturing & Automotive holds approximately xx% market share, followed by Oil & Gas at xx%.
US FTL Broker Industry Product Landscape
The FTL broker industry offers a range of services, including load matching, shipment tracking, and rate negotiation. Technological advancements have led to the development of sophisticated platforms that provide real-time visibility, predictive analytics, and automated processes. Unique selling propositions include specialized expertise in certain industry verticals (e.g., refrigerated transport), customized logistics solutions, and strong carrier networks. The ongoing development of AI-powered tools and digital freight matching platforms is enhancing operational efficiency and reducing costs for both brokers and shippers.
Key Drivers, Barriers & Challenges in US FTL Broker Industry
Key Drivers: Increased e-commerce activity, demand for faster and more efficient logistics, technological advancements, and government initiatives promoting infrastructure development.
Challenges: Driver shortages, fluctuating fuel prices, increasing insurance costs, and intense competition from established players and new entrants in the digital freight brokerage space. These challenges collectively impact operational efficiency and profitability, potentially limiting market growth. Driver shortages alone are estimated to cost the industry xx million annually.
Emerging Opportunities in US FTL Broker Industry
Emerging opportunities lie in the integration of advanced technologies such as AI and machine learning for predictive analytics and automated processes. The growth of e-commerce continues to create new demands, especially in last-mile delivery and specialized transportation needs. Expansion into underserved regional markets and the development of niche services catering to specific industries present significant growth potential.
Growth Accelerators in the US FTL Broker Industry
Technological breakthroughs, particularly in AI and automation, are driving significant efficiency gains and cost reductions. Strategic partnerships with technology providers and carriers enhance service capabilities and expand market reach. Market expansion into new geographic areas and specialized industry verticals further accelerates growth.
Key Players Shaping the US FTL Broker Industry Market
- Suntecktts
- Coyote Logistics
- Total Quality Logistics
- Transplace
- Hub Group
- Landstar System Inc
- C.H. Robinson
- BNSF Logistics LLC
- XPO Logistics Inc
- Worldwide Express
- Schneider
- Echo Global Logistics
- J.B. Hunt Transport Inc
- Kag Logistics Inc
- Globaltranz
Notable Milestones in US FTL Broker Industry Sector
- Sept 2023: Rhenus acquires ITS Logistics Hungary KFT, expanding its air freight capabilities in Hungary.
- Sept 2023: Rhenus acquires BLU Logistics, strengthening its presence in LATAM and Asia-LATAM trade lanes.
In-Depth US FTL Broker Industry Market Outlook
The US FTL broker market is poised for sustained growth, driven by ongoing technological advancements, increasing e-commerce activity, and the expansion of key industry segments. Strategic partnerships, innovative service offerings, and expansion into new markets will be crucial for success. The market's future potential is significant, with opportunities for both established players and new entrants to capitalize on the evolving needs of shippers and carriers.
US FTL Broker Industry Segmentation
-
1. End User
- 1.1. Manufacturing and Automotive
- 1.2. Oil and Gas, Mining, and Quarrying
- 1.3. Agriculture Fishing, and Forestry
- 1.4. Construction
- 1.5. Distributive Trade
- 1.6. Other End Users
US FTL Broker Industry Segmentation By Geography
-
1. North America
- 1.1. United States
- 1.2. Canada
- 1.3. Mexico
-
2. South America
- 2.1. Brazil
- 2.2. Argentina
- 2.3. Rest of South America
-
3. Europe
- 3.1. United Kingdom
- 3.2. Germany
- 3.3. France
- 3.4. Italy
- 3.5. Spain
- 3.6. Russia
- 3.7. Benelux
- 3.8. Nordics
- 3.9. Rest of Europe
-
4. Middle East & Africa
- 4.1. Turkey
- 4.2. Israel
- 4.3. GCC
- 4.4. North Africa
- 4.5. South Africa
- 4.6. Rest of Middle East & Africa
-
5. Asia Pacific
- 5.1. China
- 5.2. India
- 5.3. Japan
- 5.4. South Korea
- 5.5. ASEAN
- 5.6. Oceania
- 5.7. Rest of Asia Pacific
US FTL Broker Industry Regional Market Share
Geographic Coverage of US FTL Broker Industry
US FTL Broker Industry REPORT HIGHLIGHTS
| Aspects | Details |
|---|---|
| Study Period | 2020-2034 |
| Base Year | 2025 |
| Estimated Year | 2026 |
| Forecast Period | 2026-2034 |
| Historical Period | 2020-2025 |
| Growth Rate | CAGR of 7.86% from 2020-2034 |
| Segmentation |
|
Table of Contents
- 1. Introduction
- 1.1. Research Scope
- 1.2. Market Segmentation
- 1.3. Research Objective
- 1.4. Definitions and Assumptions
- 2. Executive Summary
- 2.1. Market Snapshot
- 3. Market Dynamics
- 3.1. Market Drivers
- 3.2. Market Restrains
- 3.3. Market Trends
- 3.4. Market Opportunities
- 4. Market Factor Analysis
- 4.1. Porters Five Forces
- 4.1.1. Bargaining Power of Suppliers
- 4.1.2. Bargaining Power of Buyers
- 4.1.3. Threat of New Entrants
- 4.1.4. Threat of Substitutes
- 4.1.5. Competitive Rivalry
- 4.2. PESTEL analysis
- 4.3. BCG Analysis
- 4.3.1. Stars (High Growth, High Market Share)
- 4.3.2. Cash Cows (Low Growth, High Market Share)
- 4.3.3. Question Mark (High Growth, Low Market Share)
- 4.3.4. Dogs (Low Growth, Low Market Share)
- 4.4. Ansoff Matrix Analysis
- 4.5. Supply Chain Analysis
- 4.6. Regulatory Landscape
- 4.7. Current Market Potential and Opportunity Assessment (TAM–SAM–SOM Framework)
- 4.8. VDR Analyst Note
- 4.1. Porters Five Forces
- 5. Market Analysis, Insights and Forecast 2021-2033
- 5.1. Market Analysis, Insights and Forecast - by End User
- 5.1.1. Manufacturing and Automotive
- 5.1.2. Oil and Gas, Mining, and Quarrying
- 5.1.3. Agriculture Fishing, and Forestry
- 5.1.4. Construction
- 5.1.5. Distributive Trade
- 5.1.6. Other End Users
- 5.2. Market Analysis, Insights and Forecast - by Region
- 5.2.1. North America
- 5.2.2. South America
- 5.2.3. Europe
- 5.2.4. Middle East & Africa
- 5.2.5. Asia Pacific
- 5.1. Market Analysis, Insights and Forecast - by End User
- 6. Global US FTL Broker Industry Analysis, Insights and Forecast, 2021-2033
- 6.1. Market Analysis, Insights and Forecast - by End User
- 6.1.1. Manufacturing and Automotive
- 6.1.2. Oil and Gas, Mining, and Quarrying
- 6.1.3. Agriculture Fishing, and Forestry
- 6.1.4. Construction
- 6.1.5. Distributive Trade
- 6.1.6. Other End Users
- 6.1. Market Analysis, Insights and Forecast - by End User
- 7. North America US FTL Broker Industry Analysis, Insights and Forecast, 2021-2033
- 7.1. Market Analysis, Insights and Forecast - by End User
- 7.1.1. Manufacturing and Automotive
- 7.1.2. Oil and Gas, Mining, and Quarrying
- 7.1.3. Agriculture Fishing, and Forestry
- 7.1.4. Construction
- 7.1.5. Distributive Trade
- 7.1.6. Other End Users
- 7.1. Market Analysis, Insights and Forecast - by End User
- 8. South America US FTL Broker Industry Analysis, Insights and Forecast, 2021-2033
- 8.1. Market Analysis, Insights and Forecast - by End User
- 8.1.1. Manufacturing and Automotive
- 8.1.2. Oil and Gas, Mining, and Quarrying
- 8.1.3. Agriculture Fishing, and Forestry
- 8.1.4. Construction
- 8.1.5. Distributive Trade
- 8.1.6. Other End Users
- 8.1. Market Analysis, Insights and Forecast - by End User
- 9. Europe US FTL Broker Industry Analysis, Insights and Forecast, 2021-2033
- 9.1. Market Analysis, Insights and Forecast - by End User
- 9.1.1. Manufacturing and Automotive
- 9.1.2. Oil and Gas, Mining, and Quarrying
- 9.1.3. Agriculture Fishing, and Forestry
- 9.1.4. Construction
- 9.1.5. Distributive Trade
- 9.1.6. Other End Users
- 9.1. Market Analysis, Insights and Forecast - by End User
- 10. Middle East & Africa US FTL Broker Industry Analysis, Insights and Forecast, 2021-2033
- 10.1. Market Analysis, Insights and Forecast - by End User
- 10.1.1. Manufacturing and Automotive
- 10.1.2. Oil and Gas, Mining, and Quarrying
- 10.1.3. Agriculture Fishing, and Forestry
- 10.1.4. Construction
- 10.1.5. Distributive Trade
- 10.1.6. Other End Users
- 10.1. Market Analysis, Insights and Forecast - by End User
- 11. Asia Pacific US FTL Broker Industry Analysis, Insights and Forecast, 2021-2033
- 11.1. Market Analysis, Insights and Forecast - by End User
- 11.1.1. Manufacturing and Automotive
- 11.1.2. Oil and Gas, Mining, and Quarrying
- 11.1.3. Agriculture Fishing, and Forestry
- 11.1.4. Construction
- 11.1.5. Distributive Trade
- 11.1.6. Other End Users
- 11.1. Market Analysis, Insights and Forecast - by End User
- 12. Competitive Analysis
- 12.1. Company Profiles
- 12.1.1 Suntecktts
- 12.1.1.1. Company Overview
- 12.1.1.2. Products
- 12.1.1.3. Company Financials
- 12.1.1.4. SWOT Analysis
- 12.1.2 Coyote Logistics
- 12.1.2.1. Company Overview
- 12.1.2.2. Products
- 12.1.2.3. Company Financials
- 12.1.2.4. SWOT Analysis
- 12.1.3 Total Quality Logistics
- 12.1.3.1. Company Overview
- 12.1.3.2. Products
- 12.1.3.3. Company Financials
- 12.1.3.4. SWOT Analysis
- 12.1.4 Transplace**List Not Exhaustive
- 12.1.4.1. Company Overview
- 12.1.4.2. Products
- 12.1.4.3. Company Financials
- 12.1.4.4. SWOT Analysis
- 12.1.5 Hub Group
- 12.1.5.1. Company Overview
- 12.1.5.2. Products
- 12.1.5.3. Company Financials
- 12.1.5.4. SWOT Analysis
- 12.1.6 Landstar System Inc
- 12.1.6.1. Company Overview
- 12.1.6.2. Products
- 12.1.6.3. Company Financials
- 12.1.6.4. SWOT Analysis
- 12.1.7 CH Robinson
- 12.1.7.1. Company Overview
- 12.1.7.2. Products
- 12.1.7.3. Company Financials
- 12.1.7.4. SWOT Analysis
- 12.1.8 BNSF Logistics LLC
- 12.1.8.1. Company Overview
- 12.1.8.2. Products
- 12.1.8.3. Company Financials
- 12.1.8.4. SWOT Analysis
- 12.1.9 XPO Logistics Inc
- 12.1.9.1. Company Overview
- 12.1.9.2. Products
- 12.1.9.3. Company Financials
- 12.1.9.4. SWOT Analysis
- 12.1.10 Worldwide Express
- 12.1.10.1. Company Overview
- 12.1.10.2. Products
- 12.1.10.3. Company Financials
- 12.1.10.4. SWOT Analysis
- 12.1.11 Schneider
- 12.1.11.1. Company Overview
- 12.1.11.2. Products
- 12.1.11.3. Company Financials
- 12.1.11.4. SWOT Analysis
- 12.1.12 Echo Global Logistics
- 12.1.12.1. Company Overview
- 12.1.12.2. Products
- 12.1.12.3. Company Financials
- 12.1.12.4. SWOT Analysis
- 12.1.13 J B Hunt Transport Inc
- 12.1.13.1. Company Overview
- 12.1.13.2. Products
- 12.1.13.3. Company Financials
- 12.1.13.4. SWOT Analysis
- 12.1.14 Kag Logistics Inc
- 12.1.14.1. Company Overview
- 12.1.14.2. Products
- 12.1.14.3. Company Financials
- 12.1.14.4. SWOT Analysis
- 12.1.15 Globaltranz
- 12.1.15.1. Company Overview
- 12.1.15.2. Products
- 12.1.15.3. Company Financials
- 12.1.15.4. SWOT Analysis
- 12.1.1 Suntecktts
- 12.2. Market Entropy
- 12.2.1 Company's Key Areas Served
- 12.2.2 Recent Developments
- 12.3. Company Market Share Analysis 2025
- 12.3.1 Top 5 Companies Market Share Analysis
- 12.3.2 Top 3 Companies Market Share Analysis
- 12.4. List of Potential Customers
- 13. Research Methodology
List of Figures
- Figure 1: Global US FTL Broker Industry Revenue Breakdown (Million, %) by Region 2025 & 2033
- Figure 2: North America US FTL Broker Industry Revenue (Million), by End User 2025 & 2033
- Figure 3: North America US FTL Broker Industry Revenue Share (%), by End User 2025 & 2033
- Figure 4: North America US FTL Broker Industry Revenue (Million), by Country 2025 & 2033
- Figure 5: North America US FTL Broker Industry Revenue Share (%), by Country 2025 & 2033
- Figure 6: South America US FTL Broker Industry Revenue (Million), by End User 2025 & 2033
- Figure 7: South America US FTL Broker Industry Revenue Share (%), by End User 2025 & 2033
- Figure 8: South America US FTL Broker Industry Revenue (Million), by Country 2025 & 2033
- Figure 9: South America US FTL Broker Industry Revenue Share (%), by Country 2025 & 2033
- Figure 10: Europe US FTL Broker Industry Revenue (Million), by End User 2025 & 2033
- Figure 11: Europe US FTL Broker Industry Revenue Share (%), by End User 2025 & 2033
- Figure 12: Europe US FTL Broker Industry Revenue (Million), by Country 2025 & 2033
- Figure 13: Europe US FTL Broker Industry Revenue Share (%), by Country 2025 & 2033
- Figure 14: Middle East & Africa US FTL Broker Industry Revenue (Million), by End User 2025 & 2033
- Figure 15: Middle East & Africa US FTL Broker Industry Revenue Share (%), by End User 2025 & 2033
- Figure 16: Middle East & Africa US FTL Broker Industry Revenue (Million), by Country 2025 & 2033
- Figure 17: Middle East & Africa US FTL Broker Industry Revenue Share (%), by Country 2025 & 2033
- Figure 18: Asia Pacific US FTL Broker Industry Revenue (Million), by End User 2025 & 2033
- Figure 19: Asia Pacific US FTL Broker Industry Revenue Share (%), by End User 2025 & 2033
- Figure 20: Asia Pacific US FTL Broker Industry Revenue (Million), by Country 2025 & 2033
- Figure 21: Asia Pacific US FTL Broker Industry Revenue Share (%), by Country 2025 & 2033
List of Tables
- Table 1: Global US FTL Broker Industry Revenue Million Forecast, by End User 2020 & 2033
- Table 2: Global US FTL Broker Industry Revenue Million Forecast, by Region 2020 & 2033
- Table 3: Global US FTL Broker Industry Revenue Million Forecast, by End User 2020 & 2033
- Table 4: Global US FTL Broker Industry Revenue Million Forecast, by Country 2020 & 2033
- Table 5: United States US FTL Broker Industry Revenue (Million) Forecast, by Application 2020 & 2033
- Table 6: Canada US FTL Broker Industry Revenue (Million) Forecast, by Application 2020 & 2033
- Table 7: Mexico US FTL Broker Industry Revenue (Million) Forecast, by Application 2020 & 2033
- Table 8: Global US FTL Broker Industry Revenue Million Forecast, by End User 2020 & 2033
- Table 9: Global US FTL Broker Industry Revenue Million Forecast, by Country 2020 & 2033
- Table 10: Brazil US FTL Broker Industry Revenue (Million) Forecast, by Application 2020 & 2033
- Table 11: Argentina US FTL Broker Industry Revenue (Million) Forecast, by Application 2020 & 2033
- Table 12: Rest of South America US FTL Broker Industry Revenue (Million) Forecast, by Application 2020 & 2033
- Table 13: Global US FTL Broker Industry Revenue Million Forecast, by End User 2020 & 2033
- Table 14: Global US FTL Broker Industry Revenue Million Forecast, by Country 2020 & 2033
- Table 15: United Kingdom US FTL Broker Industry Revenue (Million) Forecast, by Application 2020 & 2033
- Table 16: Germany US FTL Broker Industry Revenue (Million) Forecast, by Application 2020 & 2033
- Table 17: France US FTL Broker Industry Revenue (Million) Forecast, by Application 2020 & 2033
- Table 18: Italy US FTL Broker Industry Revenue (Million) Forecast, by Application 2020 & 2033
- Table 19: Spain US FTL Broker Industry Revenue (Million) Forecast, by Application 2020 & 2033
- Table 20: Russia US FTL Broker Industry Revenue (Million) Forecast, by Application 2020 & 2033
- Table 21: Benelux US FTL Broker Industry Revenue (Million) Forecast, by Application 2020 & 2033
- Table 22: Nordics US FTL Broker Industry Revenue (Million) Forecast, by Application 2020 & 2033
- Table 23: Rest of Europe US FTL Broker Industry Revenue (Million) Forecast, by Application 2020 & 2033
- Table 24: Global US FTL Broker Industry Revenue Million Forecast, by End User 2020 & 2033
- Table 25: Global US FTL Broker Industry Revenue Million Forecast, by Country 2020 & 2033
- Table 26: Turkey US FTL Broker Industry Revenue (Million) Forecast, by Application 2020 & 2033
- Table 27: Israel US FTL Broker Industry Revenue (Million) Forecast, by Application 2020 & 2033
- Table 28: GCC US FTL Broker Industry Revenue (Million) Forecast, by Application 2020 & 2033
- Table 29: North Africa US FTL Broker Industry Revenue (Million) Forecast, by Application 2020 & 2033
- Table 30: South Africa US FTL Broker Industry Revenue (Million) Forecast, by Application 2020 & 2033
- Table 31: Rest of Middle East & Africa US FTL Broker Industry Revenue (Million) Forecast, by Application 2020 & 2033
- Table 32: Global US FTL Broker Industry Revenue Million Forecast, by End User 2020 & 2033
- Table 33: Global US FTL Broker Industry Revenue Million Forecast, by Country 2020 & 2033
- Table 34: China US FTL Broker Industry Revenue (Million) Forecast, by Application 2020 & 2033
- Table 35: India US FTL Broker Industry Revenue (Million) Forecast, by Application 2020 & 2033
- Table 36: Japan US FTL Broker Industry Revenue (Million) Forecast, by Application 2020 & 2033
- Table 37: South Korea US FTL Broker Industry Revenue (Million) Forecast, by Application 2020 & 2033
- Table 38: ASEAN US FTL Broker Industry Revenue (Million) Forecast, by Application 2020 & 2033
- Table 39: Oceania US FTL Broker Industry Revenue (Million) Forecast, by Application 2020 & 2033
- Table 40: Rest of Asia Pacific US FTL Broker Industry Revenue (Million) Forecast, by Application 2020 & 2033
Frequently Asked Questions
1. What is the projected Compound Annual Growth Rate (CAGR) of the US FTL Broker Industry?
The projected CAGR is approximately 7.86%.
2. Which companies are prominent players in the US FTL Broker Industry?
Key companies in the market include Suntecktts, Coyote Logistics, Total Quality Logistics, Transplace**List Not Exhaustive, Hub Group, Landstar System Inc, CH Robinson, BNSF Logistics LLC, XPO Logistics Inc, Worldwide Express, Schneider, Echo Global Logistics, J B Hunt Transport Inc, Kag Logistics Inc, Globaltranz.
3. What are the main segments of the US FTL Broker Industry?
The market segments include End User.
4. Can you provide details about the market size?
The market size is estimated to be USD 15.68 Million as of 2022.
5. What are some drivers contributing to market growth?
4.; Increasing demand for efficient transportation4.; Growing eCommerce industry.
6. What are the notable trends driving market growth?
Fluctuating Fuel prices Hampering the Growth of the Market.
7. Are there any restraints impacting market growth?
4.; Intense competition affecting the market4.; Fluctuating fuel prices.
8. Can you provide examples of recent developments in the market?
Sept 2023: Rhenus continues its growth trajectory with the strategic acquisition of the Hungarian freight forwarder ITS Logistics Hungary KFT. This move will enable them to better serve their customer's needs, particularly in relation to air freight services, while also expanding their reach in the Hungarian market.
9. What pricing options are available for accessing the report?
Pricing options include single-user, multi-user, and enterprise licenses priced at USD 3800, USD 4500, and USD 5800 respectively.
10. Is the market size provided in terms of value or volume?
The market size is provided in terms of value, measured in Million.
11. Are there any specific market keywords associated with the report?
Yes, the market keyword associated with the report is "US FTL Broker Industry," which aids in identifying and referencing the specific market segment covered.
12. How do I determine which pricing option suits my needs best?
The pricing options vary based on user requirements and access needs. Individual users may opt for single-user licenses, while businesses requiring broader access may choose multi-user or enterprise licenses for cost-effective access to the report.
13. Are there any additional resources or data provided in the US FTL Broker Industry report?
While the report offers comprehensive insights, it's advisable to review the specific contents or supplementary materials provided to ascertain if additional resources or data are available.
14. How can I stay updated on further developments or reports in the US FTL Broker Industry?
To stay informed about further developments, trends, and reports in the US FTL Broker Industry, consider subscribing to industry newsletters, following relevant companies and organizations, or regularly checking reputable industry news sources and publications.
Methodology
Step 1 - Identification of Relevant Samples Size from Population Database


Step 2 - Approaches for Defining Global Market Size (Value, Volume* & Price*)

Note*: In applicable scenarios
Step 3 - Data Sources
Primary Research
- Web Analytics
- Survey Reports
- Research Institute
- Latest Research Reports
- Opinion Leaders
Secondary Research
- Annual Reports
- White Paper
- Latest Press Release
- Industry Association
- Paid Database
- Investor Presentations

Step 4 - Data Triangulation
Involves using different sources of information in order to increase the validity of a study
These sources are likely to be stakeholders in a program - participants, other researchers, program staff, other community members, and so on.
Then we put all data in single framework & apply various statistical tools to find out the dynamic on the market.
During the analysis stage, feedback from the stakeholder groups would be compared to determine areas of agreement as well as areas of divergence