

Key Insights
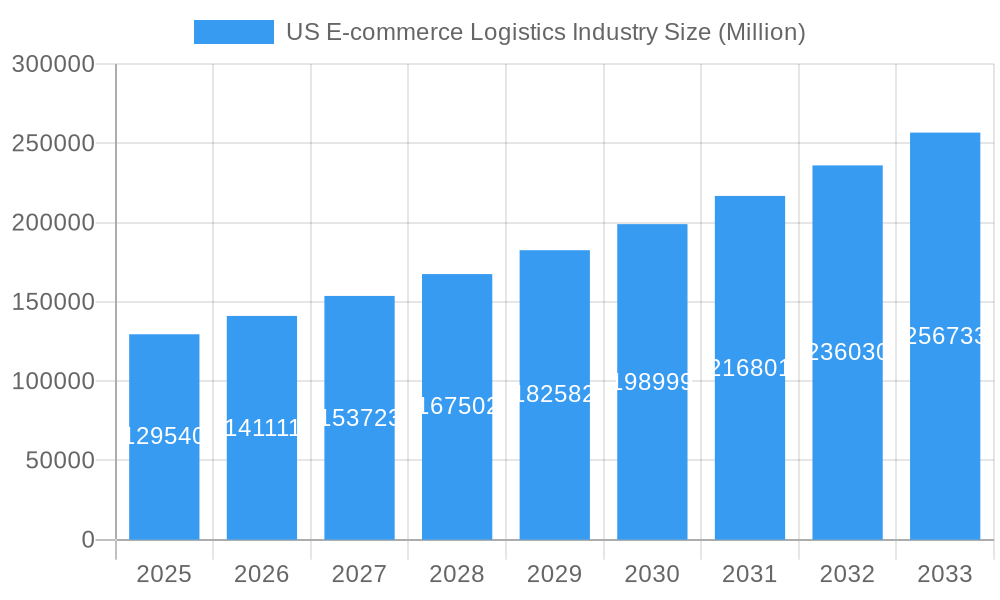
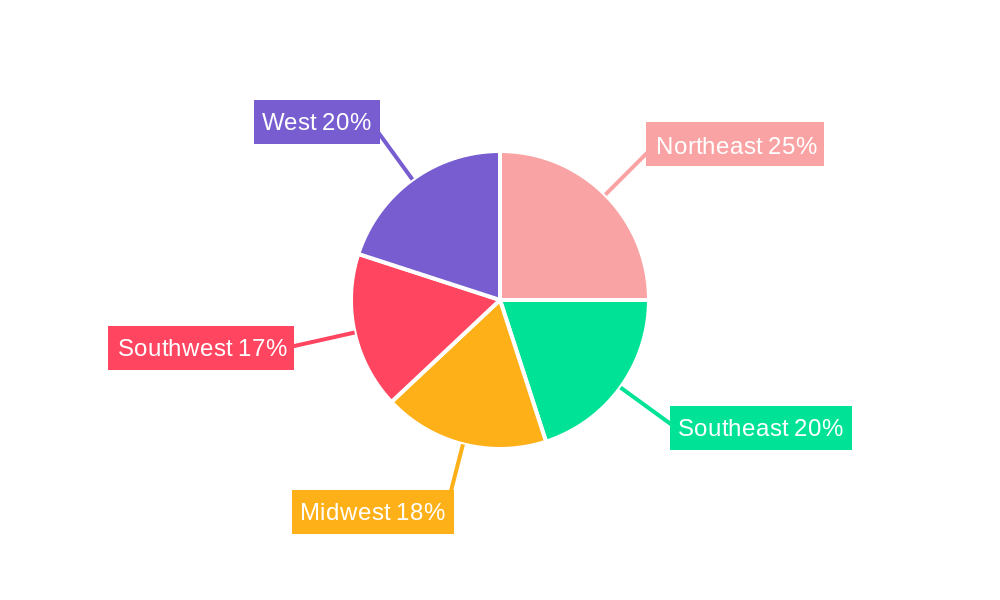
The US e-commerce logistics industry is experiencing robust growth, projected to reach a market size of $129.54 billion in 2025 and maintain a Compound Annual Growth Rate (CAGR) of 8.90% from 2025 to 2033. This expansion is driven by several key factors. The surge in online shopping, fueled by increased internet penetration and consumer preference for convenience, is a primary driver. Furthermore, advancements in technology, such as automated warehousing systems, sophisticated route optimization software, and last-mile delivery innovations, are significantly improving efficiency and reducing costs. The rising demand for faster and more reliable delivery options, including same-day and next-day delivery services, is also contributing to market growth. The industry’s segmentation reflects diverse needs, with B2C dominating, but B2B showing significant growth potential. Product segments like fashion and apparel, consumer electronics, and home appliances are major contributors to market volume, while the "other products" segment, encompassing toys and food, exhibits considerable growth opportunities. Regional variations are also evident, with the Northeast, West, and Southwest likely exhibiting higher growth rates due to higher population density and e-commerce adoption rates. Challenges remain, including rising labor costs, infrastructure limitations, particularly in last-mile delivery, and the increasing complexity of managing returns.
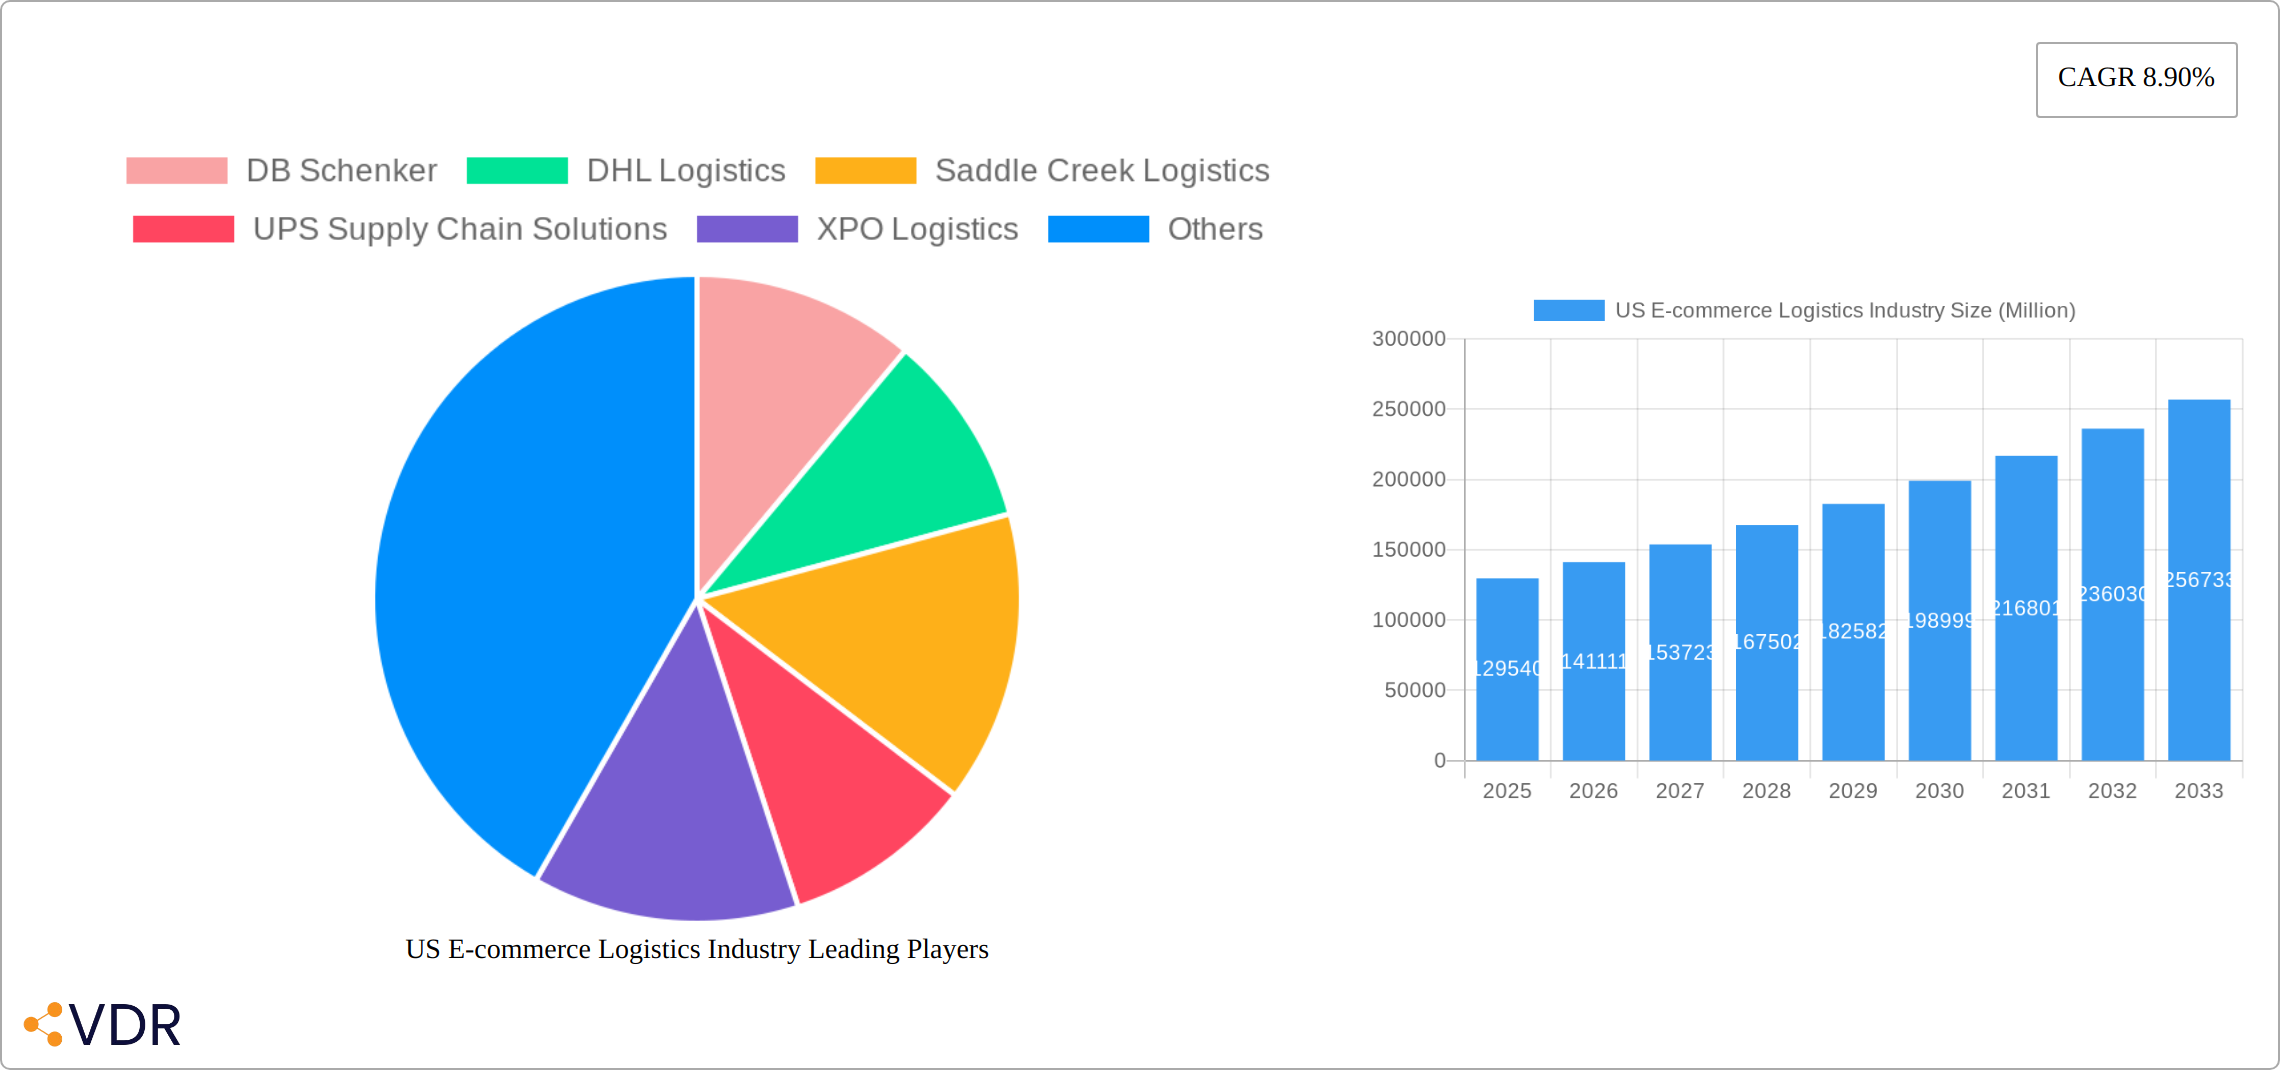
US E-commerce Logistics Industry Market Size (In Billion)
To maintain this momentum, logistics providers need to continuously invest in technological upgrades, optimize their supply chain networks, and adapt to evolving consumer expectations. Focusing on sustainable practices, including reducing carbon footprints and improving packaging efficiency, is also becoming increasingly crucial to attract environmentally conscious consumers and businesses. Strategic partnerships with retailers, leveraging data analytics for improved forecasting and inventory management, and expanding into niche areas like specialized handling for fragile or temperature-sensitive goods will be key to future success in this competitive yet rapidly expanding market. The competitive landscape is populated by major players like DHL, FedEx, UPS, and others, leading to intense competition, particularly in pricing and service offerings.
US E-commerce Logistics Industry Company Market Share
US E-commerce Logistics Industry Market Report: 2019-2033
This comprehensive report provides an in-depth analysis of the US e-commerce logistics industry, covering market dynamics, growth trends, key players, and future outlook. With a focus on parent and child markets, this report is an essential resource for industry professionals, investors, and strategic decision-makers. The study period spans 2019-2033, with 2025 as the base and estimated year.
Study Period: 2019-2033 Base Year: 2025 Estimated Year: 2025 Forecast Period: 2025-2033 Historical Period: 2019-2024
US E-commerce Logistics Industry Market Dynamics & Structure
The US e-commerce logistics market, a dynamic and rapidly evolving sector, is projected to reach a substantial value in 2024, driven by the ever-increasing adoption of online shopping. This market is characterized by a robust competitive landscape, featuring both established industry giants and agile emerging players vying for market share. While a moderate level of concentration exists, with a few key companies holding significant influence, a multitude of smaller enterprises successfully cater to specialized niche segments. At the forefront of this transformation is technological innovation, with advancements in automation, artificial intelligence (AI), and sophisticated data analytics acting as powerful catalysts for enhanced operational efficiency and cost optimization. Navigating this complex environment requires strict adherence to stringent regulatory frameworks, encompassing crucial areas such as transportation safety standards and evolving data privacy laws, which significantly shape operational strategies. The market also faces dynamic challenges from competitive product substitutes, including innovative alternative delivery models and the rise of crowd-sourced logistics, which are increasingly disrupting traditional fulfillment paradigms. Furthermore, shifting end-user demographics, dominated by younger, digitally native consumers, are setting a new benchmark for expectations, demanding faster, more seamless, and highly personalized delivery experiences. The industry is also witnessing significant consolidation through frequent mergers and acquisitions (M&A) activity, a trend fueled by the pursuit of economies of scale and the strategic acquisition of cutting-edge technological capabilities. The total value of M&A deals in 2024 was estimated at substantial figures, underscoring the active restructuring and growth within the sector.
- Market Concentration: Moderate to high concentration, with the top 5 players estimated to command approximately xx% of the market share in 2024.
- Technological Innovation: Integral to success, with widespread adoption of advanced automation (including robotics and AI-powered systems), predictive data analytics for demand forecasting and route optimization, and comprehensive real-time tracking solutions.
- Regulatory Frameworks: Critical for operational integrity, requiring diligent compliance with federal and state transportation regulations (e.g., FMCSA guidelines) and robust adherence to data privacy and consumer protection laws (e.g., CCPA, GDPR principles where applicable).
- Competitive Substitutes: A growing ecosystem of alternative delivery models, including the rapid expansion of drone delivery, autonomous vehicle trials, and the increasingly prevalent use of crowd-sourced delivery platforms, are reshaping last-mile logistics.
- End-User Demographics: A definitive shift towards a younger demographic, characterized by digital fluency and an insatiable appetite for instant gratification, demanding lightning-fast, transparent, and friction-free delivery experiences.
- M&A Trends: Ongoing consolidation through strategic acquisitions remains a dominant theme, as companies seek to broaden their service offerings, expand geographical reach, and integrate advanced technologies to maintain a competitive edge.
US E-commerce Logistics Industry Growth Trends & Insights
The US e-commerce logistics market has experienced robust growth, driven by the explosive expansion of online retail. From 2019 to 2024, the market exhibited a Compound Annual Growth Rate (CAGR) of xx%, reaching xx million in 2024. This growth is fueled by several factors, including increasing internet penetration, rising disposable incomes, and the growing preference for online shopping among diverse consumer segments. Technological disruptions, such as the rise of e-commerce fulfillment centers and last-mile delivery optimization solutions, have significantly improved efficiency and speed. Changing consumer behaviors, such as the demand for same-day and next-day delivery, are pushing logistics providers to adopt innovative solutions and enhance their capabilities. The market is expected to continue its upward trajectory, with a projected CAGR of xx% from 2025 to 2033, reaching an estimated value of xx million by 2033. Market penetration rates for various e-commerce logistics services are also increasing steadily.
Dominant Regions, Countries, or Segments in US E-commerce Logistics Industry
The US e-commerce logistics landscape is a tapestry of geographically diverse operations, each exhibiting distinct growth trajectories and market share dynamics. However, the most pronounced growth and highest operational density are consistently observed in densely populated metropolitan areas. These urban hubs benefit immensely from a concentrated consumer base and highly developed logistical infrastructure, facilitating efficient product movement and timely deliveries. A granular analysis by segment reveals the Business-to-Consumer (B2C) segment as the primary engine of growth, driven by the explosive expansion of direct-to-consumer e-commerce. While the Business-to-Business (B2B) segment continues its steady ascent, B2C remains the dominant force. In terms of services, Warehousing and Inventory Management commands the largest market share, a testament to the fundamental need for sophisticated storage solutions, precise inventory control, and efficient order fulfillment processes. Within product categories, Fashion and Apparel and Consumer Electronics consistently emerge as the leading segments, reflecting their enduring popularity and high volume of online purchases. Furthermore, Domestic shipments represent the larger portion of market activity, significantly outpacing International/cross-border movements. Nevertheless, the cross-border segment is experiencing remarkable, accelerated growth, propelled by continuous improvements in international shipping infrastructure and the expanding global reach of e-commerce platforms.
- Key Drivers: Sustained robust e-commerce growth, ongoing urbanization trends, significant investments in modern logistics infrastructure, and the relentless pace of technological advancements are key accelerators.
- Dominant Segments: B2C transactions, comprehensive Warehousing and Inventory Management solutions, the high-volume Fashion and Apparel sector, the technologically driven Consumer Electronics market, and the expansive Domestic shipment network.
US E-commerce Logistics Industry Product Landscape
The e-commerce logistics industry is a hotbed of continuous product innovation, with a singular focus on elevating operational efficiency, aggressively reducing costs, and curating exceptional customer experiences. This relentless pursuit of improvement manifests in cutting-edge advancements across a spectrum of offerings. Innovations in warehouse automation, from robotic picking systems to intelligent sorting mechanisms, are transforming fulfillment centers. Sophisticated route optimization software is enabling smarter, more efficient delivery pathways, minimizing transit times and fuel consumption. Real-time tracking systems provide unparalleled transparency for both businesses and consumers, fostering trust and reducing inquiries. Furthermore, a growing emphasis is placed on developing and implementing environmentally friendly delivery solutions, addressing sustainability concerns. Unique selling propositions are increasingly defined by a combination of speed, unwavering reliability, competitive cost-effectiveness, and a high degree of technological sophistication. The pervasive integration of Artificial Intelligence (AI) and machine learning is revolutionizing warehouse operations, enabling predictive maintenance, optimizing labor allocation, and fine-tuning inventory management, while simultaneously transforming delivery route planning for maximum efficiency and enhanced customer satisfaction.
Key Drivers, Barriers & Challenges in US E-commerce Logistics Industry
Key Drivers: The expansion of e-commerce, the growth of omnichannel retail, technological advancements in automation and data analytics, and government initiatives to improve infrastructure.
Challenges and Restraints: Labor shortages, rising fuel costs, increased competition, regulatory complexities, and the need for continuous investments in technology to stay competitive. These factors can impact delivery times, increase operational costs, and limit scalability. For example, the labor shortage is estimated to have added xx million in operational costs in 2024 for the sector.
Emerging Opportunities in US E-commerce Logistics Industry
Emerging opportunities include the growth of specialized logistics solutions for niche markets (e.g., healthcare, perishable goods), the adoption of sustainable delivery practices, and the expansion into underserved regions. The increasing demand for hyperlocal delivery and the integration of drone technology present further opportunities for growth and innovation. The development of robust e-commerce logistics infrastructure in less-developed areas, along with the advancement of AI-powered predictive analytics to optimize warehouse operations, are also promising avenues for market expansion.
Growth Accelerators in the US E-commerce Logistics Industry
The trajectory of sustained long-term growth for the US e-commerce logistics industry is intrinsically linked to the ongoing evolution and widespread adoption of advanced technologies. Key among these are continued breakthroughs in automation, the pervasive integration of Artificial Intelligence (AI) for predictive analytics and operational optimization, and the sophisticated utilization of big data to inform strategic decision-making. Furthermore, the cultivation of strong, symbiotic strategic partnerships between logistics providers and e-commerce retailers will serve as a significant engine for growth, fostering collaborative innovation and optimizing the entire supply chain. The strategic expansion into untapped markets, particularly in underserved rural areas, presents a substantial opportunity. Concurrently, the pioneering development and widespread implementation of innovative last-mile delivery solutions, such as drone delivery networks and autonomous vehicle fleets, are poised to be crucial catalysts, unlocking new efficiencies and expanding delivery capabilities to reach a broader customer base.
Key Players Shaping the US E-commerce Logistics Industry Market
- DB Schenker
- DHL Logistics
- Saddle Creek Logistics Services
- UPS Supply Chain Solutions
- XPO Logistics
- Rakuten Super Logistics
- FedEx Corporation
- Geodis Logistics
- Kenco Logistics Services
- Kuehne and Nagel Logistics (Please note: This list is representative and not exhaustive of all significant market participants.)
Notable Milestones in US E-commerce Logistics Industry Sector
- August 2023: DHL eCommerce opens a new 352,000 sq ft distribution center in Melrose Park, Illinois, equipped with an automated sorter capable of handling 40,000 parcels per hour. This represents a significant expansion of DHL's capacity within the US market.
- April 2023: DHL Express launches GoGreen Plus, expanding sustainable shipping options for US SMEs and emphasizing a commitment to environmentally responsible logistics.
In-Depth US E-commerce Logistics Industry Market Outlook
The future of the US e-commerce logistics market appears bright, with continued growth driven by technological innovation and evolving consumer expectations. Strategic partnerships, investments in infrastructure, and the adoption of sustainable practices will play pivotal roles in shaping the industry's future landscape. The market is ripe with opportunities for both established players and new entrants, particularly in the areas of automation, last-mile delivery, and specialized logistics solutions. The forecast period indicates strong growth potential, suggesting significant investment and expansion opportunities for businesses within the sector.
US E-commerce Logistics Industry Segmentation
-
1. Service
- 1.1. Transportation
- 1.2. Warehousing and Inventory management
- 1.3. Value-added services (Labeling, Packaging, etc)
-
2. Business
- 2.1. B2B
- 2.2. B2C
-
3. Destination
- 3.1. Domestic
- 3.2. International/cross-border
-
4. Product
- 4.1. Fashion and Apparel
- 4.2. Consumer Electronics
- 4.3. Home Appliances
- 4.4. Furniture
- 4.5. Beauty and Personal Care Products
- 4.6. Other Products (Toys, Food Products, etc.)
US E-commerce Logistics Industry Segmentation By Geography
-
1. North America
- 1.1. United States
- 1.2. Canada
- 1.3. Mexico
-
2. South America
- 2.1. Brazil
- 2.2. Argentina
- 2.3. Rest of South America
-
3. Europe
- 3.1. United Kingdom
- 3.2. Germany
- 3.3. France
- 3.4. Italy
- 3.5. Spain
- 3.6. Russia
- 3.7. Benelux
- 3.8. Nordics
- 3.9. Rest of Europe
-
4. Middle East & Africa
- 4.1. Turkey
- 4.2. Israel
- 4.3. GCC
- 4.4. North Africa
- 4.5. South Africa
- 4.6. Rest of Middle East & Africa
-
5. Asia Pacific
- 5.1. China
- 5.2. India
- 5.3. Japan
- 5.4. South Korea
- 5.5. ASEAN
- 5.6. Oceania
- 5.7. Rest of Asia Pacific
US E-commerce Logistics Industry Regional Market Share
Geographic Coverage of US E-commerce Logistics Industry
US E-commerce Logistics Industry REPORT HIGHLIGHTS
| Aspects | Details |
|---|---|
| Study Period | 2020-2034 |
| Base Year | 2025 |
| Estimated Year | 2026 |
| Forecast Period | 2026-2034 |
| Historical Period | 2020-2025 |
| Growth Rate | CAGR of 8.90% from 2020-2034 |
| Segmentation |
|
Table of Contents
- 1. Introduction
- 1.1. Research Scope
- 1.2. Market Segmentation
- 1.3. Research Objective
- 1.4. Definitions and Assumptions
- 2. Executive Summary
- 2.1. Market Snapshot
- 3. Market Dynamics
- 3.1. Market Drivers
- 3.2. Market Restrains
- 3.3. Market Trends
- 3.4. Market Opportunities
- 4. Market Factor Analysis
- 4.1. Porters Five Forces
- 4.1.1. Bargaining Power of Suppliers
- 4.1.2. Bargaining Power of Buyers
- 4.1.3. Threat of New Entrants
- 4.1.4. Threat of Substitutes
- 4.1.5. Competitive Rivalry
- 4.2. PESTEL analysis
- 4.3. BCG Analysis
- 4.3.1. Stars (High Growth, High Market Share)
- 4.3.2. Cash Cows (Low Growth, High Market Share)
- 4.3.3. Question Mark (High Growth, Low Market Share)
- 4.3.4. Dogs (Low Growth, Low Market Share)
- 4.4. Ansoff Matrix Analysis
- 4.5. Supply Chain Analysis
- 4.6. Regulatory Landscape
- 4.7. Current Market Potential and Opportunity Assessment (TAM–SAM–SOM Framework)
- 4.8. VDR Analyst Note
- 4.1. Porters Five Forces
- 5. Market Analysis, Insights and Forecast 2021-2033
- 5.1. Market Analysis, Insights and Forecast - by Service
- 5.1.1. Transportation
- 5.1.2. Warehousing and Inventory management
- 5.1.3. Value-added services (Labeling, Packaging, etc)
- 5.2. Market Analysis, Insights and Forecast - by Business
- 5.2.1. B2B
- 5.2.2. B2C
- 5.3. Market Analysis, Insights and Forecast - by Destination
- 5.3.1. Domestic
- 5.3.2. International/cross-border
- 5.4. Market Analysis, Insights and Forecast - by Product
- 5.4.1. Fashion and Apparel
- 5.4.2. Consumer Electronics
- 5.4.3. Home Appliances
- 5.4.4. Furniture
- 5.4.5. Beauty and Personal Care Products
- 5.4.6. Other Products (Toys, Food Products, etc.)
- 5.5. Market Analysis, Insights and Forecast - by Region
- 5.5.1. North America
- 5.5.2. South America
- 5.5.3. Europe
- 5.5.4. Middle East & Africa
- 5.5.5. Asia Pacific
- 5.1. Market Analysis, Insights and Forecast - by Service
- 6. Global US E-commerce Logistics Industry Analysis, Insights and Forecast, 2021-2033
- 6.1. Market Analysis, Insights and Forecast - by Service
- 6.1.1. Transportation
- 6.1.2. Warehousing and Inventory management
- 6.1.3. Value-added services (Labeling, Packaging, etc)
- 6.2. Market Analysis, Insights and Forecast - by Business
- 6.2.1. B2B
- 6.2.2. B2C
- 6.3. Market Analysis, Insights and Forecast - by Destination
- 6.3.1. Domestic
- 6.3.2. International/cross-border
- 6.4. Market Analysis, Insights and Forecast - by Product
- 6.4.1. Fashion and Apparel
- 6.4.2. Consumer Electronics
- 6.4.3. Home Appliances
- 6.4.4. Furniture
- 6.4.5. Beauty and Personal Care Products
- 6.4.6. Other Products (Toys, Food Products, etc.)
- 6.1. Market Analysis, Insights and Forecast - by Service
- 7. North America US E-commerce Logistics Industry Analysis, Insights and Forecast, 2021-2033
- 7.1. Market Analysis, Insights and Forecast - by Service
- 7.1.1. Transportation
- 7.1.2. Warehousing and Inventory management
- 7.1.3. Value-added services (Labeling, Packaging, etc)
- 7.2. Market Analysis, Insights and Forecast - by Business
- 7.2.1. B2B
- 7.2.2. B2C
- 7.3. Market Analysis, Insights and Forecast - by Destination
- 7.3.1. Domestic
- 7.3.2. International/cross-border
- 7.4. Market Analysis, Insights and Forecast - by Product
- 7.4.1. Fashion and Apparel
- 7.4.2. Consumer Electronics
- 7.4.3. Home Appliances
- 7.4.4. Furniture
- 7.4.5. Beauty and Personal Care Products
- 7.4.6. Other Products (Toys, Food Products, etc.)
- 7.1. Market Analysis, Insights and Forecast - by Service
- 8. South America US E-commerce Logistics Industry Analysis, Insights and Forecast, 2021-2033
- 8.1. Market Analysis, Insights and Forecast - by Service
- 8.1.1. Transportation
- 8.1.2. Warehousing and Inventory management
- 8.1.3. Value-added services (Labeling, Packaging, etc)
- 8.2. Market Analysis, Insights and Forecast - by Business
- 8.2.1. B2B
- 8.2.2. B2C
- 8.3. Market Analysis, Insights and Forecast - by Destination
- 8.3.1. Domestic
- 8.3.2. International/cross-border
- 8.4. Market Analysis, Insights and Forecast - by Product
- 8.4.1. Fashion and Apparel
- 8.4.2. Consumer Electronics
- 8.4.3. Home Appliances
- 8.4.4. Furniture
- 8.4.5. Beauty and Personal Care Products
- 8.4.6. Other Products (Toys, Food Products, etc.)
- 8.1. Market Analysis, Insights and Forecast - by Service
- 9. Europe US E-commerce Logistics Industry Analysis, Insights and Forecast, 2021-2033
- 9.1. Market Analysis, Insights and Forecast - by Service
- 9.1.1. Transportation
- 9.1.2. Warehousing and Inventory management
- 9.1.3. Value-added services (Labeling, Packaging, etc)
- 9.2. Market Analysis, Insights and Forecast - by Business
- 9.2.1. B2B
- 9.2.2. B2C
- 9.3. Market Analysis, Insights and Forecast - by Destination
- 9.3.1. Domestic
- 9.3.2. International/cross-border
- 9.4. Market Analysis, Insights and Forecast - by Product
- 9.4.1. Fashion and Apparel
- 9.4.2. Consumer Electronics
- 9.4.3. Home Appliances
- 9.4.4. Furniture
- 9.4.5. Beauty and Personal Care Products
- 9.4.6. Other Products (Toys, Food Products, etc.)
- 9.1. Market Analysis, Insights and Forecast - by Service
- 10. Middle East & Africa US E-commerce Logistics Industry Analysis, Insights and Forecast, 2021-2033
- 10.1. Market Analysis, Insights and Forecast - by Service
- 10.1.1. Transportation
- 10.1.2. Warehousing and Inventory management
- 10.1.3. Value-added services (Labeling, Packaging, etc)
- 10.2. Market Analysis, Insights and Forecast - by Business
- 10.2.1. B2B
- 10.2.2. B2C
- 10.3. Market Analysis, Insights and Forecast - by Destination
- 10.3.1. Domestic
- 10.3.2. International/cross-border
- 10.4. Market Analysis, Insights and Forecast - by Product
- 10.4.1. Fashion and Apparel
- 10.4.2. Consumer Electronics
- 10.4.3. Home Appliances
- 10.4.4. Furniture
- 10.4.5. Beauty and Personal Care Products
- 10.4.6. Other Products (Toys, Food Products, etc.)
- 10.1. Market Analysis, Insights and Forecast - by Service
- 11. Asia Pacific US E-commerce Logistics Industry Analysis, Insights and Forecast, 2021-2033
- 11.1. Market Analysis, Insights and Forecast - by Service
- 11.1.1. Transportation
- 11.1.2. Warehousing and Inventory management
- 11.1.3. Value-added services (Labeling, Packaging, etc)
- 11.2. Market Analysis, Insights and Forecast - by Business
- 11.2.1. B2B
- 11.2.2. B2C
- 11.3. Market Analysis, Insights and Forecast - by Destination
- 11.3.1. Domestic
- 11.3.2. International/cross-border
- 11.4. Market Analysis, Insights and Forecast - by Product
- 11.4.1. Fashion and Apparel
- 11.4.2. Consumer Electronics
- 11.4.3. Home Appliances
- 11.4.4. Furniture
- 11.4.5. Beauty and Personal Care Products
- 11.4.6. Other Products (Toys, Food Products, etc.)
- 11.1. Market Analysis, Insights and Forecast - by Service
- 12. Competitive Analysis
- 12.1. Company Profiles
- 12.1.1 DB Schenker
- 12.1.1.1. Company Overview
- 12.1.1.2. Products
- 12.1.1.3. Company Financials
- 12.1.1.4. SWOT Analysis
- 12.1.2 DHL Logistics
- 12.1.2.1. Company Overview
- 12.1.2.2. Products
- 12.1.2.3. Company Financials
- 12.1.2.4. SWOT Analysis
- 12.1.3 Saddle Creek Logistics
- 12.1.3.1. Company Overview
- 12.1.3.2. Products
- 12.1.3.3. Company Financials
- 12.1.3.4. SWOT Analysis
- 12.1.4 UPS Supply Chain Solutions
- 12.1.4.1. Company Overview
- 12.1.4.2. Products
- 12.1.4.3. Company Financials
- 12.1.4.4. SWOT Analysis
- 12.1.5 XPO Logistics
- 12.1.5.1. Company Overview
- 12.1.5.2. Products
- 12.1.5.3. Company Financials
- 12.1.5.4. SWOT Analysis
- 12.1.6 Rakuten Super Logistics
- 12.1.6.1. Company Overview
- 12.1.6.2. Products
- 12.1.6.3. Company Financials
- 12.1.6.4. SWOT Analysis
- 12.1.7 FedEx
- 12.1.7.1. Company Overview
- 12.1.7.2. Products
- 12.1.7.3. Company Financials
- 12.1.7.4. SWOT Analysis
- 12.1.8 Geodis Logistics
- 12.1.8.1. Company Overview
- 12.1.8.2. Products
- 12.1.8.3. Company Financials
- 12.1.8.4. SWOT Analysis
- 12.1.9 Kenco Logistics Services
- 12.1.9.1. Company Overview
- 12.1.9.2. Products
- 12.1.9.3. Company Financials
- 12.1.9.4. SWOT Analysis
- 12.1.10 Kuehne and Nagel Logistics**List Not Exhaustive
- 12.1.10.1. Company Overview
- 12.1.10.2. Products
- 12.1.10.3. Company Financials
- 12.1.10.4. SWOT Analysis
- 12.1.1 DB Schenker
- 12.2. Market Entropy
- 12.2.1 Company's Key Areas Served
- 12.2.2 Recent Developments
- 12.3. Company Market Share Analysis 2025
- 12.3.1 Top 5 Companies Market Share Analysis
- 12.3.2 Top 3 Companies Market Share Analysis
- 12.4. List of Potential Customers
- 13. Research Methodology
List of Figures
- Figure 1: Global US E-commerce Logistics Industry Revenue Breakdown (Million, %) by Region 2025 & 2033
- Figure 2: North America US E-commerce Logistics Industry Revenue (Million), by Service 2025 & 2033
- Figure 3: North America US E-commerce Logistics Industry Revenue Share (%), by Service 2025 & 2033
- Figure 4: North America US E-commerce Logistics Industry Revenue (Million), by Business 2025 & 2033
- Figure 5: North America US E-commerce Logistics Industry Revenue Share (%), by Business 2025 & 2033
- Figure 6: North America US E-commerce Logistics Industry Revenue (Million), by Destination 2025 & 2033
- Figure 7: North America US E-commerce Logistics Industry Revenue Share (%), by Destination 2025 & 2033
- Figure 8: North America US E-commerce Logistics Industry Revenue (Million), by Product 2025 & 2033
- Figure 9: North America US E-commerce Logistics Industry Revenue Share (%), by Product 2025 & 2033
- Figure 10: North America US E-commerce Logistics Industry Revenue (Million), by Country 2025 & 2033
- Figure 11: North America US E-commerce Logistics Industry Revenue Share (%), by Country 2025 & 2033
- Figure 12: South America US E-commerce Logistics Industry Revenue (Million), by Service 2025 & 2033
- Figure 13: South America US E-commerce Logistics Industry Revenue Share (%), by Service 2025 & 2033
- Figure 14: South America US E-commerce Logistics Industry Revenue (Million), by Business 2025 & 2033
- Figure 15: South America US E-commerce Logistics Industry Revenue Share (%), by Business 2025 & 2033
- Figure 16: South America US E-commerce Logistics Industry Revenue (Million), by Destination 2025 & 2033
- Figure 17: South America US E-commerce Logistics Industry Revenue Share (%), by Destination 2025 & 2033
- Figure 18: South America US E-commerce Logistics Industry Revenue (Million), by Product 2025 & 2033
- Figure 19: South America US E-commerce Logistics Industry Revenue Share (%), by Product 2025 & 2033
- Figure 20: South America US E-commerce Logistics Industry Revenue (Million), by Country 2025 & 2033
- Figure 21: South America US E-commerce Logistics Industry Revenue Share (%), by Country 2025 & 2033
- Figure 22: Europe US E-commerce Logistics Industry Revenue (Million), by Service 2025 & 2033
- Figure 23: Europe US E-commerce Logistics Industry Revenue Share (%), by Service 2025 & 2033
- Figure 24: Europe US E-commerce Logistics Industry Revenue (Million), by Business 2025 & 2033
- Figure 25: Europe US E-commerce Logistics Industry Revenue Share (%), by Business 2025 & 2033
- Figure 26: Europe US E-commerce Logistics Industry Revenue (Million), by Destination 2025 & 2033
- Figure 27: Europe US E-commerce Logistics Industry Revenue Share (%), by Destination 2025 & 2033
- Figure 28: Europe US E-commerce Logistics Industry Revenue (Million), by Product 2025 & 2033
- Figure 29: Europe US E-commerce Logistics Industry Revenue Share (%), by Product 2025 & 2033
- Figure 30: Europe US E-commerce Logistics Industry Revenue (Million), by Country 2025 & 2033
- Figure 31: Europe US E-commerce Logistics Industry Revenue Share (%), by Country 2025 & 2033
- Figure 32: Middle East & Africa US E-commerce Logistics Industry Revenue (Million), by Service 2025 & 2033
- Figure 33: Middle East & Africa US E-commerce Logistics Industry Revenue Share (%), by Service 2025 & 2033
- Figure 34: Middle East & Africa US E-commerce Logistics Industry Revenue (Million), by Business 2025 & 2033
- Figure 35: Middle East & Africa US E-commerce Logistics Industry Revenue Share (%), by Business 2025 & 2033
- Figure 36: Middle East & Africa US E-commerce Logistics Industry Revenue (Million), by Destination 2025 & 2033
- Figure 37: Middle East & Africa US E-commerce Logistics Industry Revenue Share (%), by Destination 2025 & 2033
- Figure 38: Middle East & Africa US E-commerce Logistics Industry Revenue (Million), by Product 2025 & 2033
- Figure 39: Middle East & Africa US E-commerce Logistics Industry Revenue Share (%), by Product 2025 & 2033
- Figure 40: Middle East & Africa US E-commerce Logistics Industry Revenue (Million), by Country 2025 & 2033
- Figure 41: Middle East & Africa US E-commerce Logistics Industry Revenue Share (%), by Country 2025 & 2033
- Figure 42: Asia Pacific US E-commerce Logistics Industry Revenue (Million), by Service 2025 & 2033
- Figure 43: Asia Pacific US E-commerce Logistics Industry Revenue Share (%), by Service 2025 & 2033
- Figure 44: Asia Pacific US E-commerce Logistics Industry Revenue (Million), by Business 2025 & 2033
- Figure 45: Asia Pacific US E-commerce Logistics Industry Revenue Share (%), by Business 2025 & 2033
- Figure 46: Asia Pacific US E-commerce Logistics Industry Revenue (Million), by Destination 2025 & 2033
- Figure 47: Asia Pacific US E-commerce Logistics Industry Revenue Share (%), by Destination 2025 & 2033
- Figure 48: Asia Pacific US E-commerce Logistics Industry Revenue (Million), by Product 2025 & 2033
- Figure 49: Asia Pacific US E-commerce Logistics Industry Revenue Share (%), by Product 2025 & 2033
- Figure 50: Asia Pacific US E-commerce Logistics Industry Revenue (Million), by Country 2025 & 2033
- Figure 51: Asia Pacific US E-commerce Logistics Industry Revenue Share (%), by Country 2025 & 2033
List of Tables
- Table 1: Global US E-commerce Logistics Industry Revenue Million Forecast, by Service 2020 & 2033
- Table 2: Global US E-commerce Logistics Industry Revenue Million Forecast, by Business 2020 & 2033
- Table 3: Global US E-commerce Logistics Industry Revenue Million Forecast, by Destination 2020 & 2033
- Table 4: Global US E-commerce Logistics Industry Revenue Million Forecast, by Product 2020 & 2033
- Table 5: Global US E-commerce Logistics Industry Revenue Million Forecast, by Region 2020 & 2033
- Table 6: Global US E-commerce Logistics Industry Revenue Million Forecast, by Service 2020 & 2033
- Table 7: Global US E-commerce Logistics Industry Revenue Million Forecast, by Business 2020 & 2033
- Table 8: Global US E-commerce Logistics Industry Revenue Million Forecast, by Destination 2020 & 2033
- Table 9: Global US E-commerce Logistics Industry Revenue Million Forecast, by Product 2020 & 2033
- Table 10: Global US E-commerce Logistics Industry Revenue Million Forecast, by Country 2020 & 2033
- Table 11: United States US E-commerce Logistics Industry Revenue (Million) Forecast, by Application 2020 & 2033
- Table 12: Canada US E-commerce Logistics Industry Revenue (Million) Forecast, by Application 2020 & 2033
- Table 13: Mexico US E-commerce Logistics Industry Revenue (Million) Forecast, by Application 2020 & 2033
- Table 14: Global US E-commerce Logistics Industry Revenue Million Forecast, by Service 2020 & 2033
- Table 15: Global US E-commerce Logistics Industry Revenue Million Forecast, by Business 2020 & 2033
- Table 16: Global US E-commerce Logistics Industry Revenue Million Forecast, by Destination 2020 & 2033
- Table 17: Global US E-commerce Logistics Industry Revenue Million Forecast, by Product 2020 & 2033
- Table 18: Global US E-commerce Logistics Industry Revenue Million Forecast, by Country 2020 & 2033
- Table 19: Brazil US E-commerce Logistics Industry Revenue (Million) Forecast, by Application 2020 & 2033
- Table 20: Argentina US E-commerce Logistics Industry Revenue (Million) Forecast, by Application 2020 & 2033
- Table 21: Rest of South America US E-commerce Logistics Industry Revenue (Million) Forecast, by Application 2020 & 2033
- Table 22: Global US E-commerce Logistics Industry Revenue Million Forecast, by Service 2020 & 2033
- Table 23: Global US E-commerce Logistics Industry Revenue Million Forecast, by Business 2020 & 2033
- Table 24: Global US E-commerce Logistics Industry Revenue Million Forecast, by Destination 2020 & 2033
- Table 25: Global US E-commerce Logistics Industry Revenue Million Forecast, by Product 2020 & 2033
- Table 26: Global US E-commerce Logistics Industry Revenue Million Forecast, by Country 2020 & 2033
- Table 27: United Kingdom US E-commerce Logistics Industry Revenue (Million) Forecast, by Application 2020 & 2033
- Table 28: Germany US E-commerce Logistics Industry Revenue (Million) Forecast, by Application 2020 & 2033
- Table 29: France US E-commerce Logistics Industry Revenue (Million) Forecast, by Application 2020 & 2033
- Table 30: Italy US E-commerce Logistics Industry Revenue (Million) Forecast, by Application 2020 & 2033
- Table 31: Spain US E-commerce Logistics Industry Revenue (Million) Forecast, by Application 2020 & 2033
- Table 32: Russia US E-commerce Logistics Industry Revenue (Million) Forecast, by Application 2020 & 2033
- Table 33: Benelux US E-commerce Logistics Industry Revenue (Million) Forecast, by Application 2020 & 2033
- Table 34: Nordics US E-commerce Logistics Industry Revenue (Million) Forecast, by Application 2020 & 2033
- Table 35: Rest of Europe US E-commerce Logistics Industry Revenue (Million) Forecast, by Application 2020 & 2033
- Table 36: Global US E-commerce Logistics Industry Revenue Million Forecast, by Service 2020 & 2033
- Table 37: Global US E-commerce Logistics Industry Revenue Million Forecast, by Business 2020 & 2033
- Table 38: Global US E-commerce Logistics Industry Revenue Million Forecast, by Destination 2020 & 2033
- Table 39: Global US E-commerce Logistics Industry Revenue Million Forecast, by Product 2020 & 2033
- Table 40: Global US E-commerce Logistics Industry Revenue Million Forecast, by Country 2020 & 2033
- Table 41: Turkey US E-commerce Logistics Industry Revenue (Million) Forecast, by Application 2020 & 2033
- Table 42: Israel US E-commerce Logistics Industry Revenue (Million) Forecast, by Application 2020 & 2033
- Table 43: GCC US E-commerce Logistics Industry Revenue (Million) Forecast, by Application 2020 & 2033
- Table 44: North Africa US E-commerce Logistics Industry Revenue (Million) Forecast, by Application 2020 & 2033
- Table 45: South Africa US E-commerce Logistics Industry Revenue (Million) Forecast, by Application 2020 & 2033
- Table 46: Rest of Middle East & Africa US E-commerce Logistics Industry Revenue (Million) Forecast, by Application 2020 & 2033
- Table 47: Global US E-commerce Logistics Industry Revenue Million Forecast, by Service 2020 & 2033
- Table 48: Global US E-commerce Logistics Industry Revenue Million Forecast, by Business 2020 & 2033
- Table 49: Global US E-commerce Logistics Industry Revenue Million Forecast, by Destination 2020 & 2033
- Table 50: Global US E-commerce Logistics Industry Revenue Million Forecast, by Product 2020 & 2033
- Table 51: Global US E-commerce Logistics Industry Revenue Million Forecast, by Country 2020 & 2033
- Table 52: China US E-commerce Logistics Industry Revenue (Million) Forecast, by Application 2020 & 2033
- Table 53: India US E-commerce Logistics Industry Revenue (Million) Forecast, by Application 2020 & 2033
- Table 54: Japan US E-commerce Logistics Industry Revenue (Million) Forecast, by Application 2020 & 2033
- Table 55: South Korea US E-commerce Logistics Industry Revenue (Million) Forecast, by Application 2020 & 2033
- Table 56: ASEAN US E-commerce Logistics Industry Revenue (Million) Forecast, by Application 2020 & 2033
- Table 57: Oceania US E-commerce Logistics Industry Revenue (Million) Forecast, by Application 2020 & 2033
- Table 58: Rest of Asia Pacific US E-commerce Logistics Industry Revenue (Million) Forecast, by Application 2020 & 2033
Frequently Asked Questions
1. What is the projected Compound Annual Growth Rate (CAGR) of the US E-commerce Logistics Industry?
The projected CAGR is approximately 8.90%.
2. Which companies are prominent players in the US E-commerce Logistics Industry?
Key companies in the market include DB Schenker, DHL Logistics, Saddle Creek Logistics, UPS Supply Chain Solutions, XPO Logistics, Rakuten Super Logistics, FedEx, Geodis Logistics, Kenco Logistics Services, Kuehne and Nagel Logistics**List Not Exhaustive.
3. What are the main segments of the US E-commerce Logistics Industry?
The market segments include Service, Business, Destination, Product.
4. Can you provide details about the market size?
The market size is estimated to be USD 129.54 Million as of 2022.
5. What are some drivers contributing to market growth?
Rise In Cross Border Logistics; Upgrade e-commerce with new supply chain technology.
6. What are the notable trends driving market growth?
Upgrade e-commerce with new supply chain technology.
7. Are there any restraints impacting market growth?
Supply Chain Disruptions; Warehousing and Inventory management.
8. Can you provide examples of recent developments in the market?
August 2023: A new distribution center has been opened by DHL eCommerce as part of its five-year strategic growth plan. The new facility, located in the city of Melrose Park in Illinois, encompasses a total area of 352,000 square feet. In addition to capacity enhancement, the facility is equipped with an Automated Honeywell Cross-belt Loop Sorter, which is capable of handling up to forty thousand parcels and packages an hour. As part of the logistics provider's recent expansion, 11 warehouses have been constructed or relocated, and seven more are expected to be finished at some point in the near future, as reported by the sources.
9. What pricing options are available for accessing the report?
Pricing options include single-user, multi-user, and enterprise licenses priced at USD 3800, USD 4500, and USD 5800 respectively.
10. Is the market size provided in terms of value or volume?
The market size is provided in terms of value, measured in Million.
11. Are there any specific market keywords associated with the report?
Yes, the market keyword associated with the report is "US E-commerce Logistics Industry," which aids in identifying and referencing the specific market segment covered.
12. How do I determine which pricing option suits my needs best?
The pricing options vary based on user requirements and access needs. Individual users may opt for single-user licenses, while businesses requiring broader access may choose multi-user or enterprise licenses for cost-effective access to the report.
13. Are there any additional resources or data provided in the US E-commerce Logistics Industry report?
While the report offers comprehensive insights, it's advisable to review the specific contents or supplementary materials provided to ascertain if additional resources or data are available.
14. How can I stay updated on further developments or reports in the US E-commerce Logistics Industry?
To stay informed about further developments, trends, and reports in the US E-commerce Logistics Industry, consider subscribing to industry newsletters, following relevant companies and organizations, or regularly checking reputable industry news sources and publications.
Methodology
Step 1 - Identification of Relevant Samples Size from Population Database


Step 2 - Approaches for Defining Global Market Size (Value, Volume* & Price*)

Note*: In applicable scenarios
Step 3 - Data Sources
Primary Research
- Web Analytics
- Survey Reports
- Research Institute
- Latest Research Reports
- Opinion Leaders
Secondary Research
- Annual Reports
- White Paper
- Latest Press Release
- Industry Association
- Paid Database
- Investor Presentations

Step 4 - Data Triangulation
Involves using different sources of information in order to increase the validity of a study
These sources are likely to be stakeholders in a program - participants, other researchers, program staff, other community members, and so on.
Then we put all data in single framework & apply various statistical tools to find out the dynamic on the market.
During the analysis stage, feedback from the stakeholder groups would be compared to determine areas of agreement as well as areas of divergence