

Key Insights
The U.S. Dangerous Goods Logistics Market, covering the compliant transportation, warehousing, distribution, and value-added services for hazardous materials, is projected for substantial expansion. The market size is estimated at $251.13 billion in 2025, with a projected Compound Annual Growth Rate (CAGR) of 7.6% from 2025 to 2033. This growth is primarily driven by the escalating volume of e-commerce, demanding specialized handling of diverse hazardous goods including batteries, chemicals, and pharmaceuticals. Augmenting this trend are increasingly stringent government regulations for the safe transport and storage of dangerous goods, necessitating advanced logistics solutions. The growing demand for temperature-sensitive products, particularly within the healthcare and pharmaceutical industries, also significantly influences market dynamics. Technological advancements in real-time tracking and monitoring systems further enhance supply chain visibility and safety, propelling market growth.
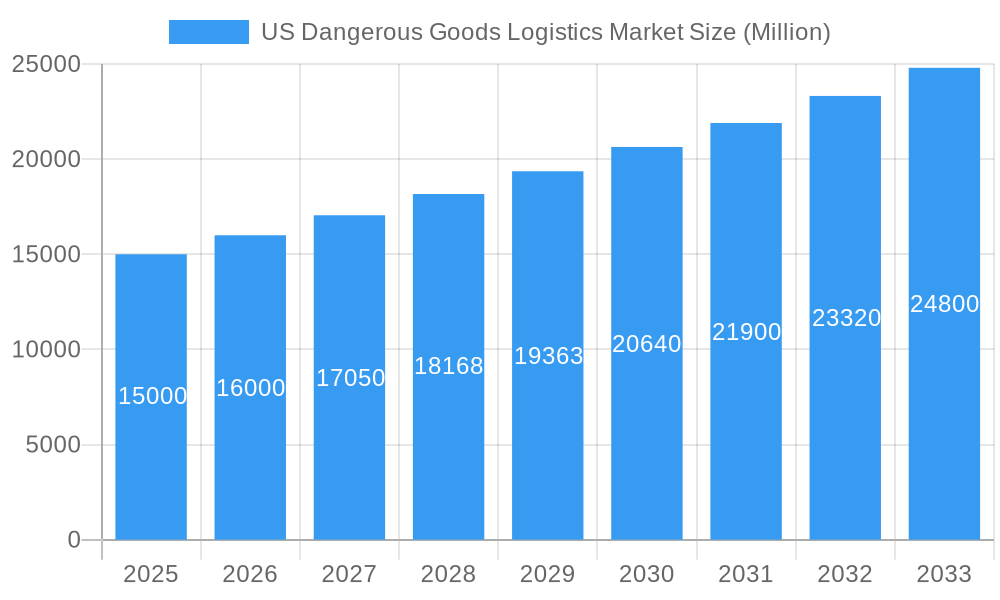
US Dangerous Goods Logistics Market Market Size (In Billion)
The market is segmented by key functions, including transportation, warehousing and distribution, and specialized value-added services such as packaging and customs clearance, alongside freight brokerage. Segmentation by destination distinguishes between domestic and international logistics. While the domestic segment currently commands a larger market share, the international segment is anticipated to experience accelerated growth, fueled by expanding global trade and the continued rise of e-commerce. Leading industry participants, including UPS, FedEx, and DHL, are making significant investments in cutting-edge technologies and infrastructure to meet this surging demand and ensure unwavering compliance with rigorous safety mandates. Geographic segmentation highlights robust activity across all U.S. regions, with growth rates anticipated to vary based on industrial concentration and evolving regulatory environments. The forecast period of 2025-2033 anticipates sustained market expansion driven by the aforementioned factors, though potential economic volatility and unforeseen geopolitical developments may impact market trajectories.
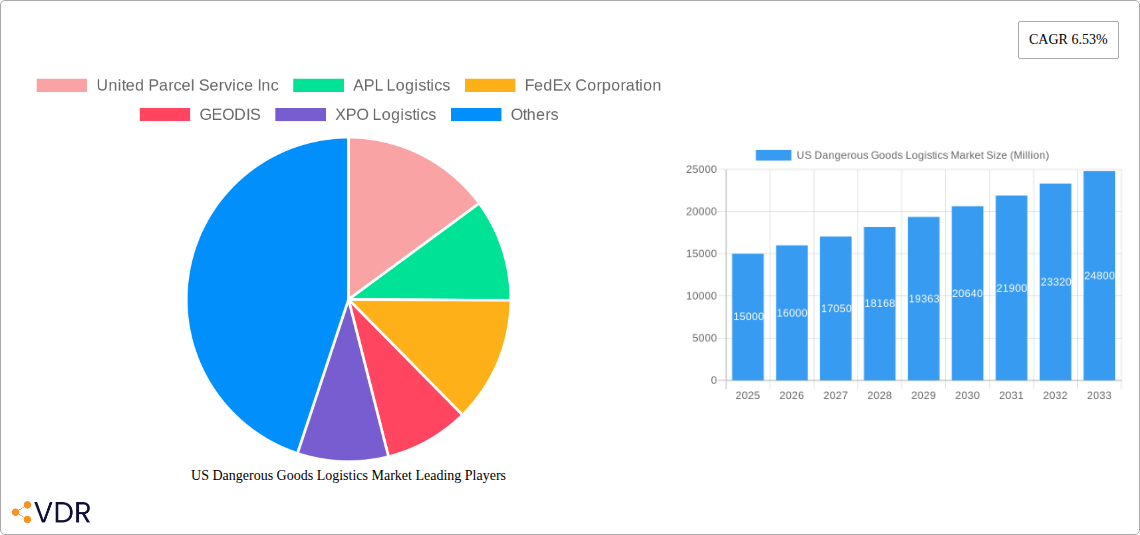
US Dangerous Goods Logistics Market Company Market Share
US Dangerous Goods Logistics Market: A Comprehensive Report (2019-2033)
This comprehensive report provides an in-depth analysis of the US Dangerous Goods Logistics Market, encompassing market size, growth trends, competitive landscape, and future outlook. The study period covers 2019-2033, with a base year of 2025 and a forecast period of 2025-2033. This report is crucial for logistics providers, regulatory bodies, and investors seeking to understand this specialized and critical sector of the US transportation industry. The market is segmented by function (Transportation, Air: Warehousing and Distribution, Value-added Services) and destination (Domestic, International). The total market value in 2025 is estimated at $XX Million.
US Dangerous Goods Logistics Market Market Dynamics & Structure
The US Dangerous Goods Logistics market is characterized by a moderately concentrated landscape, with major players like United Parcel Service Inc, FedEx Corporation, and Deutsche Post DHL Group holding significant market share. However, smaller specialized firms also contribute substantially. The market is driven by technological innovations such as advanced tracking systems, improved packaging materials, and enhanced safety protocols. Stringent regulatory frameworks, including those established by the Department of Transportation (DOT), influence operational practices and compliance costs. Competitive pressures arise from substitute modes of transportation and the emergence of new technologies. The market experiences consistent M&A activity, with an estimated XX number of deals in the last five years, reflecting consolidation and expansion efforts.
- Market Concentration: Moderately concentrated, with top 5 players holding approximately XX% market share in 2025.
- Technological Innovation: Focus on automation, IoT integration, and AI-driven risk management.
- Regulatory Framework: Strict adherence to DOT regulations and evolving safety standards.
- Competitive Substitutes: Alternative transportation modes and emerging technologies pose challenges.
- M&A Activity: XX deals in the past five years, signaling industry consolidation.
- End-user Demographics: Primarily manufacturing, chemical, pharmaceutical, and healthcare industries.
US Dangerous Goods Logistics Market Growth Trends & Insights
The US Dangerous Goods Logistics market has exhibited steady growth during the historical period (2019-2024), driven by increasing industrial activity, e-commerce expansion, and a rising demand for specialized logistics services. The market size has grown from $XX Million in 2019 to an estimated $XX Million in 2025, reflecting a Compound Annual Growth Rate (CAGR) of XX%. Technological disruptions, such as the adoption of blockchain for enhanced supply chain transparency and the use of AI for predictive maintenance, are accelerating market growth. Consumer behavior shifts, particularly towards increased demand for faster and more reliable delivery of hazardous materials, are also influencing market dynamics. The market penetration rate for advanced tracking systems is estimated at XX% in 2025 and is projected to reach XX% by 2033.
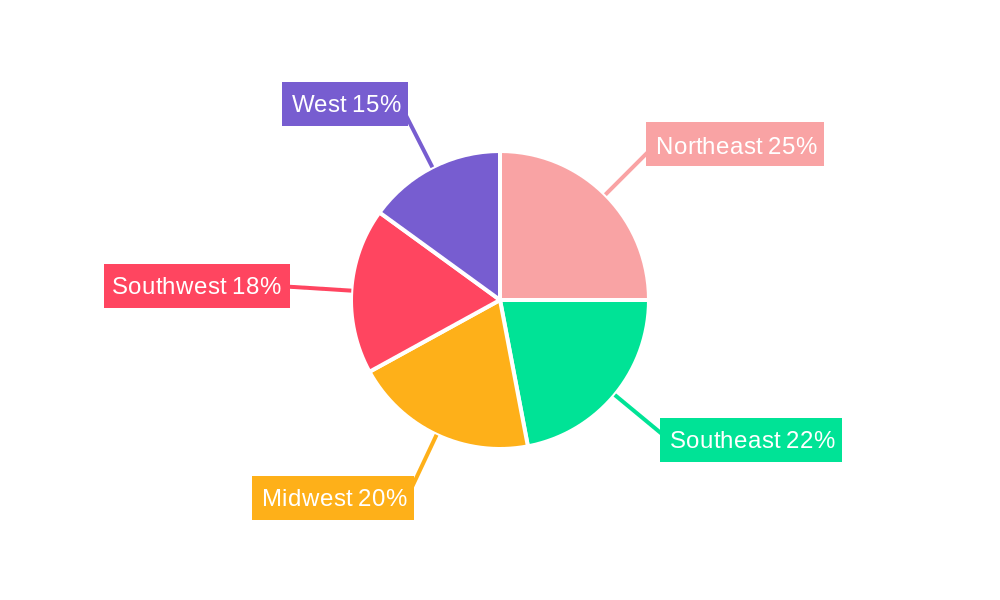
Dominant Regions, Countries, or Segments in US Dangerous Goods Logistics Market
The Northeast and West Coast regions are dominant due to higher industrial concentrations and major port facilities. The International segment is exhibiting faster growth than the domestic segment due to the increasing global trade of hazardous materials. Within functional segments, Transportation accounts for the largest share, followed by Warehousing and Distribution and Value-added Services. Growth is primarily propelled by stringent regulatory compliance needs and the growing preference for specialized handling and transportation services for dangerous goods.
- Key Drivers (Northeast & West Coast): Dense industrial clusters, major ports, and strong regulatory enforcement.
- Key Drivers (International Segment): Increasing global trade of hazardous goods and expanding international supply chains.
- Key Drivers (Transportation Segment): Demand for specialized transportation fleets and advanced tracking systems.
- Market Share: Transportation (XX%), Warehousing & Distribution (XX%), Value-added Services (XX%), Domestic (XX%), International (XX%).
US Dangerous Goods Logistics Market Product Landscape
Product innovation focuses on enhancing safety features, improving tracking capabilities, and optimizing logistics processes. This includes advanced packaging solutions designed to withstand various conditions, real-time monitoring systems using GPS and IoT sensors, and sophisticated software for route optimization and risk management. The primary value proposition for clients lies in reducing transportation risks, complying with regulations, and ensuring the safe and timely delivery of hazardous materials. Technological advancements, such as the integration of AI and machine learning, promise to further enhance safety and efficiency.
Key Drivers, Barriers & Challenges in US Dangerous Goods Logistics Market
Key Drivers: Growing industrial activity, expanding e-commerce, stringent regulations driving the demand for specialized services, and technological advancements improving safety and efficiency.
Key Challenges: Stringent regulatory compliance costs, potential supply chain disruptions due to geopolitical events, increased insurance premiums, and fierce competition. These factors impact profitability and market expansion. The average cost of regulatory compliance is estimated at $XX million annually for a large-scale operator.
Emerging Opportunities in US Dangerous Goods Logistics Market
Emerging opportunities lie in the adoption of blockchain technology for enhanced supply chain transparency, the increasing demand for specialized services in emerging industries (e.g., renewable energy), and the development of sustainable logistics solutions for hazardous materials. Untapped markets exist in niche sectors and underserved regions, presenting opportunities for specialized providers.
Growth Accelerators in the US Dangerous Goods Logistics Market Industry
Technological breakthroughs in areas like AI-powered risk assessment, autonomous vehicles for hazardous materials transport, and IoT-based tracking systems are accelerating market growth. Strategic partnerships between logistics providers and technology companies are driving innovation and improving operational efficiencies. Market expansion into emerging industries and international markets further contributes to long-term growth.
Key Players Shaping the US Dangerous Goods Logistics Market Market
- United Parcel Service Inc
- APL Logistics
- FedEx Corporation
- GEODIS
- XPO Logistics
- Landstar System Inc
- DB Schenker (The Americas)
- Kuehne + Nagel
- Schneider Logistics
- Deutsche Post DHL Group
- DSV
Notable Milestones in US Dangerous Goods Logistics Market Sector
- 2020: Increased regulatory scrutiny following several high-profile incidents.
- 2021: Significant investment in advanced tracking and monitoring technologies.
- 2022: Several major mergers and acquisitions, consolidating market share.
- 2023: Introduction of new packaging standards for improved safety.
- 2024: Growing adoption of sustainable logistics practices.
In-Depth US Dangerous Goods Logistics Market Market Outlook
The US Dangerous Goods Logistics market is poised for continued growth driven by technological innovation, stringent regulatory compliance needs, and the increasing demand for efficient and secure hazardous materials handling. Strategic partnerships, investments in advanced technologies, and expansion into new markets will be crucial for sustained success. The market is projected to reach $XX Million by 2033, showcasing significant potential for growth and investment.
US Dangerous Goods Logistics Market Segmentation
-
1. BY FUNCTION
-
1.1. Transportation
- 1.1.1. Road
- 1.1.2. Rail
- 1.1.3. Water
- 1.1.4. Pipeline
- 1.1.5. Air
- 1.2. Warehousing and Distribution
- 1.3. Value-ad
-
1.1. Transportation
-
2. BY DESTINATION
- 2.1. Domestic
- 2.2. International
US Dangerous Goods Logistics Market Segmentation By Geography
-
1. North America
- 1.1. United States
- 1.2. Canada
- 1.3. Mexico
-
2. South America
- 2.1. Brazil
- 2.2. Argentina
- 2.3. Rest of South America
-
3. Europe
- 3.1. United Kingdom
- 3.2. Germany
- 3.3. France
- 3.4. Italy
- 3.5. Spain
- 3.6. Russia
- 3.7. Benelux
- 3.8. Nordics
- 3.9. Rest of Europe
-
4. Middle East & Africa
- 4.1. Turkey
- 4.2. Israel
- 4.3. GCC
- 4.4. North Africa
- 4.5. South Africa
- 4.6. Rest of Middle East & Africa
-
5. Asia Pacific
- 5.1. China
- 5.2. India
- 5.3. Japan
- 5.4. South Korea
- 5.5. ASEAN
- 5.6. Oceania
- 5.7. Rest of Asia Pacific
US Dangerous Goods Logistics Market Regional Market Share
Geographic Coverage of US Dangerous Goods Logistics Market
US Dangerous Goods Logistics Market REPORT HIGHLIGHTS
| Aspects | Details |
|---|---|
| Study Period | 2020-2034 |
| Base Year | 2025 |
| Estimated Year | 2026 |
| Forecast Period | 2026-2034 |
| Historical Period | 2020-2025 |
| Growth Rate | CAGR of 7.6% from 2020-2034 |
| Segmentation |
|
Table of Contents
- 1. Introduction
- 1.1. Research Scope
- 1.2. Market Segmentation
- 1.3. Research Objective
- 1.4. Definitions and Assumptions
- 2. Executive Summary
- 2.1. Market Snapshot
- 3. Market Dynamics
- 3.1. Market Drivers
- 3.2. Market Restrains
- 3.3. Market Trends
- 3.4. Market Opportunities
- 4. Market Factor Analysis
- 4.1. Porters Five Forces
- 4.1.1. Bargaining Power of Suppliers
- 4.1.2. Bargaining Power of Buyers
- 4.1.3. Threat of New Entrants
- 4.1.4. Threat of Substitutes
- 4.1.5. Competitive Rivalry
- 4.2. PESTEL analysis
- 4.3. BCG Analysis
- 4.3.1. Stars (High Growth, High Market Share)
- 4.3.2. Cash Cows (Low Growth, High Market Share)
- 4.3.3. Question Mark (High Growth, Low Market Share)
- 4.3.4. Dogs (Low Growth, Low Market Share)
- 4.4. Ansoff Matrix Analysis
- 4.5. Supply Chain Analysis
- 4.6. Regulatory Landscape
- 4.7. Current Market Potential and Opportunity Assessment (TAM–SAM–SOM Framework)
- 4.8. VDR Analyst Note
- 4.1. Porters Five Forces
- 5. Market Analysis, Insights and Forecast 2021-2033
- 5.1. Market Analysis, Insights and Forecast - by BY FUNCTION
- 5.1.1. Transportation
- 5.1.1.1. Road
- 5.1.1.2. Rail
- 5.1.1.3. Water
- 5.1.1.4. Pipeline
- 5.1.1.5. Air
- 5.1.2. Warehousing and Distribution
- 5.1.3. Value-ad
- 5.1.1. Transportation
- 5.2. Market Analysis, Insights and Forecast - by BY DESTINATION
- 5.2.1. Domestic
- 5.2.2. International
- 5.3. Market Analysis, Insights and Forecast - by Region
- 5.3.1. North America
- 5.3.2. South America
- 5.3.3. Europe
- 5.3.4. Middle East & Africa
- 5.3.5. Asia Pacific
- 5.1. Market Analysis, Insights and Forecast - by BY FUNCTION
- 6. Global US Dangerous Goods Logistics Market Analysis, Insights and Forecast, 2021-2033
- 6.1. Market Analysis, Insights and Forecast - by BY FUNCTION
- 6.1.1. Transportation
- 6.1.1.1. Road
- 6.1.1.2. Rail
- 6.1.1.3. Water
- 6.1.1.4. Pipeline
- 6.1.1.5. Air
- 6.1.2. Warehousing and Distribution
- 6.1.3. Value-ad
- 6.1.1. Transportation
- 6.2. Market Analysis, Insights and Forecast - by BY DESTINATION
- 6.2.1. Domestic
- 6.2.2. International
- 6.1. Market Analysis, Insights and Forecast - by BY FUNCTION
- 7. North America US Dangerous Goods Logistics Market Analysis, Insights and Forecast, 2021-2033
- 7.1. Market Analysis, Insights and Forecast - by BY FUNCTION
- 7.1.1. Transportation
- 7.1.1.1. Road
- 7.1.1.2. Rail
- 7.1.1.3. Water
- 7.1.1.4. Pipeline
- 7.1.1.5. Air
- 7.1.2. Warehousing and Distribution
- 7.1.3. Value-ad
- 7.1.1. Transportation
- 7.2. Market Analysis, Insights and Forecast - by BY DESTINATION
- 7.2.1. Domestic
- 7.2.2. International
- 7.1. Market Analysis, Insights and Forecast - by BY FUNCTION
- 8. South America US Dangerous Goods Logistics Market Analysis, Insights and Forecast, 2021-2033
- 8.1. Market Analysis, Insights and Forecast - by BY FUNCTION
- 8.1.1. Transportation
- 8.1.1.1. Road
- 8.1.1.2. Rail
- 8.1.1.3. Water
- 8.1.1.4. Pipeline
- 8.1.1.5. Air
- 8.1.2. Warehousing and Distribution
- 8.1.3. Value-ad
- 8.1.1. Transportation
- 8.2. Market Analysis, Insights and Forecast - by BY DESTINATION
- 8.2.1. Domestic
- 8.2.2. International
- 8.1. Market Analysis, Insights and Forecast - by BY FUNCTION
- 9. Europe US Dangerous Goods Logistics Market Analysis, Insights and Forecast, 2021-2033
- 9.1. Market Analysis, Insights and Forecast - by BY FUNCTION
- 9.1.1. Transportation
- 9.1.1.1. Road
- 9.1.1.2. Rail
- 9.1.1.3. Water
- 9.1.1.4. Pipeline
- 9.1.1.5. Air
- 9.1.2. Warehousing and Distribution
- 9.1.3. Value-ad
- 9.1.1. Transportation
- 9.2. Market Analysis, Insights and Forecast - by BY DESTINATION
- 9.2.1. Domestic
- 9.2.2. International
- 9.1. Market Analysis, Insights and Forecast - by BY FUNCTION
- 10. Middle East & Africa US Dangerous Goods Logistics Market Analysis, Insights and Forecast, 2021-2033
- 10.1. Market Analysis, Insights and Forecast - by BY FUNCTION
- 10.1.1. Transportation
- 10.1.1.1. Road
- 10.1.1.2. Rail
- 10.1.1.3. Water
- 10.1.1.4. Pipeline
- 10.1.1.5. Air
- 10.1.2. Warehousing and Distribution
- 10.1.3. Value-ad
- 10.1.1. Transportation
- 10.2. Market Analysis, Insights and Forecast - by BY DESTINATION
- 10.2.1. Domestic
- 10.2.2. International
- 10.1. Market Analysis, Insights and Forecast - by BY FUNCTION
- 11. Asia Pacific US Dangerous Goods Logistics Market Analysis, Insights and Forecast, 2021-2033
- 11.1. Market Analysis, Insights and Forecast - by BY FUNCTION
- 11.1.1. Transportation
- 11.1.1.1. Road
- 11.1.1.2. Rail
- 11.1.1.3. Water
- 11.1.1.4. Pipeline
- 11.1.1.5. Air
- 11.1.2. Warehousing and Distribution
- 11.1.3. Value-ad
- 11.1.1. Transportation
- 11.2. Market Analysis, Insights and Forecast - by BY DESTINATION
- 11.2.1. Domestic
- 11.2.2. International
- 11.1. Market Analysis, Insights and Forecast - by BY FUNCTION
- 12. Competitive Analysis
- 12.1. Company Profiles
- 12.1.1 United Parcel Service Inc
- 12.1.1.1. Company Overview
- 12.1.1.2. Products
- 12.1.1.3. Company Financials
- 12.1.1.4. SWOT Analysis
- 12.1.2 APL Logistics
- 12.1.2.1. Company Overview
- 12.1.2.2. Products
- 12.1.2.3. Company Financials
- 12.1.2.4. SWOT Analysis
- 12.1.3 FedEx Corporation
- 12.1.3.1. Company Overview
- 12.1.3.2. Products
- 12.1.3.3. Company Financials
- 12.1.3.4. SWOT Analysis
- 12.1.4 GEODIS
- 12.1.4.1. Company Overview
- 12.1.4.2. Products
- 12.1.4.3. Company Financials
- 12.1.4.4. SWOT Analysis
- 12.1.5 XPO Logistics
- 12.1.5.1. Company Overview
- 12.1.5.2. Products
- 12.1.5.3. Company Financials
- 12.1.5.4. SWOT Analysis
- 12.1.6 Landstar System Inc **List Not Exhaustive
- 12.1.6.1. Company Overview
- 12.1.6.2. Products
- 12.1.6.3. Company Financials
- 12.1.6.4. SWOT Analysis
- 12.1.7 DB Schenker (The Americas)
- 12.1.7.1. Company Overview
- 12.1.7.2. Products
- 12.1.7.3. Company Financials
- 12.1.7.4. SWOT Analysis
- 12.1.8 Kuehne + Nagel
- 12.1.8.1. Company Overview
- 12.1.8.2. Products
- 12.1.8.3. Company Financials
- 12.1.8.4. SWOT Analysis
- 12.1.9 Schneider Logistics
- 12.1.9.1. Company Overview
- 12.1.9.2. Products
- 12.1.9.3. Company Financials
- 12.1.9.4. SWOT Analysis
- 12.1.10 Deutsche Post DHL Group
- 12.1.10.1. Company Overview
- 12.1.10.2. Products
- 12.1.10.3. Company Financials
- 12.1.10.4. SWOT Analysis
- 12.1.11 DSV
- 12.1.11.1. Company Overview
- 12.1.11.2. Products
- 12.1.11.3. Company Financials
- 12.1.11.4. SWOT Analysis
- 12.1.1 United Parcel Service Inc
- 12.2. Market Entropy
- 12.2.1 Company's Key Areas Served
- 12.2.2 Recent Developments
- 12.3. Company Market Share Analysis 2025
- 12.3.1 Top 5 Companies Market Share Analysis
- 12.3.2 Top 3 Companies Market Share Analysis
- 12.4. List of Potential Customers
- 13. Research Methodology
List of Figures
- Figure 1: Global US Dangerous Goods Logistics Market Revenue Breakdown (billion, %) by Region 2025 & 2033
- Figure 2: North America US Dangerous Goods Logistics Market Revenue (billion), by BY FUNCTION 2025 & 2033
- Figure 3: North America US Dangerous Goods Logistics Market Revenue Share (%), by BY FUNCTION 2025 & 2033
- Figure 4: North America US Dangerous Goods Logistics Market Revenue (billion), by BY DESTINATION 2025 & 2033
- Figure 5: North America US Dangerous Goods Logistics Market Revenue Share (%), by BY DESTINATION 2025 & 2033
- Figure 6: North America US Dangerous Goods Logistics Market Revenue (billion), by Country 2025 & 2033
- Figure 7: North America US Dangerous Goods Logistics Market Revenue Share (%), by Country 2025 & 2033
- Figure 8: South America US Dangerous Goods Logistics Market Revenue (billion), by BY FUNCTION 2025 & 2033
- Figure 9: South America US Dangerous Goods Logistics Market Revenue Share (%), by BY FUNCTION 2025 & 2033
- Figure 10: South America US Dangerous Goods Logistics Market Revenue (billion), by BY DESTINATION 2025 & 2033
- Figure 11: South America US Dangerous Goods Logistics Market Revenue Share (%), by BY DESTINATION 2025 & 2033
- Figure 12: South America US Dangerous Goods Logistics Market Revenue (billion), by Country 2025 & 2033
- Figure 13: South America US Dangerous Goods Logistics Market Revenue Share (%), by Country 2025 & 2033
- Figure 14: Europe US Dangerous Goods Logistics Market Revenue (billion), by BY FUNCTION 2025 & 2033
- Figure 15: Europe US Dangerous Goods Logistics Market Revenue Share (%), by BY FUNCTION 2025 & 2033
- Figure 16: Europe US Dangerous Goods Logistics Market Revenue (billion), by BY DESTINATION 2025 & 2033
- Figure 17: Europe US Dangerous Goods Logistics Market Revenue Share (%), by BY DESTINATION 2025 & 2033
- Figure 18: Europe US Dangerous Goods Logistics Market Revenue (billion), by Country 2025 & 2033
- Figure 19: Europe US Dangerous Goods Logistics Market Revenue Share (%), by Country 2025 & 2033
- Figure 20: Middle East & Africa US Dangerous Goods Logistics Market Revenue (billion), by BY FUNCTION 2025 & 2033
- Figure 21: Middle East & Africa US Dangerous Goods Logistics Market Revenue Share (%), by BY FUNCTION 2025 & 2033
- Figure 22: Middle East & Africa US Dangerous Goods Logistics Market Revenue (billion), by BY DESTINATION 2025 & 2033
- Figure 23: Middle East & Africa US Dangerous Goods Logistics Market Revenue Share (%), by BY DESTINATION 2025 & 2033
- Figure 24: Middle East & Africa US Dangerous Goods Logistics Market Revenue (billion), by Country 2025 & 2033
- Figure 25: Middle East & Africa US Dangerous Goods Logistics Market Revenue Share (%), by Country 2025 & 2033
- Figure 26: Asia Pacific US Dangerous Goods Logistics Market Revenue (billion), by BY FUNCTION 2025 & 2033
- Figure 27: Asia Pacific US Dangerous Goods Logistics Market Revenue Share (%), by BY FUNCTION 2025 & 2033
- Figure 28: Asia Pacific US Dangerous Goods Logistics Market Revenue (billion), by BY DESTINATION 2025 & 2033
- Figure 29: Asia Pacific US Dangerous Goods Logistics Market Revenue Share (%), by BY DESTINATION 2025 & 2033
- Figure 30: Asia Pacific US Dangerous Goods Logistics Market Revenue (billion), by Country 2025 & 2033
- Figure 31: Asia Pacific US Dangerous Goods Logistics Market Revenue Share (%), by Country 2025 & 2033
List of Tables
- Table 1: Global US Dangerous Goods Logistics Market Revenue billion Forecast, by BY FUNCTION 2020 & 2033
- Table 2: Global US Dangerous Goods Logistics Market Revenue billion Forecast, by BY DESTINATION 2020 & 2033
- Table 3: Global US Dangerous Goods Logistics Market Revenue billion Forecast, by Region 2020 & 2033
- Table 4: Global US Dangerous Goods Logistics Market Revenue billion Forecast, by BY FUNCTION 2020 & 2033
- Table 5: Global US Dangerous Goods Logistics Market Revenue billion Forecast, by BY DESTINATION 2020 & 2033
- Table 6: Global US Dangerous Goods Logistics Market Revenue billion Forecast, by Country 2020 & 2033
- Table 7: United States US Dangerous Goods Logistics Market Revenue (billion) Forecast, by Application 2020 & 2033
- Table 8: Canada US Dangerous Goods Logistics Market Revenue (billion) Forecast, by Application 2020 & 2033
- Table 9: Mexico US Dangerous Goods Logistics Market Revenue (billion) Forecast, by Application 2020 & 2033
- Table 10: Global US Dangerous Goods Logistics Market Revenue billion Forecast, by BY FUNCTION 2020 & 2033
- Table 11: Global US Dangerous Goods Logistics Market Revenue billion Forecast, by BY DESTINATION 2020 & 2033
- Table 12: Global US Dangerous Goods Logistics Market Revenue billion Forecast, by Country 2020 & 2033
- Table 13: Brazil US Dangerous Goods Logistics Market Revenue (billion) Forecast, by Application 2020 & 2033
- Table 14: Argentina US Dangerous Goods Logistics Market Revenue (billion) Forecast, by Application 2020 & 2033
- Table 15: Rest of South America US Dangerous Goods Logistics Market Revenue (billion) Forecast, by Application 2020 & 2033
- Table 16: Global US Dangerous Goods Logistics Market Revenue billion Forecast, by BY FUNCTION 2020 & 2033
- Table 17: Global US Dangerous Goods Logistics Market Revenue billion Forecast, by BY DESTINATION 2020 & 2033
- Table 18: Global US Dangerous Goods Logistics Market Revenue billion Forecast, by Country 2020 & 2033
- Table 19: United Kingdom US Dangerous Goods Logistics Market Revenue (billion) Forecast, by Application 2020 & 2033
- Table 20: Germany US Dangerous Goods Logistics Market Revenue (billion) Forecast, by Application 2020 & 2033
- Table 21: France US Dangerous Goods Logistics Market Revenue (billion) Forecast, by Application 2020 & 2033
- Table 22: Italy US Dangerous Goods Logistics Market Revenue (billion) Forecast, by Application 2020 & 2033
- Table 23: Spain US Dangerous Goods Logistics Market Revenue (billion) Forecast, by Application 2020 & 2033
- Table 24: Russia US Dangerous Goods Logistics Market Revenue (billion) Forecast, by Application 2020 & 2033
- Table 25: Benelux US Dangerous Goods Logistics Market Revenue (billion) Forecast, by Application 2020 & 2033
- Table 26: Nordics US Dangerous Goods Logistics Market Revenue (billion) Forecast, by Application 2020 & 2033
- Table 27: Rest of Europe US Dangerous Goods Logistics Market Revenue (billion) Forecast, by Application 2020 & 2033
- Table 28: Global US Dangerous Goods Logistics Market Revenue billion Forecast, by BY FUNCTION 2020 & 2033
- Table 29: Global US Dangerous Goods Logistics Market Revenue billion Forecast, by BY DESTINATION 2020 & 2033
- Table 30: Global US Dangerous Goods Logistics Market Revenue billion Forecast, by Country 2020 & 2033
- Table 31: Turkey US Dangerous Goods Logistics Market Revenue (billion) Forecast, by Application 2020 & 2033
- Table 32: Israel US Dangerous Goods Logistics Market Revenue (billion) Forecast, by Application 2020 & 2033
- Table 33: GCC US Dangerous Goods Logistics Market Revenue (billion) Forecast, by Application 2020 & 2033
- Table 34: North Africa US Dangerous Goods Logistics Market Revenue (billion) Forecast, by Application 2020 & 2033
- Table 35: South Africa US Dangerous Goods Logistics Market Revenue (billion) Forecast, by Application 2020 & 2033
- Table 36: Rest of Middle East & Africa US Dangerous Goods Logistics Market Revenue (billion) Forecast, by Application 2020 & 2033
- Table 37: Global US Dangerous Goods Logistics Market Revenue billion Forecast, by BY FUNCTION 2020 & 2033
- Table 38: Global US Dangerous Goods Logistics Market Revenue billion Forecast, by BY DESTINATION 2020 & 2033
- Table 39: Global US Dangerous Goods Logistics Market Revenue billion Forecast, by Country 2020 & 2033
- Table 40: China US Dangerous Goods Logistics Market Revenue (billion) Forecast, by Application 2020 & 2033
- Table 41: India US Dangerous Goods Logistics Market Revenue (billion) Forecast, by Application 2020 & 2033
- Table 42: Japan US Dangerous Goods Logistics Market Revenue (billion) Forecast, by Application 2020 & 2033
- Table 43: South Korea US Dangerous Goods Logistics Market Revenue (billion) Forecast, by Application 2020 & 2033
- Table 44: ASEAN US Dangerous Goods Logistics Market Revenue (billion) Forecast, by Application 2020 & 2033
- Table 45: Oceania US Dangerous Goods Logistics Market Revenue (billion) Forecast, by Application 2020 & 2033
- Table 46: Rest of Asia Pacific US Dangerous Goods Logistics Market Revenue (billion) Forecast, by Application 2020 & 2033
Frequently Asked Questions
1. What is the projected Compound Annual Growth Rate (CAGR) of the US Dangerous Goods Logistics Market?
The projected CAGR is approximately 7.6%.
2. Which companies are prominent players in the US Dangerous Goods Logistics Market?
Key companies in the market include United Parcel Service Inc, APL Logistics, FedEx Corporation, GEODIS, XPO Logistics, Landstar System Inc **List Not Exhaustive, DB Schenker (The Americas), Kuehne + Nagel, Schneider Logistics, Deutsche Post DHL Group, DSV.
3. What are the main segments of the US Dangerous Goods Logistics Market?
The market segments include BY FUNCTION, BY DESTINATION.
4. Can you provide details about the market size?
The market size is estimated to be USD 251.13 billion as of 2022.
5. What are some drivers contributing to market growth?
5.1 Drivers 5.2 Restraints 5.3 Opportunities 5.4 Porter's Five Forces Analysis 5.5 Industry Value Chain Analysis.
6. What are the notable trends driving market growth?
The US Oil Industry Growth.
7. Are there any restraints impacting market growth?
5.1 Drivers 5.2 Restraints 5.3 Opportunities 5.4 Porter's Five Forces Analysis 5.5 Industry Value Chain Analysis.
8. Can you provide examples of recent developments in the market?
N/A
9. What pricing options are available for accessing the report?
Pricing options include single-user, multi-user, and enterprise licenses priced at USD 3800, USD 4500, and USD 5800 respectively.
10. Is the market size provided in terms of value or volume?
The market size is provided in terms of value, measured in billion.
11. Are there any specific market keywords associated with the report?
Yes, the market keyword associated with the report is "US Dangerous Goods Logistics Market," which aids in identifying and referencing the specific market segment covered.
12. How do I determine which pricing option suits my needs best?
The pricing options vary based on user requirements and access needs. Individual users may opt for single-user licenses, while businesses requiring broader access may choose multi-user or enterprise licenses for cost-effective access to the report.
13. Are there any additional resources or data provided in the US Dangerous Goods Logistics Market report?
While the report offers comprehensive insights, it's advisable to review the specific contents or supplementary materials provided to ascertain if additional resources or data are available.
14. How can I stay updated on further developments or reports in the US Dangerous Goods Logistics Market?
To stay informed about further developments, trends, and reports in the US Dangerous Goods Logistics Market, consider subscribing to industry newsletters, following relevant companies and organizations, or regularly checking reputable industry news sources and publications.
Methodology
Step 1 - Identification of Relevant Samples Size from Population Database


Step 2 - Approaches for Defining Global Market Size (Value, Volume* & Price*)

Note*: In applicable scenarios
Step 3 - Data Sources
Primary Research
- Web Analytics
- Survey Reports
- Research Institute
- Latest Research Reports
- Opinion Leaders
Secondary Research
- Annual Reports
- White Paper
- Latest Press Release
- Industry Association
- Paid Database
- Investor Presentations

Step 4 - Data Triangulation
Involves using different sources of information in order to increase the validity of a study
These sources are likely to be stakeholders in a program - participants, other researchers, program staff, other community members, and so on.
Then we put all data in single framework & apply various statistical tools to find out the dynamic on the market.
During the analysis stage, feedback from the stakeholder groups would be compared to determine areas of agreement as well as areas of divergence