

Key Insights
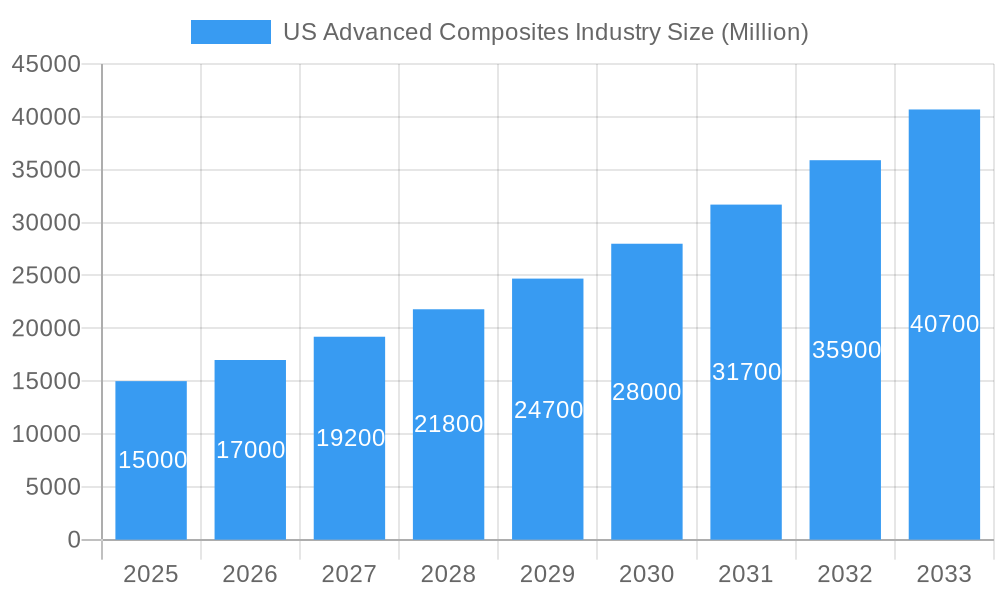
The US advanced composites market is set for significant expansion, with an estimated market size of $52.4 billion in the base year 2025. The sector is projected to grow at a Compound Annual Growth Rate (CAGR) of 8.9%. This robust growth trajectory is propelled by the increasing demand for lightweight, high-strength materials across key industries. The automotive sector's focus on enhanced fuel efficiency and performance, coupled with the aerospace industry's need for advanced materials in aircraft and spacecraft, are primary market drivers. Innovations in high-performance thermoplastics and advanced carbon fiber reinforced polymers are expanding application possibilities. Government support for sustainable and lightweight materials further bolsters market growth. Geographically, the Northeast and West Coast regions are leading expansion due to their established aerospace and automotive manufacturing presence.
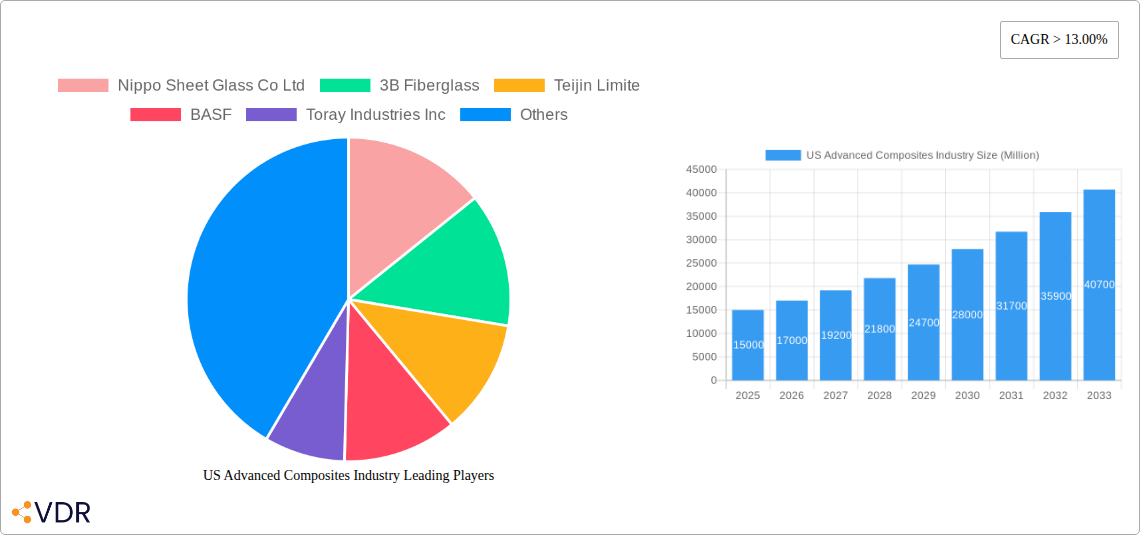
US Advanced Composites Industry Market Size (In Billion)
While the market outlook is positive, certain factors may influence growth. High manufacturing costs for specific advanced composite fabrication methods, such as autoclave curing, can limit adoption in price-sensitive segments. Supply chain volatility and workforce skill gaps also pose challenges. However, advancements in automation and cost-effective production techniques are actively addressing these constraints. The market is segmented by diverse applications, with notable growth anticipated in structural assembly, electric vehicle powertrain components, and automotive interiors and exteriors. Leading companies are actively investing in R&D to foster innovation and market penetration, ensuring a substantial increase in market size driven by continuous technological progress and the exploration of new application frontiers.
US Advanced Composites Industry Company Market Share
US Advanced Composites Industry Market Report: 2019-2033
This comprehensive report provides an in-depth analysis of the US advanced composites industry, offering invaluable insights for industry professionals, investors, and strategic decision-makers. The report covers the period from 2019 to 2033, with a focus on the 2025-2033 forecast period. The base year for analysis is 2025. Market values are presented in millions of USD.
US Advanced Composites Industry Market Dynamics & Structure
This section analyzes the competitive landscape, technological advancements, regulatory environment, and market trends influencing the US advanced composites market. We delve into market concentration, identifying key players and their market share, and examining the impact of mergers and acquisitions (M&A) activity. The analysis considers the influence of substitute products, evolving end-user demographics, and the challenges and opportunities presented by technological innovation. The report provides quantitative insights, including market share percentages and M&A deal volumes, complemented by qualitative observations on innovation barriers and market dynamics.
- Market Concentration: The US advanced composites market exhibits a moderately concentrated structure, with [xx]% market share held by the top 5 players in 2025.
- Technological Innovation: Continuous advancements in material science, particularly in carbon fiber and thermoplastic polymers, are driving significant growth. However, high R&D costs and complex manufacturing processes pose significant innovation barriers.
- Regulatory Framework: Government regulations focused on fuel efficiency and emission reduction in the automotive and aerospace sectors are key growth drivers. However, stringent environmental regulations related to material disposal can present challenges.
- Competitive Substitutes: Traditional materials like steel and aluminum pose competition, although advanced composites offer significant advantages in terms of weight reduction and performance.
- End-User Demographics: The automotive and aerospace industries remain dominant end-users, but growth is anticipated in other sectors like wind energy and construction.
- M&A Trends: The past five years have witnessed [xx] significant M&A deals, primarily driven by consolidation efforts and expansion into new applications.
US Advanced Composites Industry Growth Trends & Insights
This section offers a detailed analysis of market size evolution, adoption rates across various segments, and the impact of technological disruptions and evolving consumer preferences on market growth. We use proprietary data and industry analysis to project future trends and provide quantitative insights, including Compound Annual Growth Rate (CAGR) and market penetration rates. The analysis accounts for the influence of macroeconomic factors and evolving consumer demands. The projected CAGR for the US advanced composites market from 2025 to 2033 is [xx]%, driven primarily by [mention specific drivers, e.g., increasing demand for lightweight vehicles, growth of the renewable energy sector]. Market penetration in specific application areas, such as [mention specific application areas], is projected to increase from [xx]% in 2025 to [xx]% by 2033.
Dominant Regions, Countries, or Segments in US Advanced Composites Industry
This section identifies the leading regions, countries, and market segments within the US advanced composites industry, analyzing factors driving their dominance. We examine market share, growth potential, and key drivers such as economic policies, infrastructure development, and regional demand across various application areas (automotive, aerospace, wind energy). Specific segments analyzed include Production Type (Hand Layup, Resin Transfer Molding, Vacuum Infusion Processing, Injection Molding, Compression Molding), Material Type (Thermoset Polymer, Thermoplastic Polymer, Carbon Fiber, Glass Fiber, Others), and Application Type (Structural Assembly, Power Train Components, Interior, Exterior, Others).
- Leading Region: The [mention region, e.g., Midwest] is projected to dominate due to [mention reasons, e.g., strong automotive manufacturing base].
- Dominant Segment (Production Type): [Mention dominant production type, e.g., Resin Transfer Molding], due to its [mention reasons, e.g., cost-effectiveness and suitability for high-volume production].
- Dominant Segment (Material Type): [Mention dominant material type, e.g., Carbon Fiber], driven by [mention reasons, e.g., its high strength-to-weight ratio].
- Dominant Segment (Application Type): [Mention dominant application type, e.g., Automotive], owing to [mention reasons, e.g., stringent fuel efficiency standards].
US Advanced Composites Industry Product Landscape
The US advanced composites market is characterized by continuous product innovation, leading to improved performance, lighter weight materials, and expanded applications. New materials and manufacturing processes are constantly emerging, enhancing the properties of composite materials, including their strength, stiffness, durability, and resistance to various environmental factors. These advancements are driving increased adoption across various sectors. Unique selling propositions are centered around improved performance metrics compared to traditional materials, with a focus on weight reduction and enhanced functionality.
Key Drivers, Barriers & Challenges in US Advanced Composites Industry
Key Drivers:
- Technological advancements in material science and manufacturing processes.
- Growing demand from the automotive and aerospace industries for lightweight and high-performance materials.
- Government regulations promoting fuel efficiency and emission reduction.
Challenges & Restraints:
- High manufacturing costs compared to traditional materials.
- Complex manufacturing processes and skilled labor requirements.
- Concerns regarding recyclability and environmental impact.
- Supply chain disruptions impacting the availability and cost of raw materials.
Emerging Opportunities in US Advanced Composites Industry
The US advanced composites industry presents significant emerging opportunities. Untapped markets such as [mention examples, e.g., construction and renewable energy], are poised for rapid expansion. Innovative applications like [mention examples, e.g., 3D-printed composite parts], offer potential for significant growth. Evolving consumer preferences for lighter, more fuel-efficient vehicles and durable products further support market expansion.
Growth Accelerators in the US Advanced Composites Industry Industry
Technological breakthroughs in material science and manufacturing, coupled with strategic partnerships and government initiatives, are key growth accelerators for the US advanced composites industry. The expansion of applications into new markets, coupled with increased focus on sustainability and lifecycle management of composite materials, will drive long-term growth.
Key Players Shaping the US Advanced Composites Industry Market
- Nippo Sheet Glass Co Ltd
- 3B Fiberglass
- Teijin Limited
- BASF
- Toray Industries Inc
- General Motors Company
- Base Group
- Cytec Industries Inc
- BMW
- Delphi Auto
- SGL Group
Notable Milestones in US Advanced Composites Industry Sector
- 2020: Introduction of a new high-strength carbon fiber by [Company Name].
- 2021: Merger between [Company A] and [Company B], expanding market share.
- 2022: Launch of a new recycling technology for composite materials.
- 2023: Government announces funding for research in advanced composite materials.
- 2024: Significant investment in new composite manufacturing facilities.
In-Depth US Advanced Composites Industry Market Outlook
The US advanced composites market is poised for robust growth in the coming years, driven by technological advancements, increased adoption in diverse sectors, and supportive government policies. Strategic opportunities exist in developing sustainable manufacturing processes, expanding into new applications, and leveraging technological innovations to enhance performance and reduce costs. The focus on lightweighting and improved fuel efficiency across various industries will significantly drive market demand.
US Advanced Composites Industry Segmentation
-
1. Productino Type
- 1.1. Hand Layup
- 1.2. Resin Transfer Molding
- 1.3. Vacuum Infusion Processing
- 1.4. Injection Molding
- 1.5. Compression Molding
-
2. Material Type
- 2.1. Thermoset Polymer
- 2.2. Thermoplastic Polymer
- 2.3. Carbon Fiber
- 2.4. Glass Fiber
- 2.5. Others
-
3. Application Type
- 3.1. Structural Assembly
- 3.2. Power Train Components
- 3.3. Interior
- 3.4. Exterior
- 3.5. Others
US Advanced Composites Industry Segmentation By Geography
-
1. North America
- 1.1. United States
- 1.2. Canada
- 1.3. Mexico
-
2. South America
- 2.1. Brazil
- 2.2. Argentina
- 2.3. Rest of South America
-
3. Europe
- 3.1. United Kingdom
- 3.2. Germany
- 3.3. France
- 3.4. Italy
- 3.5. Spain
- 3.6. Russia
- 3.7. Benelux
- 3.8. Nordics
- 3.9. Rest of Europe
-
4. Middle East & Africa
- 4.1. Turkey
- 4.2. Israel
- 4.3. GCC
- 4.4. North Africa
- 4.5. South Africa
- 4.6. Rest of Middle East & Africa
-
5. Asia Pacific
- 5.1. China
- 5.2. India
- 5.3. Japan
- 5.4. South Korea
- 5.5. ASEAN
- 5.6. Oceania
- 5.7. Rest of Asia Pacific
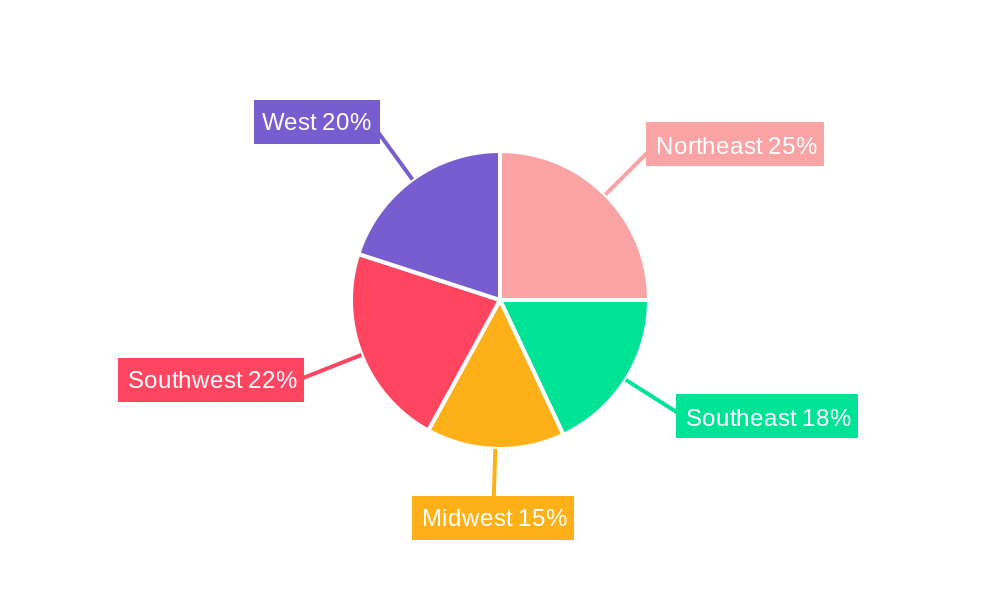
US Advanced Composites Industry Regional Market Share
Geographic Coverage of US Advanced Composites Industry
US Advanced Composites Industry REPORT HIGHLIGHTS
| Aspects | Details |
|---|---|
| Study Period | 2020-2034 |
| Base Year | 2025 |
| Estimated Year | 2026 |
| Forecast Period | 2026-2034 |
| Historical Period | 2020-2025 |
| Growth Rate | CAGR of 8.9% from 2020-2034 |
| Segmentation |
|
Table of Contents
- 1. Introduction
- 1.1. Research Scope
- 1.2. Market Segmentation
- 1.3. Research Objective
- 1.4. Definitions and Assumptions
- 2. Executive Summary
- 2.1. Market Snapshot
- 3. Market Dynamics
- 3.1. Market Drivers
- 3.2. Market Restrains
- 3.3. Market Trends
- 3.4. Market Opportunities
- 4. Market Factor Analysis
- 4.1. Porters Five Forces
- 4.1.1. Bargaining Power of Suppliers
- 4.1.2. Bargaining Power of Buyers
- 4.1.3. Threat of New Entrants
- 4.1.4. Threat of Substitutes
- 4.1.5. Competitive Rivalry
- 4.2. PESTEL analysis
- 4.3. BCG Analysis
- 4.3.1. Stars (High Growth, High Market Share)
- 4.3.2. Cash Cows (Low Growth, High Market Share)
- 4.3.3. Question Mark (High Growth, Low Market Share)
- 4.3.4. Dogs (Low Growth, Low Market Share)
- 4.4. Ansoff Matrix Analysis
- 4.5. Supply Chain Analysis
- 4.6. Regulatory Landscape
- 4.7. Current Market Potential and Opportunity Assessment (TAM–SAM–SOM Framework)
- 4.8. VDR Analyst Note
- 4.1. Porters Five Forces
- 5. Market Analysis, Insights and Forecast 2021-2033
- 5.1. Market Analysis, Insights and Forecast - by Productino Type
- 5.1.1. Hand Layup
- 5.1.2. Resin Transfer Molding
- 5.1.3. Vacuum Infusion Processing
- 5.1.4. Injection Molding
- 5.1.5. Compression Molding
- 5.2. Market Analysis, Insights and Forecast - by Material Type
- 5.2.1. Thermoset Polymer
- 5.2.2. Thermoplastic Polymer
- 5.2.3. Carbon Fiber
- 5.2.4. Glass Fiber
- 5.2.5. Others
- 5.3. Market Analysis, Insights and Forecast - by Application Type
- 5.3.1. Structural Assembly
- 5.3.2. Power Train Components
- 5.3.3. Interior
- 5.3.4. Exterior
- 5.3.5. Others
- 5.4. Market Analysis, Insights and Forecast - by Region
- 5.4.1. North America
- 5.4.2. South America
- 5.4.3. Europe
- 5.4.4. Middle East & Africa
- 5.4.5. Asia Pacific
- 5.1. Market Analysis, Insights and Forecast - by Productino Type
- 6. Global US Advanced Composites Industry Analysis, Insights and Forecast, 2021-2033
- 6.1. Market Analysis, Insights and Forecast - by Productino Type
- 6.1.1. Hand Layup
- 6.1.2. Resin Transfer Molding
- 6.1.3. Vacuum Infusion Processing
- 6.1.4. Injection Molding
- 6.1.5. Compression Molding
- 6.2. Market Analysis, Insights and Forecast - by Material Type
- 6.2.1. Thermoset Polymer
- 6.2.2. Thermoplastic Polymer
- 6.2.3. Carbon Fiber
- 6.2.4. Glass Fiber
- 6.2.5. Others
- 6.3. Market Analysis, Insights and Forecast - by Application Type
- 6.3.1. Structural Assembly
- 6.3.2. Power Train Components
- 6.3.3. Interior
- 6.3.4. Exterior
- 6.3.5. Others
- 6.1. Market Analysis, Insights and Forecast - by Productino Type
- 7. North America US Advanced Composites Industry Analysis, Insights and Forecast, 2021-2033
- 7.1. Market Analysis, Insights and Forecast - by Productino Type
- 7.1.1. Hand Layup
- 7.1.2. Resin Transfer Molding
- 7.1.3. Vacuum Infusion Processing
- 7.1.4. Injection Molding
- 7.1.5. Compression Molding
- 7.2. Market Analysis, Insights and Forecast - by Material Type
- 7.2.1. Thermoset Polymer
- 7.2.2. Thermoplastic Polymer
- 7.2.3. Carbon Fiber
- 7.2.4. Glass Fiber
- 7.2.5. Others
- 7.3. Market Analysis, Insights and Forecast - by Application Type
- 7.3.1. Structural Assembly
- 7.3.2. Power Train Components
- 7.3.3. Interior
- 7.3.4. Exterior
- 7.3.5. Others
- 7.1. Market Analysis, Insights and Forecast - by Productino Type
- 8. South America US Advanced Composites Industry Analysis, Insights and Forecast, 2021-2033
- 8.1. Market Analysis, Insights and Forecast - by Productino Type
- 8.1.1. Hand Layup
- 8.1.2. Resin Transfer Molding
- 8.1.3. Vacuum Infusion Processing
- 8.1.4. Injection Molding
- 8.1.5. Compression Molding
- 8.2. Market Analysis, Insights and Forecast - by Material Type
- 8.2.1. Thermoset Polymer
- 8.2.2. Thermoplastic Polymer
- 8.2.3. Carbon Fiber
- 8.2.4. Glass Fiber
- 8.2.5. Others
- 8.3. Market Analysis, Insights and Forecast - by Application Type
- 8.3.1. Structural Assembly
- 8.3.2. Power Train Components
- 8.3.3. Interior
- 8.3.4. Exterior
- 8.3.5. Others
- 8.1. Market Analysis, Insights and Forecast - by Productino Type
- 9. Europe US Advanced Composites Industry Analysis, Insights and Forecast, 2021-2033
- 9.1. Market Analysis, Insights and Forecast - by Productino Type
- 9.1.1. Hand Layup
- 9.1.2. Resin Transfer Molding
- 9.1.3. Vacuum Infusion Processing
- 9.1.4. Injection Molding
- 9.1.5. Compression Molding
- 9.2. Market Analysis, Insights and Forecast - by Material Type
- 9.2.1. Thermoset Polymer
- 9.2.2. Thermoplastic Polymer
- 9.2.3. Carbon Fiber
- 9.2.4. Glass Fiber
- 9.2.5. Others
- 9.3. Market Analysis, Insights and Forecast - by Application Type
- 9.3.1. Structural Assembly
- 9.3.2. Power Train Components
- 9.3.3. Interior
- 9.3.4. Exterior
- 9.3.5. Others
- 9.1. Market Analysis, Insights and Forecast - by Productino Type
- 10. Middle East & Africa US Advanced Composites Industry Analysis, Insights and Forecast, 2021-2033
- 10.1. Market Analysis, Insights and Forecast - by Productino Type
- 10.1.1. Hand Layup
- 10.1.2. Resin Transfer Molding
- 10.1.3. Vacuum Infusion Processing
- 10.1.4. Injection Molding
- 10.1.5. Compression Molding
- 10.2. Market Analysis, Insights and Forecast - by Material Type
- 10.2.1. Thermoset Polymer
- 10.2.2. Thermoplastic Polymer
- 10.2.3. Carbon Fiber
- 10.2.4. Glass Fiber
- 10.2.5. Others
- 10.3. Market Analysis, Insights and Forecast - by Application Type
- 10.3.1. Structural Assembly
- 10.3.2. Power Train Components
- 10.3.3. Interior
- 10.3.4. Exterior
- 10.3.5. Others
- 10.1. Market Analysis, Insights and Forecast - by Productino Type
- 11. Asia Pacific US Advanced Composites Industry Analysis, Insights and Forecast, 2021-2033
- 11.1. Market Analysis, Insights and Forecast - by Productino Type
- 11.1.1. Hand Layup
- 11.1.2. Resin Transfer Molding
- 11.1.3. Vacuum Infusion Processing
- 11.1.4. Injection Molding
- 11.1.5. Compression Molding
- 11.2. Market Analysis, Insights and Forecast - by Material Type
- 11.2.1. Thermoset Polymer
- 11.2.2. Thermoplastic Polymer
- 11.2.3. Carbon Fiber
- 11.2.4. Glass Fiber
- 11.2.5. Others
- 11.3. Market Analysis, Insights and Forecast - by Application Type
- 11.3.1. Structural Assembly
- 11.3.2. Power Train Components
- 11.3.3. Interior
- 11.3.4. Exterior
- 11.3.5. Others
- 11.1. Market Analysis, Insights and Forecast - by Productino Type
- 12. Competitive Analysis
- 12.1. Company Profiles
- 12.1.1 Nippo Sheet Glass Co Ltd
- 12.1.1.1. Company Overview
- 12.1.1.2. Products
- 12.1.1.3. Company Financials
- 12.1.1.4. SWOT Analysis
- 12.1.2 3B Fiberglass
- 12.1.2.1. Company Overview
- 12.1.2.2. Products
- 12.1.2.3. Company Financials
- 12.1.2.4. SWOT Analysis
- 12.1.3 Teijin Limite
- 12.1.3.1. Company Overview
- 12.1.3.2. Products
- 12.1.3.3. Company Financials
- 12.1.3.4. SWOT Analysis
- 12.1.4 BASF
- 12.1.4.1. Company Overview
- 12.1.4.2. Products
- 12.1.4.3. Company Financials
- 12.1.4.4. SWOT Analysis
- 12.1.5 Toray Industries Inc
- 12.1.5.1. Company Overview
- 12.1.5.2. Products
- 12.1.5.3. Company Financials
- 12.1.5.4. SWOT Analysis
- 12.1.6 General Motors Company
- 12.1.6.1. Company Overview
- 12.1.6.2. Products
- 12.1.6.3. Company Financials
- 12.1.6.4. SWOT Analysis
- 12.1.7 Base Group
- 12.1.7.1. Company Overview
- 12.1.7.2. Products
- 12.1.7.3. Company Financials
- 12.1.7.4. SWOT Analysis
- 12.1.8 Cytec Industries Inc
- 12.1.8.1. Company Overview
- 12.1.8.2. Products
- 12.1.8.3. Company Financials
- 12.1.8.4. SWOT Analysis
- 12.1.9 BMW
- 12.1.9.1. Company Overview
- 12.1.9.2. Products
- 12.1.9.3. Company Financials
- 12.1.9.4. SWOT Analysis
- 12.1.10 Delphi Auto
- 12.1.10.1. Company Overview
- 12.1.10.2. Products
- 12.1.10.3. Company Financials
- 12.1.10.4. SWOT Analysis
- 12.1.11 SGL Group
- 12.1.11.1. Company Overview
- 12.1.11.2. Products
- 12.1.11.3. Company Financials
- 12.1.11.4. SWOT Analysis
- 12.1.1 Nippo Sheet Glass Co Ltd
- 12.2. Market Entropy
- 12.2.1 Company's Key Areas Served
- 12.2.2 Recent Developments
- 12.3. Company Market Share Analysis 2025
- 12.3.1 Top 5 Companies Market Share Analysis
- 12.3.2 Top 3 Companies Market Share Analysis
- 12.4. List of Potential Customers
- 13. Research Methodology
List of Figures
- Figure 1: Global US Advanced Composites Industry Revenue Breakdown (billion, %) by Region 2025 & 2033
- Figure 2: North America US Advanced Composites Industry Revenue (billion), by Productino Type 2025 & 2033
- Figure 3: North America US Advanced Composites Industry Revenue Share (%), by Productino Type 2025 & 2033
- Figure 4: North America US Advanced Composites Industry Revenue (billion), by Material Type 2025 & 2033
- Figure 5: North America US Advanced Composites Industry Revenue Share (%), by Material Type 2025 & 2033
- Figure 6: North America US Advanced Composites Industry Revenue (billion), by Application Type 2025 & 2033
- Figure 7: North America US Advanced Composites Industry Revenue Share (%), by Application Type 2025 & 2033
- Figure 8: North America US Advanced Composites Industry Revenue (billion), by Country 2025 & 2033
- Figure 9: North America US Advanced Composites Industry Revenue Share (%), by Country 2025 & 2033
- Figure 10: South America US Advanced Composites Industry Revenue (billion), by Productino Type 2025 & 2033
- Figure 11: South America US Advanced Composites Industry Revenue Share (%), by Productino Type 2025 & 2033
- Figure 12: South America US Advanced Composites Industry Revenue (billion), by Material Type 2025 & 2033
- Figure 13: South America US Advanced Composites Industry Revenue Share (%), by Material Type 2025 & 2033
- Figure 14: South America US Advanced Composites Industry Revenue (billion), by Application Type 2025 & 2033
- Figure 15: South America US Advanced Composites Industry Revenue Share (%), by Application Type 2025 & 2033
- Figure 16: South America US Advanced Composites Industry Revenue (billion), by Country 2025 & 2033
- Figure 17: South America US Advanced Composites Industry Revenue Share (%), by Country 2025 & 2033
- Figure 18: Europe US Advanced Composites Industry Revenue (billion), by Productino Type 2025 & 2033
- Figure 19: Europe US Advanced Composites Industry Revenue Share (%), by Productino Type 2025 & 2033
- Figure 20: Europe US Advanced Composites Industry Revenue (billion), by Material Type 2025 & 2033
- Figure 21: Europe US Advanced Composites Industry Revenue Share (%), by Material Type 2025 & 2033
- Figure 22: Europe US Advanced Composites Industry Revenue (billion), by Application Type 2025 & 2033
- Figure 23: Europe US Advanced Composites Industry Revenue Share (%), by Application Type 2025 & 2033
- Figure 24: Europe US Advanced Composites Industry Revenue (billion), by Country 2025 & 2033
- Figure 25: Europe US Advanced Composites Industry Revenue Share (%), by Country 2025 & 2033
- Figure 26: Middle East & Africa US Advanced Composites Industry Revenue (billion), by Productino Type 2025 & 2033
- Figure 27: Middle East & Africa US Advanced Composites Industry Revenue Share (%), by Productino Type 2025 & 2033
- Figure 28: Middle East & Africa US Advanced Composites Industry Revenue (billion), by Material Type 2025 & 2033
- Figure 29: Middle East & Africa US Advanced Composites Industry Revenue Share (%), by Material Type 2025 & 2033
- Figure 30: Middle East & Africa US Advanced Composites Industry Revenue (billion), by Application Type 2025 & 2033
- Figure 31: Middle East & Africa US Advanced Composites Industry Revenue Share (%), by Application Type 2025 & 2033
- Figure 32: Middle East & Africa US Advanced Composites Industry Revenue (billion), by Country 2025 & 2033
- Figure 33: Middle East & Africa US Advanced Composites Industry Revenue Share (%), by Country 2025 & 2033
- Figure 34: Asia Pacific US Advanced Composites Industry Revenue (billion), by Productino Type 2025 & 2033
- Figure 35: Asia Pacific US Advanced Composites Industry Revenue Share (%), by Productino Type 2025 & 2033
- Figure 36: Asia Pacific US Advanced Composites Industry Revenue (billion), by Material Type 2025 & 2033
- Figure 37: Asia Pacific US Advanced Composites Industry Revenue Share (%), by Material Type 2025 & 2033
- Figure 38: Asia Pacific US Advanced Composites Industry Revenue (billion), by Application Type 2025 & 2033
- Figure 39: Asia Pacific US Advanced Composites Industry Revenue Share (%), by Application Type 2025 & 2033
- Figure 40: Asia Pacific US Advanced Composites Industry Revenue (billion), by Country 2025 & 2033
- Figure 41: Asia Pacific US Advanced Composites Industry Revenue Share (%), by Country 2025 & 2033
List of Tables
- Table 1: Global US Advanced Composites Industry Revenue billion Forecast, by Productino Type 2020 & 2033
- Table 2: Global US Advanced Composites Industry Revenue billion Forecast, by Material Type 2020 & 2033
- Table 3: Global US Advanced Composites Industry Revenue billion Forecast, by Application Type 2020 & 2033
- Table 4: Global US Advanced Composites Industry Revenue billion Forecast, by Region 2020 & 2033
- Table 5: Global US Advanced Composites Industry Revenue billion Forecast, by Productino Type 2020 & 2033
- Table 6: Global US Advanced Composites Industry Revenue billion Forecast, by Material Type 2020 & 2033
- Table 7: Global US Advanced Composites Industry Revenue billion Forecast, by Application Type 2020 & 2033
- Table 8: Global US Advanced Composites Industry Revenue billion Forecast, by Country 2020 & 2033
- Table 9: United States US Advanced Composites Industry Revenue (billion) Forecast, by Application 2020 & 2033
- Table 10: Canada US Advanced Composites Industry Revenue (billion) Forecast, by Application 2020 & 2033
- Table 11: Mexico US Advanced Composites Industry Revenue (billion) Forecast, by Application 2020 & 2033
- Table 12: Global US Advanced Composites Industry Revenue billion Forecast, by Productino Type 2020 & 2033
- Table 13: Global US Advanced Composites Industry Revenue billion Forecast, by Material Type 2020 & 2033
- Table 14: Global US Advanced Composites Industry Revenue billion Forecast, by Application Type 2020 & 2033
- Table 15: Global US Advanced Composites Industry Revenue billion Forecast, by Country 2020 & 2033
- Table 16: Brazil US Advanced Composites Industry Revenue (billion) Forecast, by Application 2020 & 2033
- Table 17: Argentina US Advanced Composites Industry Revenue (billion) Forecast, by Application 2020 & 2033
- Table 18: Rest of South America US Advanced Composites Industry Revenue (billion) Forecast, by Application 2020 & 2033
- Table 19: Global US Advanced Composites Industry Revenue billion Forecast, by Productino Type 2020 & 2033
- Table 20: Global US Advanced Composites Industry Revenue billion Forecast, by Material Type 2020 & 2033
- Table 21: Global US Advanced Composites Industry Revenue billion Forecast, by Application Type 2020 & 2033
- Table 22: Global US Advanced Composites Industry Revenue billion Forecast, by Country 2020 & 2033
- Table 23: United Kingdom US Advanced Composites Industry Revenue (billion) Forecast, by Application 2020 & 2033
- Table 24: Germany US Advanced Composites Industry Revenue (billion) Forecast, by Application 2020 & 2033
- Table 25: France US Advanced Composites Industry Revenue (billion) Forecast, by Application 2020 & 2033
- Table 26: Italy US Advanced Composites Industry Revenue (billion) Forecast, by Application 2020 & 2033
- Table 27: Spain US Advanced Composites Industry Revenue (billion) Forecast, by Application 2020 & 2033
- Table 28: Russia US Advanced Composites Industry Revenue (billion) Forecast, by Application 2020 & 2033
- Table 29: Benelux US Advanced Composites Industry Revenue (billion) Forecast, by Application 2020 & 2033
- Table 30: Nordics US Advanced Composites Industry Revenue (billion) Forecast, by Application 2020 & 2033
- Table 31: Rest of Europe US Advanced Composites Industry Revenue (billion) Forecast, by Application 2020 & 2033
- Table 32: Global US Advanced Composites Industry Revenue billion Forecast, by Productino Type 2020 & 2033
- Table 33: Global US Advanced Composites Industry Revenue billion Forecast, by Material Type 2020 & 2033
- Table 34: Global US Advanced Composites Industry Revenue billion Forecast, by Application Type 2020 & 2033
- Table 35: Global US Advanced Composites Industry Revenue billion Forecast, by Country 2020 & 2033
- Table 36: Turkey US Advanced Composites Industry Revenue (billion) Forecast, by Application 2020 & 2033
- Table 37: Israel US Advanced Composites Industry Revenue (billion) Forecast, by Application 2020 & 2033
- Table 38: GCC US Advanced Composites Industry Revenue (billion) Forecast, by Application 2020 & 2033
- Table 39: North Africa US Advanced Composites Industry Revenue (billion) Forecast, by Application 2020 & 2033
- Table 40: South Africa US Advanced Composites Industry Revenue (billion) Forecast, by Application 2020 & 2033
- Table 41: Rest of Middle East & Africa US Advanced Composites Industry Revenue (billion) Forecast, by Application 2020 & 2033
- Table 42: Global US Advanced Composites Industry Revenue billion Forecast, by Productino Type 2020 & 2033
- Table 43: Global US Advanced Composites Industry Revenue billion Forecast, by Material Type 2020 & 2033
- Table 44: Global US Advanced Composites Industry Revenue billion Forecast, by Application Type 2020 & 2033
- Table 45: Global US Advanced Composites Industry Revenue billion Forecast, by Country 2020 & 2033
- Table 46: China US Advanced Composites Industry Revenue (billion) Forecast, by Application 2020 & 2033
- Table 47: India US Advanced Composites Industry Revenue (billion) Forecast, by Application 2020 & 2033
- Table 48: Japan US Advanced Composites Industry Revenue (billion) Forecast, by Application 2020 & 2033
- Table 49: South Korea US Advanced Composites Industry Revenue (billion) Forecast, by Application 2020 & 2033
- Table 50: ASEAN US Advanced Composites Industry Revenue (billion) Forecast, by Application 2020 & 2033
- Table 51: Oceania US Advanced Composites Industry Revenue (billion) Forecast, by Application 2020 & 2033
- Table 52: Rest of Asia Pacific US Advanced Composites Industry Revenue (billion) Forecast, by Application 2020 & 2033
Frequently Asked Questions
1. What is the projected Compound Annual Growth Rate (CAGR) of the US Advanced Composites Industry?
The projected CAGR is approximately 8.9%.
2. Which companies are prominent players in the US Advanced Composites Industry?
Key companies in the market include Nippo Sheet Glass Co Ltd, 3B Fiberglass, Teijin Limite, BASF, Toray Industries Inc, General Motors Company, Base Group, Cytec Industries Inc, BMW, Delphi Auto, SGL Group.
3. What are the main segments of the US Advanced Composites Industry?
The market segments include Productino Type, Material Type, Application Type.
4. Can you provide details about the market size?
The market size is estimated to be USD 52.4 billion as of 2022.
5. What are some drivers contributing to market growth?
4.; Increasing demand from automobile industry4.; Increased focus on precision products.
6. What are the notable trends driving market growth?
Growing Demand for Lightweight Materials.
7. Are there any restraints impacting market growth?
4.; The cost of production and transportation4.; Regulations and quality standards.
8. Can you provide examples of recent developments in the market?
N/A
9. What pricing options are available for accessing the report?
Pricing options include single-user, multi-user, and enterprise licenses priced at USD 3800, USD 4500, and USD 5800 respectively.
10. Is the market size provided in terms of value or volume?
The market size is provided in terms of value, measured in billion.
11. Are there any specific market keywords associated with the report?
Yes, the market keyword associated with the report is "US Advanced Composites Industry," which aids in identifying and referencing the specific market segment covered.
12. How do I determine which pricing option suits my needs best?
The pricing options vary based on user requirements and access needs. Individual users may opt for single-user licenses, while businesses requiring broader access may choose multi-user or enterprise licenses for cost-effective access to the report.
13. Are there any additional resources or data provided in the US Advanced Composites Industry report?
While the report offers comprehensive insights, it's advisable to review the specific contents or supplementary materials provided to ascertain if additional resources or data are available.
14. How can I stay updated on further developments or reports in the US Advanced Composites Industry?
To stay informed about further developments, trends, and reports in the US Advanced Composites Industry, consider subscribing to industry newsletters, following relevant companies and organizations, or regularly checking reputable industry news sources and publications.
Methodology
Step 1 - Identification of Relevant Samples Size from Population Database


Step 2 - Approaches for Defining Global Market Size (Value, Volume* & Price*)

Note*: In applicable scenarios
Step 3 - Data Sources
Primary Research
- Web Analytics
- Survey Reports
- Research Institute
- Latest Research Reports
- Opinion Leaders
Secondary Research
- Annual Reports
- White Paper
- Latest Press Release
- Industry Association
- Paid Database
- Investor Presentations

Step 4 - Data Triangulation
Involves using different sources of information in order to increase the validity of a study
These sources are likely to be stakeholders in a program - participants, other researchers, program staff, other community members, and so on.
Then we put all data in single framework & apply various statistical tools to find out the dynamic on the market.
During the analysis stage, feedback from the stakeholder groups would be compared to determine areas of agreement as well as areas of divergence