

Key Insights
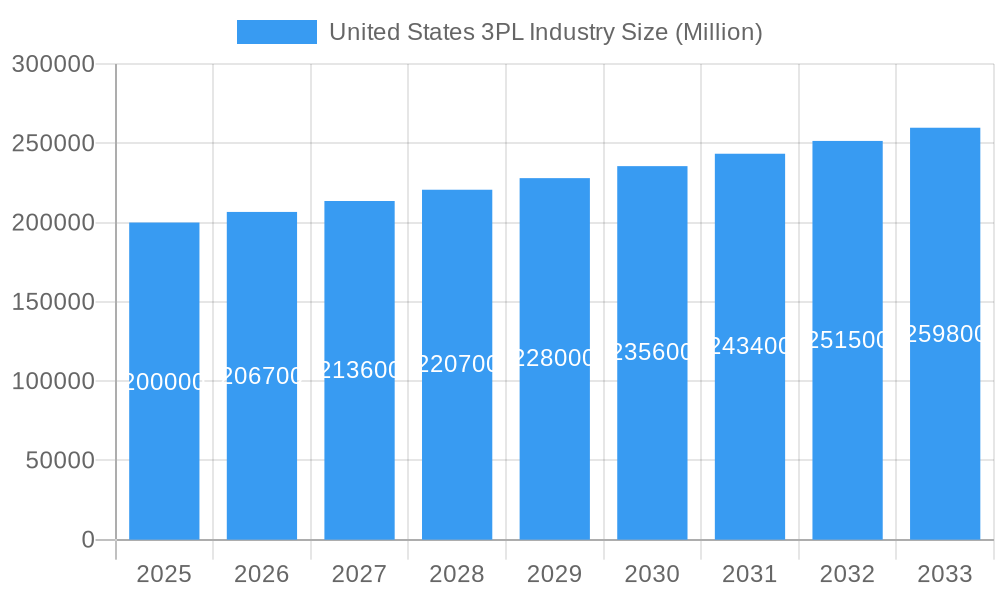
The United States 3PL (Third-Party Logistics) industry is a significant player in the global market, exhibiting robust growth driven by e-commerce expansion, supply chain complexities, and the increasing need for efficient logistics solutions. The market, valued at an estimated $200 billion in 2025 (assuming a proportional share of the global market based on US economic size), is projected to experience sustained growth, fueled by factors such as the rise of omnichannel retailing demanding faster delivery times and improved last-mile capabilities. Key segments within the US 3PL market, including domestic transportation management, international transportation management, and value-added warehousing and distribution, are all expected to contribute to this growth. The automotive, consumer and retail, and healthcare sectors are major end-users driving demand for 3PL services, reflecting their reliance on sophisticated supply chain management to maintain competitiveness and customer satisfaction. Furthermore, advancements in technology, such as automation and data analytics, are streamlining operations and improving efficiency, further bolstering the industry's growth trajectory.
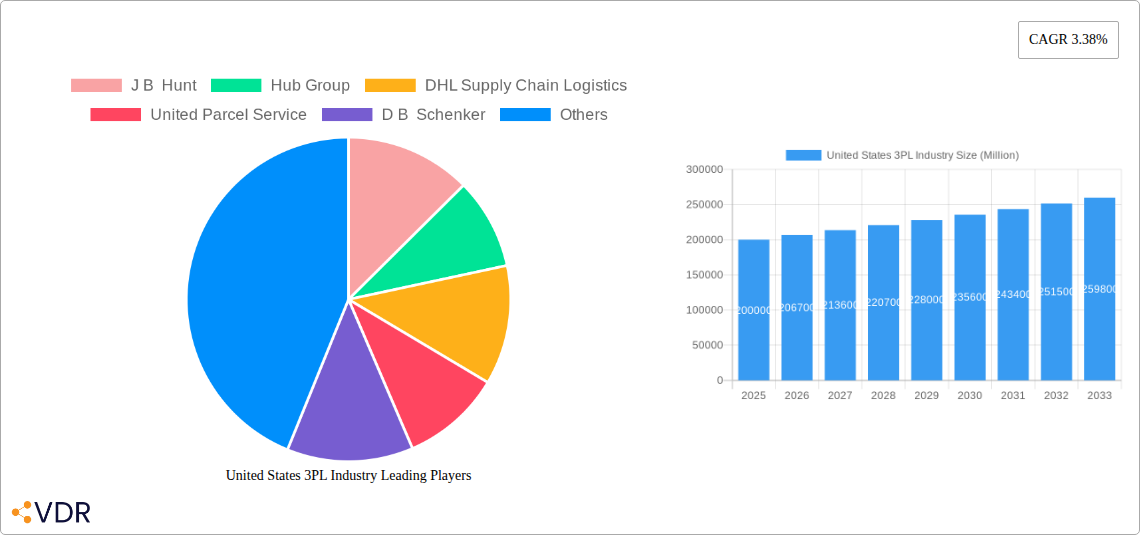
United States 3PL Industry Market Size (In Billion)
Looking ahead, the US 3PL industry faces both opportunities and challenges. The ongoing trend towards e-commerce necessitates investments in advanced technologies like AI-powered route optimization and drone delivery to meet rising consumer expectations. Simultaneously, managing escalating labor costs and navigating geopolitical uncertainties remain significant hurdles. However, the industry's adaptability and strategic alliances with technology providers are expected to mitigate these challenges. Continued consolidation among major players like J.B. Hunt, UPS, and FedEx, alongside the emergence of innovative niche players, will shape the competitive landscape. The forecast period of 2025-2033 anticipates continued expansion, with a projected CAGR slightly above the global average, reflecting the strong US economy and the ongoing importance of efficient logistics for businesses across various sectors.
United States 3PL Industry Company Market Share
United States 3PL Industry Market Report: 2019-2033
This comprehensive report provides an in-depth analysis of the United States 3PL (Third-Party Logistics) industry, covering market dynamics, growth trends, key players, and future outlook. The report utilizes data from 2019-2024 (Historical Period), with a base year of 2025 and a forecast period extending to 2033 (Study Period: 2019-2033; Forecast Period: 2025-2033). This crucial industry analysis is essential for businesses, investors, and stakeholders seeking to understand and navigate this dynamic market. The report segments the market by services (Domestic Transportation Management, International Transportation Management, Value-added Warehousing and Distribution) and end-users (Aerospace, Automotive, Consumer and Retail, Energy, Healthcare, Manufacturing, Technology, Other End Users).
United States 3PL Industry Market Dynamics & Structure
The US 3PL market is characterized by a complex interplay of factors influencing its structure and growth. Market concentration is relatively high, with a few major players dominating, yet numerous smaller firms specializing in niche services coexist. Technological innovation, particularly in areas such as automation, AI, and blockchain, is a significant driver, enhancing efficiency and transparency. Stringent regulatory frameworks, including those related to transportation safety and data privacy, shape industry practices. Competitive pressures from both established 3PLs and emerging tech-enabled startups are prevalent. Consolidation through mergers and acquisitions (M&A) is a recurring trend, resulting in increased scale and market share for larger companies.
- Market Concentration: The top 5 players hold an estimated xx% market share in 2025.
- M&A Activity: An estimated xx million USD worth of M&A deals occurred in the 2019-2024 period.
- Technological Innovation: Adoption of automation and AI is increasing efficiency by xx%.
- Regulatory Landscape: Compliance costs represent an estimated xx% of operating expenses for average 3PLs.
- Competitive Landscape: Intense competition drives pricing pressures and innovation.
United States 3PL Industry Growth Trends & Insights
The US 3PL market experienced significant growth in the 2019-2024 historical period, driven by the increasing outsourcing of logistics functions by businesses seeking to optimize supply chains and reduce operational costs. This trend is expected to continue, albeit at a potentially moderated pace, throughout the forecast period. Technological advancements, such as the Internet of Things (IoT) and advanced analytics, are accelerating adoption rates and impacting consumer behavior. E-commerce growth continues to be a primary driver, necessitating efficient and scalable logistics solutions.
- Market Size (2025): Estimated at xxx million USD
- CAGR (2025-2033): Projected at xx%
- Market Penetration: xx% of businesses currently outsource logistics.
- Technological Disruption: Increased automation driving productivity gains of xx% by 2033.
Dominant Regions, Countries, or Segments in United States 3PL Industry
The US 3PL market exhibits geographic diversity, with certain regions demonstrating higher growth rates than others. By service segment, value-added warehousing and distribution are expected to maintain dominance, driven by the need for specialized services such as inventory management, order fulfillment, and customized packaging. Within end-user sectors, consumer and retail, and manufacturing sectors exhibit the highest demand.
- Leading Region: The Northeast and Southeast regions are key growth drivers.
- Dominant Service Segment: Value-added warehousing and distribution commands the largest market share, projected at xx% in 2025.
- Largest End-User Segment: The Consumer & Retail sector accounts for an estimated xx% of the total market.
- Key Growth Drivers: Strong e-commerce growth and increasing demand for efficient supply chain solutions.
United States 3PL Industry Product Landscape
The US 3PL industry offers a wide array of services, ranging from basic transportation to comprehensive supply chain management solutions. Product innovation focuses on technology integration, including advanced warehouse management systems (WMS), transportation management systems (TMS), and real-time tracking and visibility platforms. These innovations enhance efficiency, transparency, and customer responsiveness, often incorporating AI and machine learning capabilities to optimize operations and predict demand. Unique selling propositions often revolve around specialized expertise, such as handling specific industry requirements (e.g., temperature-sensitive goods).
Key Drivers, Barriers & Challenges in United States 3PL Industry
Key Drivers: Growing e-commerce, increasing demand for supply chain optimization, technological advancements (automation, AI, IoT), and government investments in infrastructure.
Key Challenges: Labor shortages, rising fuel costs, supply chain disruptions, cybersecurity risks, and regulatory compliance complexities. These factors can potentially reduce profitability by xx% in the near term.
Emerging Opportunities in United States 3PL Industry
Emerging opportunities include the expansion of last-mile delivery solutions, specialized services catering to specific industry needs (e.g., healthcare logistics), and the adoption of sustainable logistics practices. Growth in cross-border e-commerce also presents significant opportunities for 3PL providers capable of handling international shipments and customs procedures.
Growth Accelerators in the United States 3PL Industry Industry
Long-term growth in the US 3PL industry will be driven by ongoing technological advancements, strategic partnerships between 3PLs and technology providers, and the expansion into new markets and service offerings. Government initiatives supporting infrastructure development and supply chain modernization will also contribute to growth.
Key Players Shaping the United States 3PL Industry Market
Notable Milestones in United States 3PL Industry Sector
- January 2022: J.B. Hunt acquires Zenith Freight Lines assets for USD 87 million, enhancing furniture delivery capabilities.
- January 2022: XPO Logistics opens two LTL terminals to expand customer service capacity.
- October 2021: XPO Logistics launches a 264-door terminal in Chicago Heights, Illinois.
- December 2021: DHL Supply Chain partners with TuSimple to implement autonomous trucking operations, reserving 100 autonomous trucks.
In-Depth United States 3PL Industry Market Outlook
The US 3PL industry is poised for sustained growth, driven by technological innovation, expanding e-commerce, and the increasing demand for efficient and resilient supply chains. Strategic partnerships, investments in automation, and expansion into new service areas will be crucial for companies seeking to capitalize on future market opportunities. The market is expected to exhibit robust growth throughout the forecast period, presenting significant opportunities for both established players and new entrants.
United States 3PL Industry Segmentation
-
1. Services
- 1.1. Domestic Transportation Management
- 1.2. International Transportation Management
- 1.3. Value-added Warehousing and Distribution
-
2. End User
- 2.1. Aerospace
- 2.2. Automotive
- 2.3. Consumer and Retail
- 2.4. Energy
- 2.5. Healthcare
- 2.6. Manufacturing
- 2.7. Technology
- 2.8. Other End Users
United States 3PL Industry Segmentation By Geography
- 1. United States
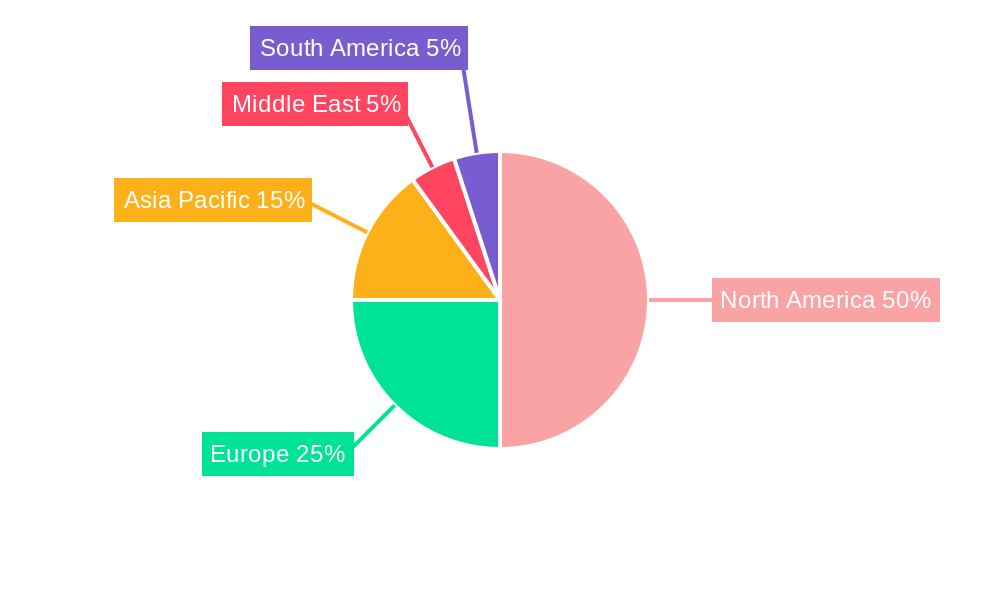
United States 3PL Industry Regional Market Share
Geographic Coverage of United States 3PL Industry
United States 3PL Industry REPORT HIGHLIGHTS
| Aspects | Details |
|---|---|
| Study Period | 2020-2034 |
| Base Year | 2025 |
| Estimated Year | 2026 |
| Forecast Period | 2026-2034 |
| Historical Period | 2020-2025 |
| Growth Rate | CAGR of 3.38% from 2020-2034 |
| Segmentation |
|
Table of Contents
- 1. Introduction
- 1.1. Research Scope
- 1.2. Market Segmentation
- 1.3. Research Objective
- 1.4. Definitions and Assumptions
- 2. Executive Summary
- 2.1. Market Snapshot
- 3. Market Dynamics
- 3.1. Market Drivers
- 3.2. Market Restrains
- 3.3. Market Trends
- 3.4. Market Opportunities
- 4. Market Factor Analysis
- 4.1. Porters Five Forces
- 4.1.1. Bargaining Power of Suppliers
- 4.1.2. Bargaining Power of Buyers
- 4.1.3. Threat of New Entrants
- 4.1.4. Threat of Substitutes
- 4.1.5. Competitive Rivalry
- 4.2. PESTEL analysis
- 4.3. BCG Analysis
- 4.3.1. Stars (High Growth, High Market Share)
- 4.3.2. Cash Cows (Low Growth, High Market Share)
- 4.3.3. Question Mark (High Growth, Low Market Share)
- 4.3.4. Dogs (Low Growth, Low Market Share)
- 4.4. Ansoff Matrix Analysis
- 4.5. Supply Chain Analysis
- 4.6. Regulatory Landscape
- 4.7. Current Market Potential and Opportunity Assessment (TAM–SAM–SOM Framework)
- 4.8. VDR Analyst Note
- 4.1. Porters Five Forces
- 5. Market Analysis, Insights and Forecast 2021-2033
- 5.1. Market Analysis, Insights and Forecast - by Services
- 5.1.1. Domestic Transportation Management
- 5.1.2. International Transportation Management
- 5.1.3. Value-added Warehousing and Distribution
- 5.2. Market Analysis, Insights and Forecast - by End User
- 5.2.1. Aerospace
- 5.2.2. Automotive
- 5.2.3. Consumer and Retail
- 5.2.4. Energy
- 5.2.5. Healthcare
- 5.2.6. Manufacturing
- 5.2.7. Technology
- 5.2.8. Other End Users
- 5.3. Market Analysis, Insights and Forecast - by Region
- 5.3.1. United States
- 5.1. Market Analysis, Insights and Forecast - by Services
- 6. United States 3PL Industry Analysis, Insights and Forecast, 2021-2033
- 6.1. Market Analysis, Insights and Forecast - by Services
- 6.1.1. Domestic Transportation Management
- 6.1.2. International Transportation Management
- 6.1.3. Value-added Warehousing and Distribution
- 6.2. Market Analysis, Insights and Forecast - by End User
- 6.2.1. Aerospace
- 6.2.2. Automotive
- 6.2.3. Consumer and Retail
- 6.2.4. Energy
- 6.2.5. Healthcare
- 6.2.6. Manufacturing
- 6.2.7. Technology
- 6.2.8. Other End Users
- 6.1. Market Analysis, Insights and Forecast - by Services
- 7. Competitive Analysis
- 7.1. Company Profiles
- 7.1.1 J B Hunt
- 7.1.1.1. Company Overview
- 7.1.1.2. Products
- 7.1.1.3. Company Financials
- 7.1.1.4. SWOT Analysis
- 7.1.2 Hub Group
- 7.1.2.1. Company Overview
- 7.1.2.2. Products
- 7.1.2.3. Company Financials
- 7.1.2.4. SWOT Analysis
- 7.1.3 DHL Supply Chain Logistics
- 7.1.3.1. Company Overview
- 7.1.3.2. Products
- 7.1.3.3. Company Financials
- 7.1.3.4. SWOT Analysis
- 7.1.4 United Parcel Service
- 7.1.4.1. Company Overview
- 7.1.4.2. Products
- 7.1.4.3. Company Financials
- 7.1.4.4. SWOT Analysis
- 7.1.5 D B Schenker
- 7.1.5.1. Company Overview
- 7.1.5.2. Products
- 7.1.5.3. Company Financials
- 7.1.5.4. SWOT Analysis
- 7.1.6 Ryder Supply Chain Solutions*List Not Exhaustive
- 7.1.6.1. Company Overview
- 7.1.6.2. Products
- 7.1.6.3. Company Financials
- 7.1.6.4. SWOT Analysis
- 7.1.7 XPO Logistics
- 7.1.7.1. Company Overview
- 7.1.7.2. Products
- 7.1.7.3. Company Financials
- 7.1.7.4. SWOT Analysis
- 7.1.8 Kuehne + Nagel
- 7.1.8.1. Company Overview
- 7.1.8.2. Products
- 7.1.8.3. Company Financials
- 7.1.8.4. SWOT Analysis
- 7.1.9 C H Robinson
- 7.1.9.1. Company Overview
- 7.1.9.2. Products
- 7.1.9.3. Company Financials
- 7.1.9.4. SWOT Analysis
- 7.1.10 Fedex
- 7.1.10.1. Company Overview
- 7.1.10.2. Products
- 7.1.10.3. Company Financials
- 7.1.10.4. SWOT Analysis
- 7.1.1 J B Hunt
- 7.2. Market Entropy
- 7.2.1 Company's Key Areas Served
- 7.2.2 Recent Developments
- 7.3. Company Market Share Analysis 2025
- 7.3.1 Top 5 Companies Market Share Analysis
- 7.3.2 Top 3 Companies Market Share Analysis
- 7.4. List of Potential Customers
- 8. Research Methodology
List of Figures
- Figure 1: United States 3PL Industry Revenue Breakdown (Million, %) by Product 2025 & 2033
- Figure 2: United States 3PL Industry Share (%) by Company 2025
List of Tables
- Table 1: United States 3PL Industry Revenue Million Forecast, by Services 2020 & 2033
- Table 2: United States 3PL Industry Revenue Million Forecast, by End User 2020 & 2033
- Table 3: United States 3PL Industry Revenue Million Forecast, by Region 2020 & 2033
- Table 4: United States 3PL Industry Revenue Million Forecast, by Services 2020 & 2033
- Table 5: United States 3PL Industry Revenue Million Forecast, by End User 2020 & 2033
- Table 6: United States 3PL Industry Revenue Million Forecast, by Country 2020 & 2033
Frequently Asked Questions
1. What is the projected Compound Annual Growth Rate (CAGR) of the United States 3PL Industry?
The projected CAGR is approximately 3.38%.
2. Which companies are prominent players in the United States 3PL Industry?
Key companies in the market include J B Hunt, Hub Group, DHL Supply Chain Logistics, United Parcel Service, D B Schenker, Ryder Supply Chain Solutions*List Not Exhaustive, XPO Logistics, Kuehne + Nagel, C H Robinson, Fedex.
3. What are the main segments of the United States 3PL Industry?
The market segments include Services, End User.
4. Can you provide details about the market size?
The market size is estimated to be USD 238.20 Million as of 2022.
5. What are some drivers contributing to market growth?
4.; Increasing production of chemical and allied products driving the market4.; Rising demand for green warehouses.
6. What are the notable trends driving market growth?
E-commerce Driving the 3PL Market.
7. Are there any restraints impacting market growth?
4.; Stringent Rules and Regulations4.; Higher Costs.
8. Can you provide examples of recent developments in the market?
In January 2022, J.B. Hunt announced that it was acquiring the assets of Zenith Freight Lines from Bassett Furniture Industries, a leading manufacturer of quality furniture. The acquisition is worth USD 87 million. From now on, J.B. Hunt will continue to provide the services for Bassett. This investment helps J.B. Hunt to enhance its furniture delivery capabilities by expanding nationwide.
9. What pricing options are available for accessing the report?
Pricing options include single-user, multi-user, and enterprise licenses priced at USD 3800, USD 4500, and USD 5800 respectively.
10. Is the market size provided in terms of value or volume?
The market size is provided in terms of value, measured in Million.
11. Are there any specific market keywords associated with the report?
Yes, the market keyword associated with the report is "United States 3PL Industry," which aids in identifying and referencing the specific market segment covered.
12. How do I determine which pricing option suits my needs best?
The pricing options vary based on user requirements and access needs. Individual users may opt for single-user licenses, while businesses requiring broader access may choose multi-user or enterprise licenses for cost-effective access to the report.
13. Are there any additional resources or data provided in the United States 3PL Industry report?
While the report offers comprehensive insights, it's advisable to review the specific contents or supplementary materials provided to ascertain if additional resources or data are available.
14. How can I stay updated on further developments or reports in the United States 3PL Industry?
To stay informed about further developments, trends, and reports in the United States 3PL Industry, consider subscribing to industry newsletters, following relevant companies and organizations, or regularly checking reputable industry news sources and publications.
Methodology
Step 1 - Identification of Relevant Samples Size from Population Database


Step 2 - Approaches for Defining Global Market Size (Value, Volume* & Price*)

Note*: In applicable scenarios
Step 3 - Data Sources
Primary Research
- Web Analytics
- Survey Reports
- Research Institute
- Latest Research Reports
- Opinion Leaders
Secondary Research
- Annual Reports
- White Paper
- Latest Press Release
- Industry Association
- Paid Database
- Investor Presentations

Step 4 - Data Triangulation
Involves using different sources of information in order to increase the validity of a study
These sources are likely to be stakeholders in a program - participants, other researchers, program staff, other community members, and so on.
Then we put all data in single framework & apply various statistical tools to find out the dynamic on the market.
During the analysis stage, feedback from the stakeholder groups would be compared to determine areas of agreement as well as areas of divergence