

Key Insights
The United Arab Emirates (UAE) cards industry is experiencing significant expansion, propelled by increasing digitalization, a robust e-commerce landscape, and a large, digitally proficient consumer base. The market is projected to reach a size of 150 billion by 2033, with a projected Compound Annual Growth Rate (CAGR) of 10.6% from the base year 2025. This growth is underpinned by widespread contactless payment adoption, government-backed financial inclusion initiatives, and a growing preference for secure and convenient payment methods among residents and tourists. While Point of Sale (POS) transactions remain dominant, online sales are rapidly ascending, signaling a decisive shift towards digital payment solutions. Key sectors like retail, entertainment, and hospitality are major drivers, reflecting the UAE's strong tourism and consumer spending. The UAE's advanced financial infrastructure and high card payment adoption rates position it as a dominant regional market player within the broader Asia Pacific region.
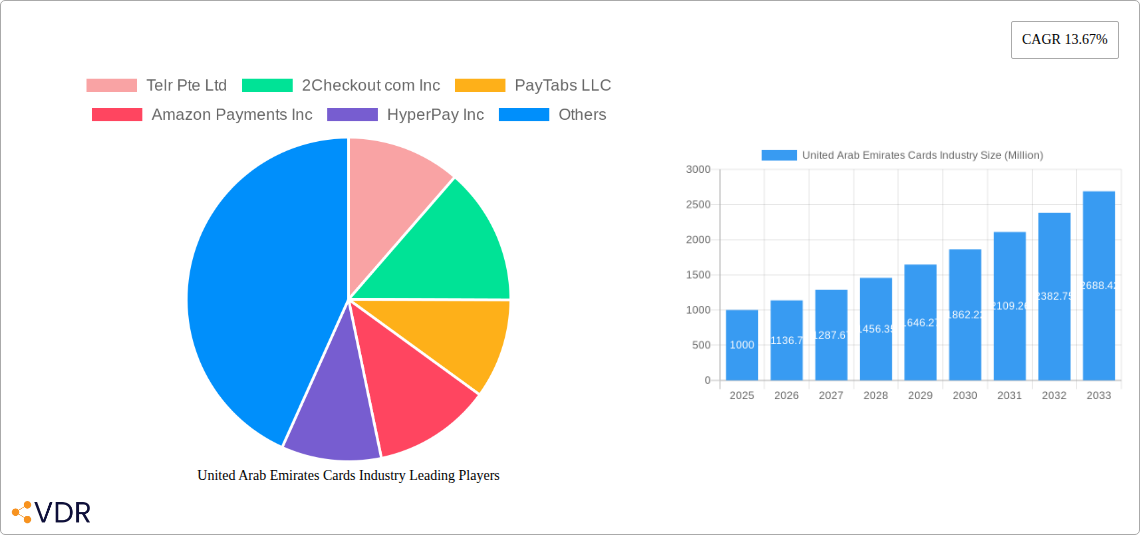
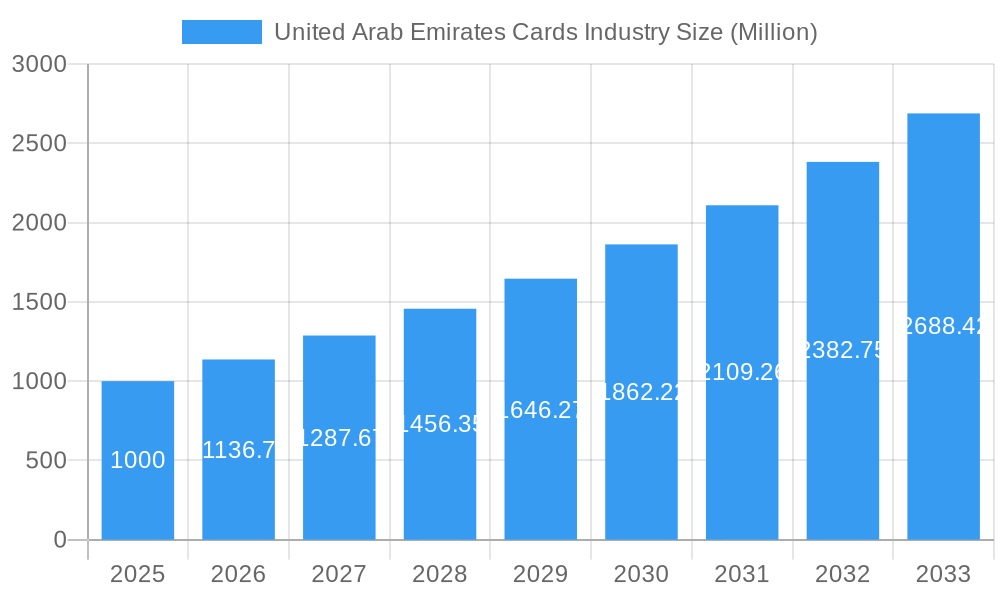
United Arab Emirates Cards Industry Market Size (In Billion)
The UAE cards industry is forecasted to sustain strong growth through 2033. Ongoing government investments in digital infrastructure, the proliferation of fintech solutions, and an increasing inclination towards cashless transactions are expected to fuel further expansion. Potential challenges include maintaining robust cybersecurity and fraud prevention measures amidst escalating digital transactions. Future market evolution will likely feature enhanced mobile payment solutions, deeper integration with loyalty programs, and the introduction of novel payment technologies. The diverse array of end-user industries, each with distinct payment needs, will foster opportunities for specialized solutions and market segmentation. The UAE's strategic geographic position and status as a regional economic hub will continue to attract domestic and international participants, ensuring sustained competition and ongoing sector advancement.
United Arab Emirates Cards Industry Company Market Share
United Arab Emirates Cards Industry Market Analysis: 2025-2033
This comprehensive report offers an in-depth analysis of the United Arab Emirates (UAE) cards industry, providing critical insights for industry professionals, investors, and strategic planners. Covering the period from 2025 to 2033, this report meticulously examines market dynamics, growth trends, key players, and future opportunities within this dynamic sector. The report segments the market by payment mode (Point of Sale, Online Sale) and end-user industry (Retail, Entertainment, Healthcare, Hospitality, Others), delivering a granular understanding of market performance across various segments.
United Arab Emirates Cards Industry Market Dynamics & Structure
This section analyzes the UAE cards industry's competitive landscape, technological advancements, regulatory environment, and market trends. We delve into market concentration, examining the market share held by key players like Telr Pte Ltd, 2Checkout com Inc, PayTabs LLC, Amazon Payments Inc, HyperPay Inc, PayCaps in, Stripe Inc, Infibeam Avenues Limited (CC Avenues), Checkout Ltd, and Cashu FZ LLC (list not exhaustive). The analysis includes:
- Market Concentration: The UAE cards market exhibits a [xx]% concentration ratio in 2025, with the top 5 players controlling approximately [xx]% of the market.
- Technological Innovation: The adoption of contactless payments, mobile wallets, and embedded finance solutions are key drivers of innovation. [xx]% of transactions are expected to be contactless by 2033.
- Regulatory Framework: The Central Bank of the UAE's regulatory framework significantly influences market growth and security.
- Competitive Substitutes: The emergence of alternative payment methods like Buy Now Pay Later (BNPL) poses a competitive challenge. [xx]% of consumers are predicted to utilize BNPL services by 2033.
- End-User Demographics: The young and tech-savvy population in the UAE fuels the high adoption rate of digital payment methods.
- M&A Trends: The number of M&A deals in the UAE cards industry averaged [xx] per year during the historical period (2019-2024), indicating a [xx]% increase compared to the preceding period.
United Arab Emirates Cards Industry Growth Trends & Insights
This section leverages [Data Source - e.g., Statista, IBISWorld, etc.] to provide a detailed analysis of the UAE cards market's growth trajectory. We examine market size evolution, adoption rates, technological disruptions, and evolving consumer behavior. Key metrics like CAGR and market penetration are presented to illustrate the market's dynamic nature. The UAE cards market is projected to reach [xx] Million in 2025, demonstrating a CAGR of [xx]% during the forecast period (2025-2033). This growth is attributed to [Detailed analysis of drivers including factors such as increasing digital adoption, government initiatives promoting cashless transactions, strong economic growth, and rising smartphone penetration.]
Dominant Regions, Countries, or Segments in United Arab Emirates Cards Industry
This section identifies the leading segments driving market growth. The analysis considers both payment modes (Point of Sale vs. Online Sale) and end-user industries.
- By Mode of Payment: Point of Sale (POS) transactions continue to dominate the market, accounting for [xx]% of total transactions in 2025, while online sales are rapidly expanding, projecting a [xx]% growth rate during the forecast period. Key drivers for online sales include the robust e-commerce sector and increasing preference for digital transactions.
- By End-user Industry: The Retail sector remains the largest segment, comprising [xx]% of the total market in 2025, followed by Hospitality ([xx]%) and Entertainment ([xx]%); however, the Healthcare and other end-user industries are expected to witness significant growth driven by increasing digitalization. The growth in these segments is fueled by factors including [Specific reasons for growth in these segments - Examples: government initiatives, investments in digital infrastructure, etc.].
United Arab Emirates Cards Industry Product Landscape
The UAE cards industry showcases a diverse range of products, from traditional debit/credit cards to innovative mobile wallets and contactless payment solutions. These solutions leverage advanced technologies like near-field communication (NFC) and biometric authentication, enhancing security and convenience. The market is witnessing the integration of AI and machine learning for fraud detection and personalized services. Unique selling propositions often focus on enhanced security features, seamless integration with existing systems, and loyalty programs.
Key Drivers, Barriers & Challenges in United Arab Emirates Cards Industry
Key Drivers:
- Increasing smartphone penetration and internet access.
- Government initiatives promoting cashless transactions.
- Growing e-commerce sector.
- Rise of Fintech companies.
Challenges:
- Cybersecurity threats and data breaches.
- Regulatory complexities and compliance requirements.
- Competition from alternative payment methods (e.g., cryptocurrencies).
- High transaction fees for merchants.
Emerging Opportunities in United Arab Emirates Cards Industry
Emerging opportunities in the UAE cards industry include:
- Expansion into untapped market segments (e.g., SMEs).
- Growing demand for embedded finance solutions.
- Development of innovative payment solutions tailored to specific industries.
- Increasing adoption of biometrics for secure authentication.
Growth Accelerators in the United Arab Emirates Cards Industry Industry
Long-term growth will be accelerated by technological advancements (e.g., blockchain technology, AI-powered fraud detection), strategic partnerships between established players and Fintech startups, and ongoing expansion into new markets and customer segments. Government support through favorable regulations and infrastructure development will further amplify this growth.
Key Players Shaping the United Arab Emirates Cards Industry Market
- Telr Pte Ltd
- 2Checkout com Inc
- PayTabs LLC
- Amazon Payments Inc
- HyperPay Inc
- PayCaps in
- Stripe Inc
- Infibeam Avenues Limited (CC Avenues)
- Checkout Ltd
- Cashu FZ LLC
Notable Milestones in United Arab Emirates Cards Industry Sector
- May 2022: Nayax Ltd partners with Network International, expanding its MEA reach.
- February 2022: Apple Inc. opens its fourth store in the UAE, boosting payment market activity.
In-Depth United Arab Emirates Cards Industry Market Outlook
The UAE cards industry is poised for sustained growth, driven by increasing digitalization, favorable government policies, and the burgeoning e-commerce sector. Strategic partnerships and technological innovation will play a pivotal role in shaping the future of this dynamic market. Significant opportunities exist for companies offering innovative payment solutions and tailored services to meet the evolving needs of consumers and businesses. The market is projected to reach [xx] Million by 2033, presenting lucrative opportunities for investment and expansion.
United Arab Emirates Cards Industry Segmentation
-
1. Mode of Payment
-
1.1. Point of Sale
- 1.1.1. Card Pay
- 1.1.2. Digital Wallet (includes Mobile Wallets)
- 1.1.3. Cash
- 1.1.4. Others
-
1.2. Online Sale
- 1.2.1. Others (
-
1.1. Point of Sale
-
2. End-user Industry
- 2.1. Retail
- 2.2. Entertainment
- 2.3. Healthcare
- 2.4. Hospitality
- 2.5. Other End-user Industries
United Arab Emirates Cards Industry Segmentation By Geography
- 1. United Arab Emirates
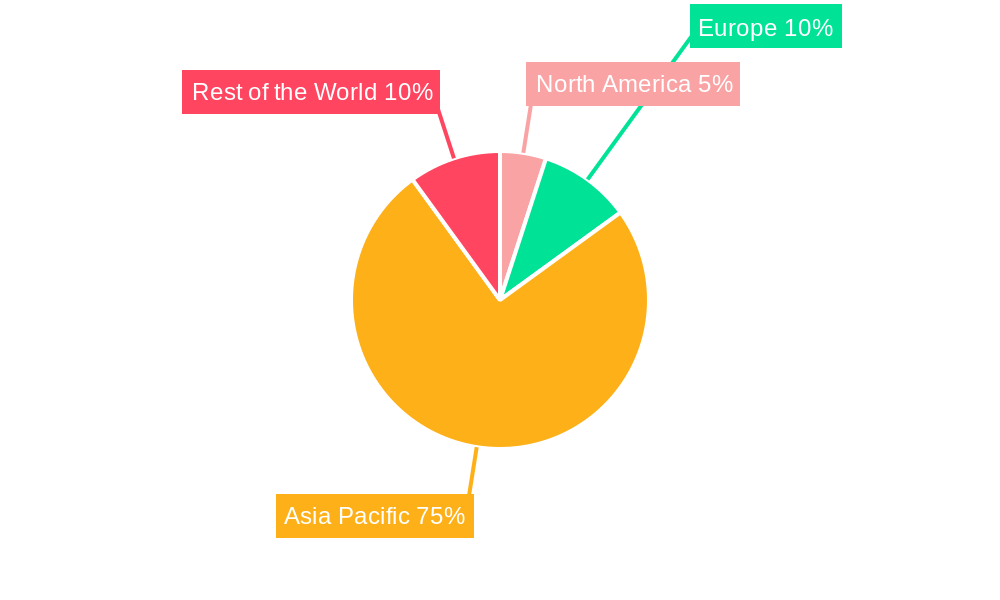
United Arab Emirates Cards Industry Regional Market Share
Geographic Coverage of United Arab Emirates Cards Industry
United Arab Emirates Cards Industry REPORT HIGHLIGHTS
| Aspects | Details |
|---|---|
| Study Period | 2020-2034 |
| Base Year | 2025 |
| Estimated Year | 2026 |
| Forecast Period | 2026-2034 |
| Historical Period | 2020-2025 |
| Growth Rate | CAGR of 10.6% from 2020-2034 |
| Segmentation |
|
Table of Contents
- 1. Introduction
- 1.1. Research Scope
- 1.2. Market Segmentation
- 1.3. Research Objective
- 1.4. Definitions and Assumptions
- 2. Executive Summary
- 2.1. Market Snapshot
- 3. Market Dynamics
- 3.1. Market Drivers
- 3.2. Market Restrains
- 3.3. Market Trends
- 3.4. Market Opportunities
- 4. Market Factor Analysis
- 4.1. Porters Five Forces
- 4.1.1. Bargaining Power of Suppliers
- 4.1.2. Bargaining Power of Buyers
- 4.1.3. Threat of New Entrants
- 4.1.4. Threat of Substitutes
- 4.1.5. Competitive Rivalry
- 4.2. PESTEL analysis
- 4.3. BCG Analysis
- 4.3.1. Stars (High Growth, High Market Share)
- 4.3.2. Cash Cows (Low Growth, High Market Share)
- 4.3.3. Question Mark (High Growth, Low Market Share)
- 4.3.4. Dogs (Low Growth, Low Market Share)
- 4.4. Ansoff Matrix Analysis
- 4.5. Supply Chain Analysis
- 4.6. Regulatory Landscape
- 4.7. Current Market Potential and Opportunity Assessment (TAM–SAM–SOM Framework)
- 4.8. VDR Analyst Note
- 4.1. Porters Five Forces
- 5. Market Analysis, Insights and Forecast 2021-2033
- 5.1. Market Analysis, Insights and Forecast - by Mode of Payment
- 5.1.1. Point of Sale
- 5.1.1.1. Card Pay
- 5.1.1.2. Digital Wallet (includes Mobile Wallets)
- 5.1.1.3. Cash
- 5.1.1.4. Others
- 5.1.2. Online Sale
- 5.1.2.1. Others (
- 5.1.1. Point of Sale
- 5.2. Market Analysis, Insights and Forecast - by End-user Industry
- 5.2.1. Retail
- 5.2.2. Entertainment
- 5.2.3. Healthcare
- 5.2.4. Hospitality
- 5.2.5. Other End-user Industries
- 5.3. Market Analysis, Insights and Forecast - by Region
- 5.3.1. United Arab Emirates
- 5.1. Market Analysis, Insights and Forecast - by Mode of Payment
- 6. United Arab Emirates Cards Industry Analysis, Insights and Forecast, 2021-2033
- 6.1. Market Analysis, Insights and Forecast - by Mode of Payment
- 6.1.1. Point of Sale
- 6.1.1.1. Card Pay
- 6.1.1.2. Digital Wallet (includes Mobile Wallets)
- 6.1.1.3. Cash
- 6.1.1.4. Others
- 6.1.2. Online Sale
- 6.1.2.1. Others (
- 6.1.1. Point of Sale
- 6.2. Market Analysis, Insights and Forecast - by End-user Industry
- 6.2.1. Retail
- 6.2.2. Entertainment
- 6.2.3. Healthcare
- 6.2.4. Hospitality
- 6.2.5. Other End-user Industries
- 6.1. Market Analysis, Insights and Forecast - by Mode of Payment
- 7. Competitive Analysis
- 7.1. Company Profiles
- 7.1.1 Telr Pte Ltd
- 7.1.1.1. Company Overview
- 7.1.1.2. Products
- 7.1.1.3. Company Financials
- 7.1.1.4. SWOT Analysis
- 7.1.2 2Checkout com Inc
- 7.1.2.1. Company Overview
- 7.1.2.2. Products
- 7.1.2.3. Company Financials
- 7.1.2.4. SWOT Analysis
- 7.1.3 PayTabs LLC
- 7.1.3.1. Company Overview
- 7.1.3.2. Products
- 7.1.3.3. Company Financials
- 7.1.3.4. SWOT Analysis
- 7.1.4 Amazon Payments Inc
- 7.1.4.1. Company Overview
- 7.1.4.2. Products
- 7.1.4.3. Company Financials
- 7.1.4.4. SWOT Analysis
- 7.1.5 HyperPay Inc
- 7.1.5.1. Company Overview
- 7.1.5.2. Products
- 7.1.5.3. Company Financials
- 7.1.5.4. SWOT Analysis
- 7.1.6 PayCaps in
- 7.1.6.1. Company Overview
- 7.1.6.2. Products
- 7.1.6.3. Company Financials
- 7.1.6.4. SWOT Analysis
- 7.1.7 Stripe Inc *List Not Exhaustive
- 7.1.7.1. Company Overview
- 7.1.7.2. Products
- 7.1.7.3. Company Financials
- 7.1.7.4. SWOT Analysis
- 7.1.8 Infibeam Avenues Limited (CC Avenues)
- 7.1.8.1. Company Overview
- 7.1.8.2. Products
- 7.1.8.3. Company Financials
- 7.1.8.4. SWOT Analysis
- 7.1.9 Checkout Ltd
- 7.1.9.1. Company Overview
- 7.1.9.2. Products
- 7.1.9.3. Company Financials
- 7.1.9.4. SWOT Analysis
- 7.1.10 Cashu FZ LLC
- 7.1.10.1. Company Overview
- 7.1.10.2. Products
- 7.1.10.3. Company Financials
- 7.1.10.4. SWOT Analysis
- 7.1.1 Telr Pte Ltd
- 7.2. Market Entropy
- 7.2.1 Company's Key Areas Served
- 7.2.2 Recent Developments
- 7.3. Company Market Share Analysis 2025
- 7.3.1 Top 5 Companies Market Share Analysis
- 7.3.2 Top 3 Companies Market Share Analysis
- 7.4. List of Potential Customers
- 8. Research Methodology
List of Figures
- Figure 1: United Arab Emirates Cards Industry Revenue Breakdown (billion, %) by Product 2025 & 2033
- Figure 2: United Arab Emirates Cards Industry Share (%) by Company 2025
List of Tables
- Table 1: United Arab Emirates Cards Industry Revenue billion Forecast, by Mode of Payment 2020 & 2033
- Table 2: United Arab Emirates Cards Industry Revenue billion Forecast, by End-user Industry 2020 & 2033
- Table 3: United Arab Emirates Cards Industry Revenue billion Forecast, by Region 2020 & 2033
- Table 4: United Arab Emirates Cards Industry Revenue billion Forecast, by Mode of Payment 2020 & 2033
- Table 5: United Arab Emirates Cards Industry Revenue billion Forecast, by End-user Industry 2020 & 2033
- Table 6: United Arab Emirates Cards Industry Revenue billion Forecast, by Country 2020 & 2033
Frequently Asked Questions
1. What is the projected Compound Annual Growth Rate (CAGR) of the United Arab Emirates Cards Industry?
The projected CAGR is approximately 10.6%.
2. Which companies are prominent players in the United Arab Emirates Cards Industry?
Key companies in the market include Telr Pte Ltd, 2Checkout com Inc, PayTabs LLC, Amazon Payments Inc, HyperPay Inc, PayCaps in, Stripe Inc *List Not Exhaustive, Infibeam Avenues Limited (CC Avenues), Checkout Ltd, Cashu FZ LLC.
3. What are the main segments of the United Arab Emirates Cards Industry?
The market segments include Mode of Payment, End-user Industry.
4. Can you provide details about the market size?
The market size is estimated to be USD 150 billion as of 2022.
5. What are some drivers contributing to market growth?
High Proliferation of E-commerce. including the rise of m-commerce and cross-border e-commerce supported by the increase in purchasing power; Enablement Programs by Key Retailers and Government encouraging digitization of the market; Growth of Real-time Payments. especially Buy Now Pay Later in the country.
6. What are the notable trends driving market growth?
Significant Growth in Payment is Expected due to Digital Transformation.
7. Are there any restraints impacting market growth?
Talent Shortages in Specific Technologies.
8. Can you provide examples of recent developments in the market?
In May 2022 - Nayax Ltd, a commerce enablement and payments platform, announced a partnership with Network International, the provider of digital commerce across the Middle-East and Africa (MEA). This partnership will help the company to expand its business and customer base in the MEA region.
9. What pricing options are available for accessing the report?
Pricing options include single-user, multi-user, and enterprise licenses priced at USD 3800, USD 4500, and USD 5800 respectively.
10. Is the market size provided in terms of value or volume?
The market size is provided in terms of value, measured in billion.
11. Are there any specific market keywords associated with the report?
Yes, the market keyword associated with the report is "United Arab Emirates Cards Industry," which aids in identifying and referencing the specific market segment covered.
12. How do I determine which pricing option suits my needs best?
The pricing options vary based on user requirements and access needs. Individual users may opt for single-user licenses, while businesses requiring broader access may choose multi-user or enterprise licenses for cost-effective access to the report.
13. Are there any additional resources or data provided in the United Arab Emirates Cards Industry report?
While the report offers comprehensive insights, it's advisable to review the specific contents or supplementary materials provided to ascertain if additional resources or data are available.
14. How can I stay updated on further developments or reports in the United Arab Emirates Cards Industry?
To stay informed about further developments, trends, and reports in the United Arab Emirates Cards Industry, consider subscribing to industry newsletters, following relevant companies and organizations, or regularly checking reputable industry news sources and publications.
Methodology
Step 1 - Identification of Relevant Samples Size from Population Database


Step 2 - Approaches for Defining Global Market Size (Value, Volume* & Price*)

Note*: In applicable scenarios
Step 3 - Data Sources
Primary Research
- Web Analytics
- Survey Reports
- Research Institute
- Latest Research Reports
- Opinion Leaders
Secondary Research
- Annual Reports
- White Paper
- Latest Press Release
- Industry Association
- Paid Database
- Investor Presentations

Step 4 - Data Triangulation
Involves using different sources of information in order to increase the validity of a study
These sources are likely to be stakeholders in a program - participants, other researchers, program staff, other community members, and so on.
Then we put all data in single framework & apply various statistical tools to find out the dynamic on the market.
During the analysis stage, feedback from the stakeholder groups would be compared to determine areas of agreement as well as areas of divergence