

Key Insights
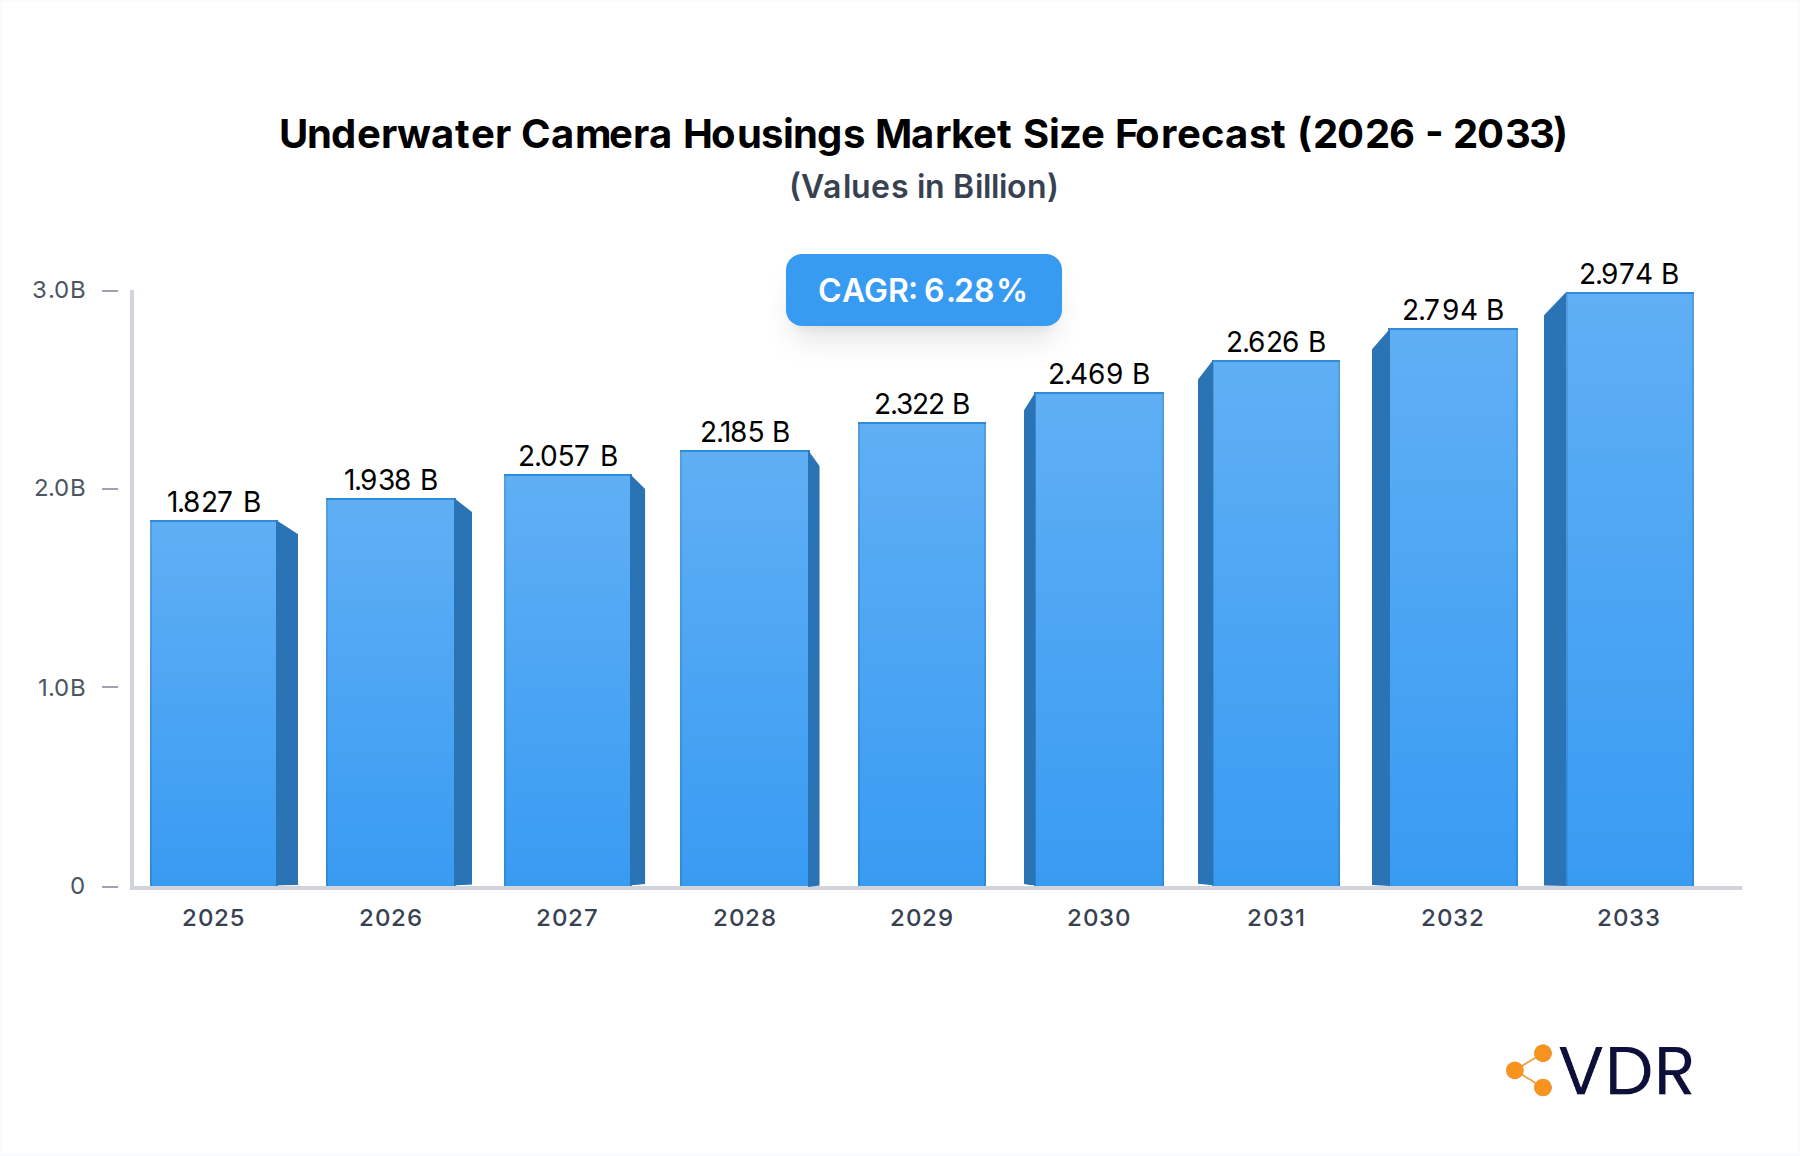
The global underwater camera housing market is poised for robust expansion, with a market size estimated at $1827 million in 2025, projected to grow at a significant CAGR of 6.1% through 2033. This impressive growth trajectory is fueled by a confluence of factors, including the burgeoning interest in underwater exploration and tourism, advancements in digital photography and videography, and the increasing accessibility of sophisticated diving equipment. The demand for high-quality, durable, and user-friendly camera housings is being driven by both professional underwater photographers and recreational enthusiasts seeking to capture the vibrant marine ecosystems. Key market drivers include the increasing adoption of action cameras and mirrorless cameras for underwater applications, coupled with the continuous innovation in materials and design, leading to lighter, more robust, and feature-rich housings. Furthermore, the growing popularity of underwater content creation for social media and documentary filmmaking is significantly contributing to market expansion.

Underwater Camera Housings Market Size (In Billion)
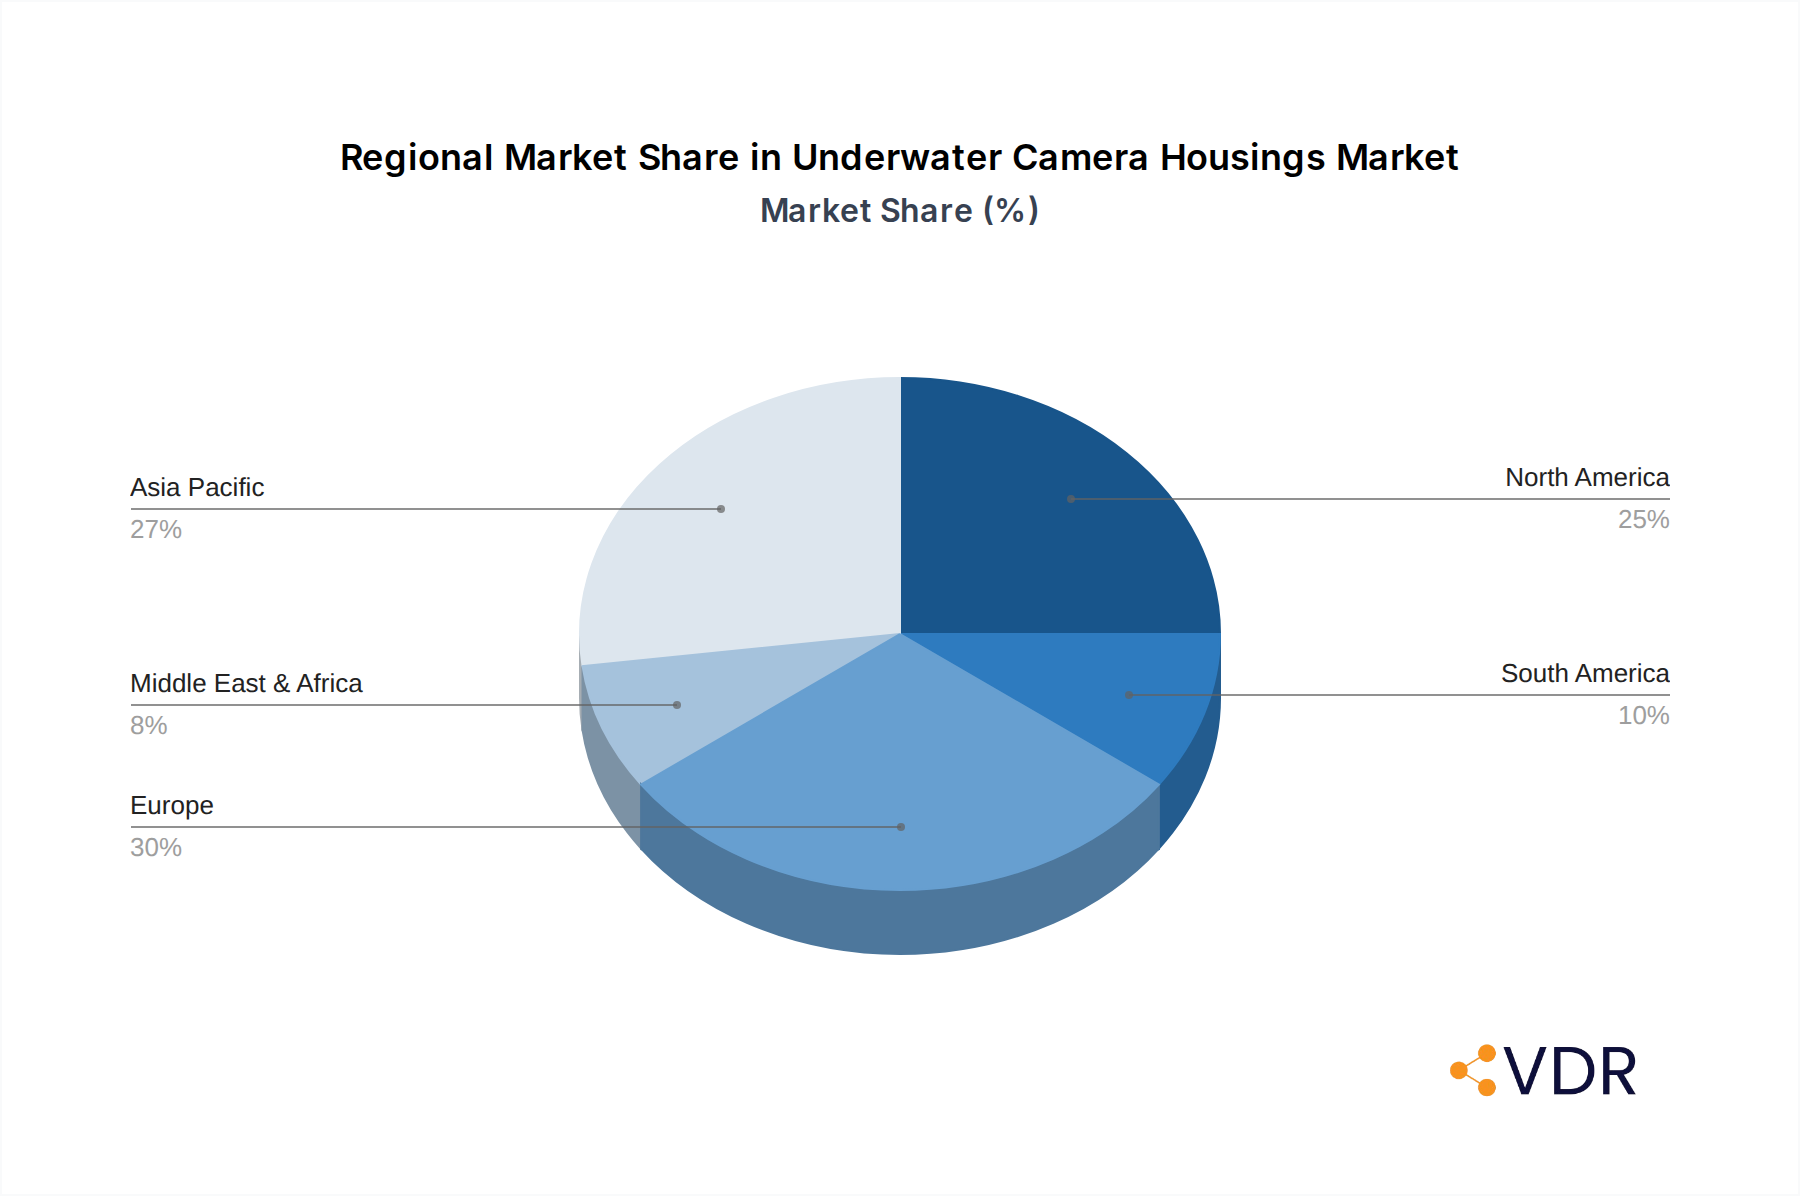
The market segmentation highlights distinct growth avenues. The "Online" application segment is expected to witness accelerated growth due to the increasing preference for e-commerce channels for purchasing specialized equipment, offering wider selection and competitive pricing. In terms of product types, both "Plastic Case" and "Metal Case" segments are anticipated to perform well. Plastic cases offer cost-effectiveness and portability, appealing to a broader consumer base, while metal cases provide superior durability and protection, catering to professional users and extreme conditions. Geographically, Asia Pacific, driven by the burgeoning tourism sector in countries like China and Southeast Asian nations, is expected to emerge as a significant growth region. North America and Europe, with their established diving communities and high disposable incomes, will continue to be major markets. Emerging trends like the integration of smart features and enhanced video capabilities in housings will further shape the market landscape, while the high cost of premium housings and stringent regulations in certain marine protected areas may present moderate challenges.
Underwater Camera Housings Company Market Share
Underwater Camera Housings Market Research Report: Comprehensive Analysis & Future Outlook (2019-2033)
This in-depth market research report provides a definitive analysis of the global Underwater Camera Housings market, examining its current state and forecasting its trajectory through 2033. Delving into crucial aspects such as market dynamics, growth trends, regional dominance, product landscape, and key player strategies, this report is an essential resource for industry professionals seeking to understand and capitalize on the evolving underwater imaging sector. The study encompasses a historical analysis from 2019 to 2024, a base year of 2025, and a comprehensive forecast period from 2025 to 2033, offering unparalleled insights into market evolution and strategic opportunities.
Underwater Camera Housings Market Dynamics & Structure
The global Underwater Camera Housings market exhibits a moderately consolidated structure, with a blend of established giants and agile niche players. Technological innovation serves as a primary driver, particularly in the development of housings for high-resolution digital cameras, action cameras like Insta360, and professional cinema setups. Regulatory frameworks, while less stringent than in some other tech sectors, often pertain to materials safety and durability standards for commercial and scientific applications. Competitive product substitutes, while not direct replacements, include ruggedized waterproof cameras that offer integrated solutions but with less flexibility and depth rating. End-user demographics are diverse, spanning recreational divers, underwater photographers, videographers, marine biologists, and industrial inspectors. Mergers and acquisitions (M&A) are infrequent but significant, often driven by companies seeking to expand their product portfolios or gain access to new technological advancements. For instance, a recent acquisition might involve a specialty housing manufacturer being integrated into a larger camera accessory company to leverage their distribution networks. The market concentration can be estimated at xx% by the top 5 players. M&A deal volumes in the historical period (2019-2024) are projected to be around xx million units. Barriers to innovation include the high cost of precision engineering, stringent material testing, and the need for constant adaptation to rapidly evolving camera technologies.
Underwater Camera Housings Growth Trends & Insights
The global Underwater Camera Housings market is poised for substantial growth, projected to expand from an estimated USD xx million units in 2025 to USD xx million units by 2033, exhibiting a Compound Annual Growth Rate (CAGR) of xx% during the forecast period. This robust expansion is fueled by a confluence of factors, including increasing participation in water sports and recreational diving globally, a rising demand for high-quality underwater content for tourism and media, and advancements in camera technology necessitating sophisticated housing solutions. The adoption rate of specialized underwater housings is steadily increasing, particularly among professional videographers and content creators who rely on robust and reliable equipment for capturing stunning underwater footage. Technological disruptions, such as the miniaturization of high-performance cameras and the integration of advanced features like AI-powered autofocus and image stabilization, are driving the demand for equally advanced and adaptable housings. Consumer behavior is shifting towards a greater appreciation for immersive visual experiences, leading to a higher willingness to invest in professional-grade underwater photography and videography gear. Market penetration for high-end metal housings is expected to grow by xx% over the forecast period. The increasing accessibility of advanced camera technology, coupled with a growing desire to explore and document the underwater world, creates a fertile ground for sustained market expansion. Furthermore, the burgeoning market for underwater drones and remote-operated vehicles (ROVs) also contributes to the demand for specialized housings and protective solutions. The estimated market size in 2019 was xx million units.
Dominant Regions, Countries, or Segments in Underwater Camera Housings
The Asia-Pacific region is emerging as a dominant force in the Underwater Camera Housings market, driven by a confluence of robust economic growth, a burgeoning middle class with increased disposable income, and a rapidly expanding tourism sector that actively promotes water-based activities. Countries like China, South Korea, and Southeast Asian nations are witnessing a significant surge in demand for both recreational and professional underwater imaging equipment. This regional dominance is further bolstered by government initiatives aimed at promoting tourism and marine conservation, which indirectly stimulate the demand for underwater exploration tools.
- Key Drivers in Asia-Pacific:
- Economic Policies: Favorable trade policies and government investment in tourism infrastructure.
- Infrastructure Development: Expansion of coastal resorts, diving centers, and marine parks.
- Rising Disposable Income: Increasing consumer spending power on recreational and adventure activities.
- Growing Popularity of Water Sports: Surging interest in diving, snorkeling, and other aquatic pursuits.
- Technological Adoption: Rapid embrace of advanced camera technologies and their accessories.
Within the application segment, Offline sales channels, comprising specialized dive shops, camera retailers, and direct sales from manufacturers, continue to hold a significant market share, particularly for high-end and professional-grade housings. However, the Online segment is experiencing exponential growth, driven by e-commerce platforms offering wider selection, competitive pricing, and convenient purchasing options. This online surge is particularly prevalent for plastic case housings and accessories, catering to a broader consumer base.
In terms of product types, Plastic Case housings dominate the market in terms of volume due to their affordability, lightweight nature, and suitability for entry-level and intermediate users. They represent a significant portion of the consumer market, especially for action cameras. However, Metal Case housings, predominantly crafted from aluminum alloys, command higher market value and are crucial for professional photographers and videographers who require superior durability, deeper depth ratings, and enhanced thermal management for high-end cameras. The market share for metal cases, while smaller in volume, is projected to grow at a faster CAGR (xx%) due to increasing demand for professional underwater cinematography and scientific research. The estimated market share for Plastic Case is xx%, and for Metal Case is xx%.
Underwater Camera Housings Product Landscape
The underwater camera housing market is characterized by continuous product innovation focused on enhanced durability, improved ergonomics, and greater compatibility with a wider range of camera models. Manufacturers are increasingly integrating advanced features such as sophisticated O-ring sealing systems, corrosion-resistant materials like anodized aluminum, and interchangeable port systems for different lenses. Innovations also include the development of integrated lighting solutions and vacuum leak detection systems, ensuring user confidence and equipment protection. The application of these housings spans recreational diving, professional underwater photography and videography, marine research, industrial inspection, and even film production. Unique selling propositions often revolve around depth ratings, build quality, lens port options, and the availability of specific accessories like external strobes and video lights. Technological advancements are leading to lighter, more compact, and more intuitive housing designs, making underwater imaging more accessible and versatile than ever before.
Key Drivers, Barriers & Challenges in Underwater Camera Housings
Key Drivers:
- Growing popularity of water sports and recreational diving: A consistent increase in individuals engaging in underwater activities directly fuels the demand for reliable camera protection.
- Advancements in digital camera technology: The development of high-resolution, feature-rich cameras necessitates equally sophisticated housings to protect them from water and pressure.
- Rising demand for underwater content: The proliferation of social media and online platforms drives the creation of compelling underwater photography and videography.
- Technological innovation in housing materials and design: Lighter, stronger, and more user-friendly housings expand market accessibility.
- Expansion of the adventure tourism sector: This sector actively promotes activities like diving and snorkeling, indirectly boosting the camera housing market.
Key Barriers & Challenges:
- High manufacturing costs: Precision engineering and specialized materials contribute to the premium pricing of many housings.
- Rapid camera model obsolescence: Manufacturers must constantly update housing designs to remain compatible with new camera releases, leading to significant R&D investment.
- Supply chain disruptions: Global events can impact the availability of specialized raw materials and components.
- Stringent testing and certification requirements: Ensuring housings meet depth and durability standards requires rigorous and often costly testing.
- Intense competition: A crowded market with numerous players leads to price pressures and the need for strong differentiation. For example, a xx% decrease in the cost of a key component could impact profit margins by xx%.
Emerging Opportunities in Underwater Camera Housings
Emerging opportunities in the underwater camera housings sector lie in the development of intelligent and connected housings, integrated with smart features for real-time monitoring and diagnostics. The growing demand for compact and modular housing systems that can be adapted for various camera types and applications presents another significant avenue. Furthermore, the burgeoning market for underwater drones and autonomous underwater vehicles (AUVs) opens up new possibilities for specialized protective enclosures. Untapped markets in emerging economies with growing interest in marine tourism and research also offer substantial growth potential. The evolution of virtual and augmented reality technologies may also lead to a demand for more advanced underwater imaging solutions for immersive content creation.
Growth Accelerators in the Underwater Camera Housings Industry
The long-term growth of the underwater camera housings industry is being significantly accelerated by several key factors. Technological breakthroughs in material science are enabling the creation of lighter, stronger, and more corrosion-resistant housings at potentially lower costs. The increasing integration of advanced electronics, such as advanced vacuum systems and integrated pressure sensors, enhances user confidence and operational reliability. Strategic partnerships between housing manufacturers and camera brands, as well as collaborations with underwater research institutions, are fostering innovation and expanding market reach. Furthermore, the continuous expansion of the global diving and marine tourism industry, coupled with a growing interest in marine conservation and exploration, provides a stable and expanding customer base. The development of specialized housings for niche applications like underwater filmmaking and scientific data acquisition also acts as a powerful growth accelerator.
Key Players Shaping the Underwater Camera Housings Market
- Divevolk
- Ikelite
- AquaTech
- Kraken Sports
- Nautismart
- Oceanic
- SeaLife Cameras
- Weefine
- Nauticam
- Seacam
- AOI OM
- Anglerfish Creative
- Aquatica Digital
- Atomos
- Fantasea
- Insta360
- Isotta
- Marelux
- Olympus
Notable Milestones in Underwater Camera Housings Sector
- 2019: Launch of advanced vacuum systems in several high-end housings, enhancing leak detection and user confidence.
- 2020: Increased focus on sustainable materials and manufacturing processes by leading companies.
- 2021: Introduction of modular port systems allowing greater lens compatibility and versatility.
- 2022: Significant advancements in compact housing designs for mirrorless cameras, attracting a broader consumer base.
- 2023: Emergence of smart housings with integrated electronic controls and connectivity features.
- 2024: Development of specialized housings for the burgeoning underwater drone and ROV market.
In-Depth Underwater Camera Housings Market Outlook
The future outlook for the underwater camera housings market is exceptionally promising, driven by sustained demand from both recreational and professional segments. Key growth accelerators, including ongoing technological innovation in materials and electronics, strategic industry collaborations, and the expanding global appeal of marine-based tourism and activities, will continue to fuel expansion. The increasing accessibility of advanced camera technologies, coupled with a growing consumer desire for high-quality underwater visual experiences, ensures a robust pipeline of demand for reliable and sophisticated housing solutions. Industry players that focus on developing user-friendly, durable, and feature-rich housings, while also exploring niche applications and emerging markets, are well-positioned to capitalize on the significant opportunities ahead and achieve substantial market growth in the coming years.
Underwater Camera Housings Segmentation
-
1. Application
- 1.1. Online
- 1.2. Offline
-
2. Types
- 2.1. Plastic Case
- 2.2. Metal Case
Underwater Camera Housings Segmentation By Geography
-
1. North America
- 1.1. United States
- 1.2. Canada
- 1.3. Mexico
-
2. South America
- 2.1. Brazil
- 2.2. Argentina
- 2.3. Rest of South America
-
3. Europe
- 3.1. United Kingdom
- 3.2. Germany
- 3.3. France
- 3.4. Italy
- 3.5. Spain
- 3.6. Russia
- 3.7. Benelux
- 3.8. Nordics
- 3.9. Rest of Europe
-
4. Middle East & Africa
- 4.1. Turkey
- 4.2. Israel
- 4.3. GCC
- 4.4. North Africa
- 4.5. South Africa
- 4.6. Rest of Middle East & Africa
-
5. Asia Pacific
- 5.1. China
- 5.2. India
- 5.3. Japan
- 5.4. South Korea
- 5.5. ASEAN
- 5.6. Oceania
- 5.7. Rest of Asia Pacific
Underwater Camera Housings Regional Market Share
Geographic Coverage of Underwater Camera Housings
Underwater Camera Housings REPORT HIGHLIGHTS
| Aspects | Details |
|---|---|
| Study Period | 2020-2034 |
| Base Year | 2025 |
| Estimated Year | 2026 |
| Forecast Period | 2026-2034 |
| Historical Period | 2020-2025 |
| Growth Rate | CAGR of 6.1% from 2020-2034 |
| Segmentation |
|
Table of Contents
- 1. Introduction
- 1.1. Research Scope
- 1.2. Market Segmentation
- 1.3. Research Methodology
- 1.4. Definitions and Assumptions
- 2. Executive Summary
- 2.1. Introduction
- 3. Market Dynamics
- 3.1. Introduction
- 3.2. Market Drivers
- 3.3. Market Restrains
- 3.4. Market Trends
- 4. Market Factor Analysis
- 4.1. Porters Five Forces
- 4.2. Supply/Value Chain
- 4.3. PESTEL analysis
- 4.4. Market Entropy
- 4.5. Patent/Trademark Analysis
- 5. Global Underwater Camera Housings Analysis, Insights and Forecast, 2020-2032
- 5.1. Market Analysis, Insights and Forecast - by Application
- 5.1.1. Online
- 5.1.2. Offline
- 5.2. Market Analysis, Insights and Forecast - by Types
- 5.2.1. Plastic Case
- 5.2.2. Metal Case
- 5.3. Market Analysis, Insights and Forecast - by Region
- 5.3.1. North America
- 5.3.2. South America
- 5.3.3. Europe
- 5.3.4. Middle East & Africa
- 5.3.5. Asia Pacific
- 5.1. Market Analysis, Insights and Forecast - by Application
- 6. North America Underwater Camera Housings Analysis, Insights and Forecast, 2020-2032
- 6.1. Market Analysis, Insights and Forecast - by Application
- 6.1.1. Online
- 6.1.2. Offline
- 6.2. Market Analysis, Insights and Forecast - by Types
- 6.2.1. Plastic Case
- 6.2.2. Metal Case
- 6.1. Market Analysis, Insights and Forecast - by Application
- 7. South America Underwater Camera Housings Analysis, Insights and Forecast, 2020-2032
- 7.1. Market Analysis, Insights and Forecast - by Application
- 7.1.1. Online
- 7.1.2. Offline
- 7.2. Market Analysis, Insights and Forecast - by Types
- 7.2.1. Plastic Case
- 7.2.2. Metal Case
- 7.1. Market Analysis, Insights and Forecast - by Application
- 8. Europe Underwater Camera Housings Analysis, Insights and Forecast, 2020-2032
- 8.1. Market Analysis, Insights and Forecast - by Application
- 8.1.1. Online
- 8.1.2. Offline
- 8.2. Market Analysis, Insights and Forecast - by Types
- 8.2.1. Plastic Case
- 8.2.2. Metal Case
- 8.1. Market Analysis, Insights and Forecast - by Application
- 9. Middle East & Africa Underwater Camera Housings Analysis, Insights and Forecast, 2020-2032
- 9.1. Market Analysis, Insights and Forecast - by Application
- 9.1.1. Online
- 9.1.2. Offline
- 9.2. Market Analysis, Insights and Forecast - by Types
- 9.2.1. Plastic Case
- 9.2.2. Metal Case
- 9.1. Market Analysis, Insights and Forecast - by Application
- 10. Asia Pacific Underwater Camera Housings Analysis, Insights and Forecast, 2020-2032
- 10.1. Market Analysis, Insights and Forecast - by Application
- 10.1.1. Online
- 10.1.2. Offline
- 10.2. Market Analysis, Insights and Forecast - by Types
- 10.2.1. Plastic Case
- 10.2.2. Metal Case
- 10.1. Market Analysis, Insights and Forecast - by Application
- 11. Competitive Analysis
- 11.1. Global Market Share Analysis 2025
- 11.2. Company Profiles
- 11.2.1 Divevolk
- 11.2.1.1. Overview
- 11.2.1.2. Products
- 11.2.1.3. SWOT Analysis
- 11.2.1.4. Recent Developments
- 11.2.1.5. Financials (Based on Availability)
- 11.2.2 Ikelite
- 11.2.2.1. Overview
- 11.2.2.2. Products
- 11.2.2.3. SWOT Analysis
- 11.2.2.4. Recent Developments
- 11.2.2.5. Financials (Based on Availability)
- 11.2.3 AquaTech
- 11.2.3.1. Overview
- 11.2.3.2. Products
- 11.2.3.3. SWOT Analysis
- 11.2.3.4. Recent Developments
- 11.2.3.5. Financials (Based on Availability)
- 11.2.4 Kraken Sports
- 11.2.4.1. Overview
- 11.2.4.2. Products
- 11.2.4.3. SWOT Analysis
- 11.2.4.4. Recent Developments
- 11.2.4.5. Financials (Based on Availability)
- 11.2.5 Nautismart
- 11.2.5.1. Overview
- 11.2.5.2. Products
- 11.2.5.3. SWOT Analysis
- 11.2.5.4. Recent Developments
- 11.2.5.5. Financials (Based on Availability)
- 11.2.6 Oceanic
- 11.2.6.1. Overview
- 11.2.6.2. Products
- 11.2.6.3. SWOT Analysis
- 11.2.6.4. Recent Developments
- 11.2.6.5. Financials (Based on Availability)
- 11.2.7 SeaLife Cameras
- 11.2.7.1. Overview
- 11.2.7.2. Products
- 11.2.7.3. SWOT Analysis
- 11.2.7.4. Recent Developments
- 11.2.7.5. Financials (Based on Availability)
- 11.2.8 Weefine
- 11.2.8.1. Overview
- 11.2.8.2. Products
- 11.2.8.3. SWOT Analysis
- 11.2.8.4. Recent Developments
- 11.2.8.5. Financials (Based on Availability)
- 11.2.9 Nauticam
- 11.2.9.1. Overview
- 11.2.9.2. Products
- 11.2.9.3. SWOT Analysis
- 11.2.9.4. Recent Developments
- 11.2.9.5. Financials (Based on Availability)
- 11.2.10 Seacam
- 11.2.10.1. Overview
- 11.2.10.2. Products
- 11.2.10.3. SWOT Analysis
- 11.2.10.4. Recent Developments
- 11.2.10.5. Financials (Based on Availability)
- 11.2.11 AOI OM
- 11.2.11.1. Overview
- 11.2.11.2. Products
- 11.2.11.3. SWOT Analysis
- 11.2.11.4. Recent Developments
- 11.2.11.5. Financials (Based on Availability)
- 11.2.12 Anglerfish Creative
- 11.2.12.1. Overview
- 11.2.12.2. Products
- 11.2.12.3. SWOT Analysis
- 11.2.12.4. Recent Developments
- 11.2.12.5. Financials (Based on Availability)
- 11.2.13 Aquatica Digital
- 11.2.13.1. Overview
- 11.2.13.2. Products
- 11.2.13.3. SWOT Analysis
- 11.2.13.4. Recent Developments
- 11.2.13.5. Financials (Based on Availability)
- 11.2.14 Atomos
- 11.2.14.1. Overview
- 11.2.14.2. Products
- 11.2.14.3. SWOT Analysis
- 11.2.14.4. Recent Developments
- 11.2.14.5. Financials (Based on Availability)
- 11.2.15 Fantasea
- 11.2.15.1. Overview
- 11.2.15.2. Products
- 11.2.15.3. SWOT Analysis
- 11.2.15.4. Recent Developments
- 11.2.15.5. Financials (Based on Availability)
- 11.2.16 Insta360
- 11.2.16.1. Overview
- 11.2.16.2. Products
- 11.2.16.3. SWOT Analysis
- 11.2.16.4. Recent Developments
- 11.2.16.5. Financials (Based on Availability)
- 11.2.17 Isotta
- 11.2.17.1. Overview
- 11.2.17.2. Products
- 11.2.17.3. SWOT Analysis
- 11.2.17.4. Recent Developments
- 11.2.17.5. Financials (Based on Availability)
- 11.2.18 Marelux
- 11.2.18.1. Overview
- 11.2.18.2. Products
- 11.2.18.3. SWOT Analysis
- 11.2.18.4. Recent Developments
- 11.2.18.5. Financials (Based on Availability)
- 11.2.19 Olympus
- 11.2.19.1. Overview
- 11.2.19.2. Products
- 11.2.19.3. SWOT Analysis
- 11.2.19.4. Recent Developments
- 11.2.19.5. Financials (Based on Availability)
- 11.2.1 Divevolk
List of Figures
- Figure 1: Global Underwater Camera Housings Revenue Breakdown (million, %) by Region 2025 & 2033
- Figure 2: Global Underwater Camera Housings Volume Breakdown (K, %) by Region 2025 & 2033
- Figure 3: North America Underwater Camera Housings Revenue (million), by Application 2025 & 2033
- Figure 4: North America Underwater Camera Housings Volume (K), by Application 2025 & 2033
- Figure 5: North America Underwater Camera Housings Revenue Share (%), by Application 2025 & 2033
- Figure 6: North America Underwater Camera Housings Volume Share (%), by Application 2025 & 2033
- Figure 7: North America Underwater Camera Housings Revenue (million), by Types 2025 & 2033
- Figure 8: North America Underwater Camera Housings Volume (K), by Types 2025 & 2033
- Figure 9: North America Underwater Camera Housings Revenue Share (%), by Types 2025 & 2033
- Figure 10: North America Underwater Camera Housings Volume Share (%), by Types 2025 & 2033
- Figure 11: North America Underwater Camera Housings Revenue (million), by Country 2025 & 2033
- Figure 12: North America Underwater Camera Housings Volume (K), by Country 2025 & 2033
- Figure 13: North America Underwater Camera Housings Revenue Share (%), by Country 2025 & 2033
- Figure 14: North America Underwater Camera Housings Volume Share (%), by Country 2025 & 2033
- Figure 15: South America Underwater Camera Housings Revenue (million), by Application 2025 & 2033
- Figure 16: South America Underwater Camera Housings Volume (K), by Application 2025 & 2033
- Figure 17: South America Underwater Camera Housings Revenue Share (%), by Application 2025 & 2033
- Figure 18: South America Underwater Camera Housings Volume Share (%), by Application 2025 & 2033
- Figure 19: South America Underwater Camera Housings Revenue (million), by Types 2025 & 2033
- Figure 20: South America Underwater Camera Housings Volume (K), by Types 2025 & 2033
- Figure 21: South America Underwater Camera Housings Revenue Share (%), by Types 2025 & 2033
- Figure 22: South America Underwater Camera Housings Volume Share (%), by Types 2025 & 2033
- Figure 23: South America Underwater Camera Housings Revenue (million), by Country 2025 & 2033
- Figure 24: South America Underwater Camera Housings Volume (K), by Country 2025 & 2033
- Figure 25: South America Underwater Camera Housings Revenue Share (%), by Country 2025 & 2033
- Figure 26: South America Underwater Camera Housings Volume Share (%), by Country 2025 & 2033
- Figure 27: Europe Underwater Camera Housings Revenue (million), by Application 2025 & 2033
- Figure 28: Europe Underwater Camera Housings Volume (K), by Application 2025 & 2033
- Figure 29: Europe Underwater Camera Housings Revenue Share (%), by Application 2025 & 2033
- Figure 30: Europe Underwater Camera Housings Volume Share (%), by Application 2025 & 2033
- Figure 31: Europe Underwater Camera Housings Revenue (million), by Types 2025 & 2033
- Figure 32: Europe Underwater Camera Housings Volume (K), by Types 2025 & 2033
- Figure 33: Europe Underwater Camera Housings Revenue Share (%), by Types 2025 & 2033
- Figure 34: Europe Underwater Camera Housings Volume Share (%), by Types 2025 & 2033
- Figure 35: Europe Underwater Camera Housings Revenue (million), by Country 2025 & 2033
- Figure 36: Europe Underwater Camera Housings Volume (K), by Country 2025 & 2033
- Figure 37: Europe Underwater Camera Housings Revenue Share (%), by Country 2025 & 2033
- Figure 38: Europe Underwater Camera Housings Volume Share (%), by Country 2025 & 2033
- Figure 39: Middle East & Africa Underwater Camera Housings Revenue (million), by Application 2025 & 2033
- Figure 40: Middle East & Africa Underwater Camera Housings Volume (K), by Application 2025 & 2033
- Figure 41: Middle East & Africa Underwater Camera Housings Revenue Share (%), by Application 2025 & 2033
- Figure 42: Middle East & Africa Underwater Camera Housings Volume Share (%), by Application 2025 & 2033
- Figure 43: Middle East & Africa Underwater Camera Housings Revenue (million), by Types 2025 & 2033
- Figure 44: Middle East & Africa Underwater Camera Housings Volume (K), by Types 2025 & 2033
- Figure 45: Middle East & Africa Underwater Camera Housings Revenue Share (%), by Types 2025 & 2033
- Figure 46: Middle East & Africa Underwater Camera Housings Volume Share (%), by Types 2025 & 2033
- Figure 47: Middle East & Africa Underwater Camera Housings Revenue (million), by Country 2025 & 2033
- Figure 48: Middle East & Africa Underwater Camera Housings Volume (K), by Country 2025 & 2033
- Figure 49: Middle East & Africa Underwater Camera Housings Revenue Share (%), by Country 2025 & 2033
- Figure 50: Middle East & Africa Underwater Camera Housings Volume Share (%), by Country 2025 & 2033
- Figure 51: Asia Pacific Underwater Camera Housings Revenue (million), by Application 2025 & 2033
- Figure 52: Asia Pacific Underwater Camera Housings Volume (K), by Application 2025 & 2033
- Figure 53: Asia Pacific Underwater Camera Housings Revenue Share (%), by Application 2025 & 2033
- Figure 54: Asia Pacific Underwater Camera Housings Volume Share (%), by Application 2025 & 2033
- Figure 55: Asia Pacific Underwater Camera Housings Revenue (million), by Types 2025 & 2033
- Figure 56: Asia Pacific Underwater Camera Housings Volume (K), by Types 2025 & 2033
- Figure 57: Asia Pacific Underwater Camera Housings Revenue Share (%), by Types 2025 & 2033
- Figure 58: Asia Pacific Underwater Camera Housings Volume Share (%), by Types 2025 & 2033
- Figure 59: Asia Pacific Underwater Camera Housings Revenue (million), by Country 2025 & 2033
- Figure 60: Asia Pacific Underwater Camera Housings Volume (K), by Country 2025 & 2033
- Figure 61: Asia Pacific Underwater Camera Housings Revenue Share (%), by Country 2025 & 2033
- Figure 62: Asia Pacific Underwater Camera Housings Volume Share (%), by Country 2025 & 2033
List of Tables
- Table 1: Global Underwater Camera Housings Revenue million Forecast, by Application 2020 & 2033
- Table 2: Global Underwater Camera Housings Volume K Forecast, by Application 2020 & 2033
- Table 3: Global Underwater Camera Housings Revenue million Forecast, by Types 2020 & 2033
- Table 4: Global Underwater Camera Housings Volume K Forecast, by Types 2020 & 2033
- Table 5: Global Underwater Camera Housings Revenue million Forecast, by Region 2020 & 2033
- Table 6: Global Underwater Camera Housings Volume K Forecast, by Region 2020 & 2033
- Table 7: Global Underwater Camera Housings Revenue million Forecast, by Application 2020 & 2033
- Table 8: Global Underwater Camera Housings Volume K Forecast, by Application 2020 & 2033
- Table 9: Global Underwater Camera Housings Revenue million Forecast, by Types 2020 & 2033
- Table 10: Global Underwater Camera Housings Volume K Forecast, by Types 2020 & 2033
- Table 11: Global Underwater Camera Housings Revenue million Forecast, by Country 2020 & 2033
- Table 12: Global Underwater Camera Housings Volume K Forecast, by Country 2020 & 2033
- Table 13: United States Underwater Camera Housings Revenue (million) Forecast, by Application 2020 & 2033
- Table 14: United States Underwater Camera Housings Volume (K) Forecast, by Application 2020 & 2033
- Table 15: Canada Underwater Camera Housings Revenue (million) Forecast, by Application 2020 & 2033
- Table 16: Canada Underwater Camera Housings Volume (K) Forecast, by Application 2020 & 2033
- Table 17: Mexico Underwater Camera Housings Revenue (million) Forecast, by Application 2020 & 2033
- Table 18: Mexico Underwater Camera Housings Volume (K) Forecast, by Application 2020 & 2033
- Table 19: Global Underwater Camera Housings Revenue million Forecast, by Application 2020 & 2033
- Table 20: Global Underwater Camera Housings Volume K Forecast, by Application 2020 & 2033
- Table 21: Global Underwater Camera Housings Revenue million Forecast, by Types 2020 & 2033
- Table 22: Global Underwater Camera Housings Volume K Forecast, by Types 2020 & 2033
- Table 23: Global Underwater Camera Housings Revenue million Forecast, by Country 2020 & 2033
- Table 24: Global Underwater Camera Housings Volume K Forecast, by Country 2020 & 2033
- Table 25: Brazil Underwater Camera Housings Revenue (million) Forecast, by Application 2020 & 2033
- Table 26: Brazil Underwater Camera Housings Volume (K) Forecast, by Application 2020 & 2033
- Table 27: Argentina Underwater Camera Housings Revenue (million) Forecast, by Application 2020 & 2033
- Table 28: Argentina Underwater Camera Housings Volume (K) Forecast, by Application 2020 & 2033
- Table 29: Rest of South America Underwater Camera Housings Revenue (million) Forecast, by Application 2020 & 2033
- Table 30: Rest of South America Underwater Camera Housings Volume (K) Forecast, by Application 2020 & 2033
- Table 31: Global Underwater Camera Housings Revenue million Forecast, by Application 2020 & 2033
- Table 32: Global Underwater Camera Housings Volume K Forecast, by Application 2020 & 2033
- Table 33: Global Underwater Camera Housings Revenue million Forecast, by Types 2020 & 2033
- Table 34: Global Underwater Camera Housings Volume K Forecast, by Types 2020 & 2033
- Table 35: Global Underwater Camera Housings Revenue million Forecast, by Country 2020 & 2033
- Table 36: Global Underwater Camera Housings Volume K Forecast, by Country 2020 & 2033
- Table 37: United Kingdom Underwater Camera Housings Revenue (million) Forecast, by Application 2020 & 2033
- Table 38: United Kingdom Underwater Camera Housings Volume (K) Forecast, by Application 2020 & 2033
- Table 39: Germany Underwater Camera Housings Revenue (million) Forecast, by Application 2020 & 2033
- Table 40: Germany Underwater Camera Housings Volume (K) Forecast, by Application 2020 & 2033
- Table 41: France Underwater Camera Housings Revenue (million) Forecast, by Application 2020 & 2033
- Table 42: France Underwater Camera Housings Volume (K) Forecast, by Application 2020 & 2033
- Table 43: Italy Underwater Camera Housings Revenue (million) Forecast, by Application 2020 & 2033
- Table 44: Italy Underwater Camera Housings Volume (K) Forecast, by Application 2020 & 2033
- Table 45: Spain Underwater Camera Housings Revenue (million) Forecast, by Application 2020 & 2033
- Table 46: Spain Underwater Camera Housings Volume (K) Forecast, by Application 2020 & 2033
- Table 47: Russia Underwater Camera Housings Revenue (million) Forecast, by Application 2020 & 2033
- Table 48: Russia Underwater Camera Housings Volume (K) Forecast, by Application 2020 & 2033
- Table 49: Benelux Underwater Camera Housings Revenue (million) Forecast, by Application 2020 & 2033
- Table 50: Benelux Underwater Camera Housings Volume (K) Forecast, by Application 2020 & 2033
- Table 51: Nordics Underwater Camera Housings Revenue (million) Forecast, by Application 2020 & 2033
- Table 52: Nordics Underwater Camera Housings Volume (K) Forecast, by Application 2020 & 2033
- Table 53: Rest of Europe Underwater Camera Housings Revenue (million) Forecast, by Application 2020 & 2033
- Table 54: Rest of Europe Underwater Camera Housings Volume (K) Forecast, by Application 2020 & 2033
- Table 55: Global Underwater Camera Housings Revenue million Forecast, by Application 2020 & 2033
- Table 56: Global Underwater Camera Housings Volume K Forecast, by Application 2020 & 2033
- Table 57: Global Underwater Camera Housings Revenue million Forecast, by Types 2020 & 2033
- Table 58: Global Underwater Camera Housings Volume K Forecast, by Types 2020 & 2033
- Table 59: Global Underwater Camera Housings Revenue million Forecast, by Country 2020 & 2033
- Table 60: Global Underwater Camera Housings Volume K Forecast, by Country 2020 & 2033
- Table 61: Turkey Underwater Camera Housings Revenue (million) Forecast, by Application 2020 & 2033
- Table 62: Turkey Underwater Camera Housings Volume (K) Forecast, by Application 2020 & 2033
- Table 63: Israel Underwater Camera Housings Revenue (million) Forecast, by Application 2020 & 2033
- Table 64: Israel Underwater Camera Housings Volume (K) Forecast, by Application 2020 & 2033
- Table 65: GCC Underwater Camera Housings Revenue (million) Forecast, by Application 2020 & 2033
- Table 66: GCC Underwater Camera Housings Volume (K) Forecast, by Application 2020 & 2033
- Table 67: North Africa Underwater Camera Housings Revenue (million) Forecast, by Application 2020 & 2033
- Table 68: North Africa Underwater Camera Housings Volume (K) Forecast, by Application 2020 & 2033
- Table 69: South Africa Underwater Camera Housings Revenue (million) Forecast, by Application 2020 & 2033
- Table 70: South Africa Underwater Camera Housings Volume (K) Forecast, by Application 2020 & 2033
- Table 71: Rest of Middle East & Africa Underwater Camera Housings Revenue (million) Forecast, by Application 2020 & 2033
- Table 72: Rest of Middle East & Africa Underwater Camera Housings Volume (K) Forecast, by Application 2020 & 2033
- Table 73: Global Underwater Camera Housings Revenue million Forecast, by Application 2020 & 2033
- Table 74: Global Underwater Camera Housings Volume K Forecast, by Application 2020 & 2033
- Table 75: Global Underwater Camera Housings Revenue million Forecast, by Types 2020 & 2033
- Table 76: Global Underwater Camera Housings Volume K Forecast, by Types 2020 & 2033
- Table 77: Global Underwater Camera Housings Revenue million Forecast, by Country 2020 & 2033
- Table 78: Global Underwater Camera Housings Volume K Forecast, by Country 2020 & 2033
- Table 79: China Underwater Camera Housings Revenue (million) Forecast, by Application 2020 & 2033
- Table 80: China Underwater Camera Housings Volume (K) Forecast, by Application 2020 & 2033
- Table 81: India Underwater Camera Housings Revenue (million) Forecast, by Application 2020 & 2033
- Table 82: India Underwater Camera Housings Volume (K) Forecast, by Application 2020 & 2033
- Table 83: Japan Underwater Camera Housings Revenue (million) Forecast, by Application 2020 & 2033
- Table 84: Japan Underwater Camera Housings Volume (K) Forecast, by Application 2020 & 2033
- Table 85: South Korea Underwater Camera Housings Revenue (million) Forecast, by Application 2020 & 2033
- Table 86: South Korea Underwater Camera Housings Volume (K) Forecast, by Application 2020 & 2033
- Table 87: ASEAN Underwater Camera Housings Revenue (million) Forecast, by Application 2020 & 2033
- Table 88: ASEAN Underwater Camera Housings Volume (K) Forecast, by Application 2020 & 2033
- Table 89: Oceania Underwater Camera Housings Revenue (million) Forecast, by Application 2020 & 2033
- Table 90: Oceania Underwater Camera Housings Volume (K) Forecast, by Application 2020 & 2033
- Table 91: Rest of Asia Pacific Underwater Camera Housings Revenue (million) Forecast, by Application 2020 & 2033
- Table 92: Rest of Asia Pacific Underwater Camera Housings Volume (K) Forecast, by Application 2020 & 2033
Frequently Asked Questions
1. What is the projected Compound Annual Growth Rate (CAGR) of the Underwater Camera Housings?
The projected CAGR is approximately 6.1%.
2. Which companies are prominent players in the Underwater Camera Housings?
Key companies in the market include Divevolk, Ikelite, AquaTech, Kraken Sports, Nautismart, Oceanic, SeaLife Cameras, Weefine, Nauticam, Seacam, AOI OM, Anglerfish Creative, Aquatica Digital, Atomos, Fantasea, Insta360, Isotta, Marelux, Olympus.
3. What are the main segments of the Underwater Camera Housings?
The market segments include Application, Types.
4. Can you provide details about the market size?
The market size is estimated to be USD 1827 million as of 2022.
5. What are some drivers contributing to market growth?
N/A
6. What are the notable trends driving market growth?
N/A
7. Are there any restraints impacting market growth?
N/A
8. Can you provide examples of recent developments in the market?
N/A
9. What pricing options are available for accessing the report?
Pricing options include single-user, multi-user, and enterprise licenses priced at USD 3950.00, USD 5925.00, and USD 7900.00 respectively.
10. Is the market size provided in terms of value or volume?
The market size is provided in terms of value, measured in million and volume, measured in K.
11. Are there any specific market keywords associated with the report?
Yes, the market keyword associated with the report is "Underwater Camera Housings," which aids in identifying and referencing the specific market segment covered.
12. How do I determine which pricing option suits my needs best?
The pricing options vary based on user requirements and access needs. Individual users may opt for single-user licenses, while businesses requiring broader access may choose multi-user or enterprise licenses for cost-effective access to the report.
13. Are there any additional resources or data provided in the Underwater Camera Housings report?
While the report offers comprehensive insights, it's advisable to review the specific contents or supplementary materials provided to ascertain if additional resources or data are available.
14. How can I stay updated on further developments or reports in the Underwater Camera Housings?
To stay informed about further developments, trends, and reports in the Underwater Camera Housings, consider subscribing to industry newsletters, following relevant companies and organizations, or regularly checking reputable industry news sources and publications.
Methodology
Step 1 - Identification of Relevant Samples Size from Population Database


Step 2 - Approaches for Defining Global Market Size (Value, Volume* & Price*)

Note*: In applicable scenarios
Step 3 - Data Sources
Primary Research
- Web Analytics
- Survey Reports
- Research Institute
- Latest Research Reports
- Opinion Leaders
Secondary Research
- Annual Reports
- White Paper
- Latest Press Release
- Industry Association
- Paid Database
- Investor Presentations

Step 4 - Data Triangulation
Involves using different sources of information in order to increase the validity of a study
These sources are likely to be stakeholders in a program - participants, other researchers, program staff, other community members, and so on.
Then we put all data in single framework & apply various statistical tools to find out the dynamic on the market.
During the analysis stage, feedback from the stakeholder groups would be compared to determine areas of agreement as well as areas of divergence