Ultra-Thin Glass Industry in North America: Market Dynamics and Forecasts 2025-2033

Ultra-Thin Glass Industry by Application (Semiconductor Substrate, Touch Panel Displays, Fingerprint Sensors, Automotive Glazing, Other Applications), by End-user Industry (Consumer Electronics, Automotive, Biotechnology, Other End-user Industries), by Asia Pacific (China, India, Japan, South Korea, Rest of Asia Pacific), by North America (United States, Canada, Mexico), by Europe (Germany, United Kingdom, France, Italy, Rest of Europe), by South America (Brazil, Argentina, Rest of South America), by Middle East and Africa (Saudi Arabia, South Africa, Rest of Middle East and Africa) Forecast 2025-2033

Jul 7 2025
Base Year: 2024

150 Pages
Main Logo

Ultra-Thin Glass Industry in North America: Market Dynamics and Forecasts 2025-2033


Home
Industries
Chemicals & Materials
sponsor image
sponsor image
sponsor image
sponsor image

Tailored for you

  • In-depth Analysis Tailored to Specified Regions or Segments
  • Company Profiles Customized to User Preferences
  • Comprehensive Insights Focused on Specific Segments or Regions
  • Customized Evaluation of Competitive Landscape to Meet Your Needs
  • Tailored Customization to Address Other Specific Requirements
Ask for customization


Key Insights

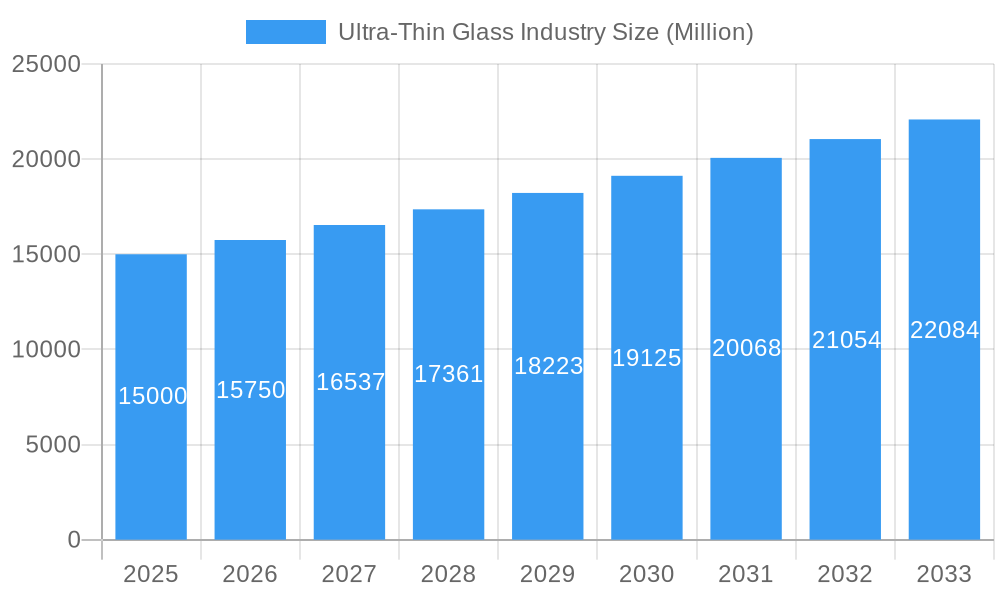
The ultra-thin glass market is experiencing robust growth, driven by increasing demand from diverse sectors. A compound annual growth rate (CAGR) exceeding 5% indicates a consistently expanding market, projected to reach significant value over the forecast period (2025-2033). Key application segments, such as semiconductor substrates, touch panel displays, and fingerprint sensors, are fueling this expansion, particularly within the consumer electronics and automotive industries. Technological advancements in glass manufacturing are enabling thinner, more durable, and higher-performing glass solutions, further stimulating market demand. The Asia-Pacific region, particularly China and Japan, currently dominates the market, due to a concentration of manufacturing and a strong consumer electronics sector. However, increasing adoption in North America and Europe, driven by the automotive and biotechnology sectors, is expected to contribute significant growth in these regions in the coming years. While challenges exist, such as the relatively high production costs associated with ultra-thin glass manufacturing and potential supply chain vulnerabilities, the overall market outlook remains positive, with substantial growth opportunities expected across various applications and geographic regions.

The market's growth trajectory is influenced by several factors. The ongoing miniaturization of electronic devices necessitates the use of ultra-thin glass, creating a strong demand pull. Moreover, the rise of flexible displays and foldable smartphones is further accelerating market growth. The increasing adoption of advanced driver-assistance systems (ADAS) and electric vehicles (EVs) in the automotive industry also creates a substantial demand for ultra-thin glass in automotive glazing applications. Emerging applications in biotechnology, such as lab-on-a-chip devices, are also contributing to the market's expansion. Competitive dynamics within the ultra-thin glass market are characterized by the presence of both established players and emerging companies, leading to ongoing innovations and price competition. This competitive landscape, combined with technological advancements and increasing demand across diverse sectors, will continue to shape the future of the ultra-thin glass market.
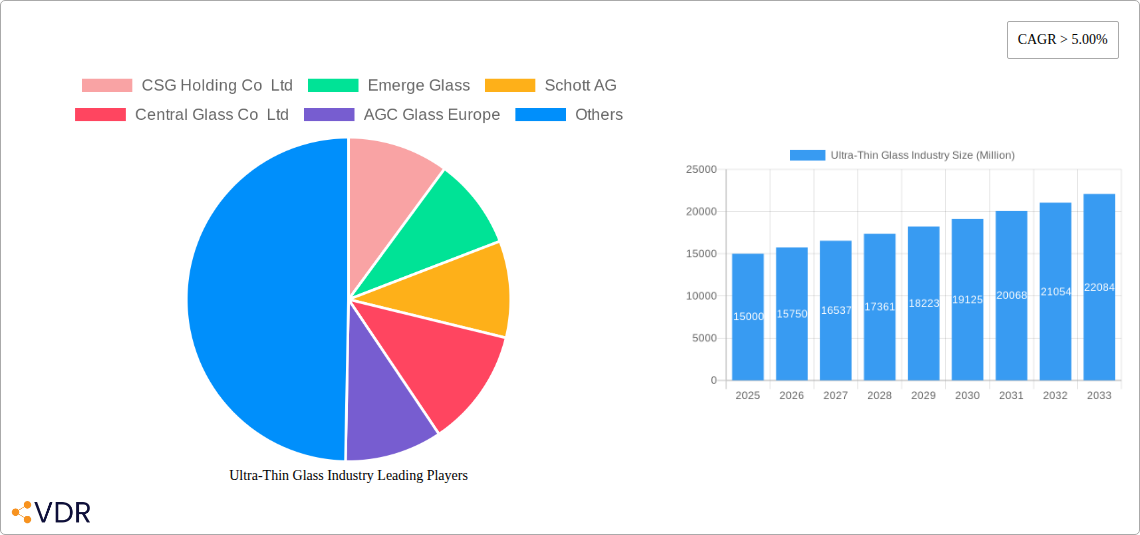
Ultra-Thin Glass Industry Research Report - Market Size, Growth & Forecast

Ultra-Thin Glass Industry Market Report: 2019-2033

This comprehensive report provides an in-depth analysis of the ultra-thin glass industry, covering market dynamics, growth trends, regional dominance, product landscape, key players, and future outlook. The study period spans from 2019 to 2033, with 2025 serving as the base and estimated year. The report leverages extensive research to offer actionable insights for industry professionals, investors, and stakeholders. This report is designed for immediate use and requires no further modifications.

Ultra-Thin Glass Industry Market Dynamics & Structure

The ultra-thin glass market, valued at xx million units in 2025, exhibits a moderately consolidated structure. Key players like Corning Incorporated, AGC Glass Europe, and Schott AG hold significant market share, though the presence of several smaller, specialized manufacturers contributes to competitive dynamics. Technological innovation, primarily driven by advancements in glass manufacturing processes and material science, is a crucial driver of growth. Stringent regulatory frameworks concerning material safety and environmental impact influence manufacturing practices. The market faces competition from alternative materials like flexible plastics in certain applications. The end-user demographics are diverse, ranging from consumer electronics to the automotive and biotechnology sectors. M&A activity in the ultra-thin glass industry has been moderate in recent years, with xx deals recorded between 2019 and 2024, largely focused on consolidating manufacturing capabilities and expanding into new market segments.

  • Market Concentration: Moderately consolidated, with a few major players dominating.
  • Technological Innovation: Significant advancements in glass manufacturing, driving miniaturization and performance improvements.
  • Regulatory Frameworks: Stringent safety and environmental regulations shaping manufacturing processes.
  • Competitive Substitutes: Flexible plastics pose a challenge in specific applications.
  • End-User Demographics: Diverse, encompassing consumer electronics, automotive, and biotechnology industries.
  • M&A Activity: Moderate level of mergers and acquisitions, primarily focused on consolidation and expansion.

Ultra-Thin Glass Industry Growth Trends & Insights

The ultra-thin glass market has witnessed robust growth throughout the historical period (2019-2024), primarily fueled by the increasing demand from the consumer electronics sector, particularly in smartphones and tablets. The market size is projected to expand at a CAGR of xx% during the forecast period (2025-2033), reaching xx million units by 2033. This growth is driven by the ongoing miniaturization trend in electronics, the rising adoption of touch panel displays and fingerprint sensors, and increasing demand from the automotive industry for advanced glazing solutions. Technological disruptions, such as the introduction of flexible and foldable ultra-thin glass, are poised to further accelerate market growth. Consumer behavior shifts towards premium devices with advanced features further contribute to the expansion of this market. The market penetration rate for ultra-thin glass in various applications continues to rise, particularly in emerging economies.

Ultra-Thin Glass Industry Growth

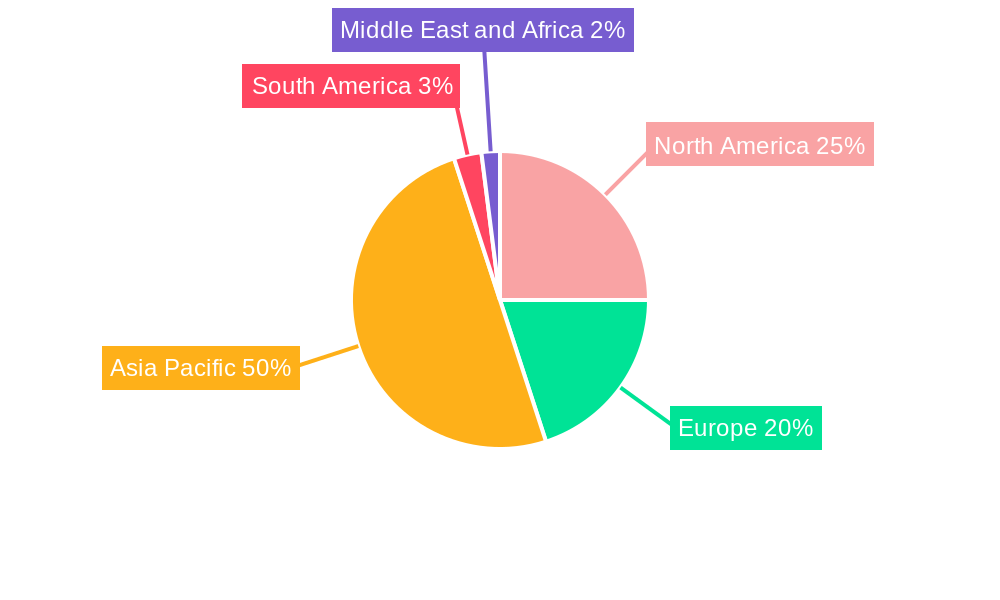
Dominant Regions, Countries, or Segments in Ultra-Thin Glass Industry

Asia-Pacific, specifically China and Japan, holds the largest market share in the ultra-thin glass industry, driven by the substantial presence of major manufacturers and robust growth in the consumer electronics and automotive sectors. The Semiconductor Substrate application segment is currently the largest, followed closely by Touch Panel Displays. The Automotive Glazing segment is expected to exhibit significant growth in the coming years.

  • Key Drivers (Asia-Pacific):
    • High concentration of manufacturing facilities.
    • Rapid growth in consumer electronics and automotive sectors.
    • Favorable government policies and infrastructure investments.
  • Dominant Segments:
    • Semiconductor Substrate: High demand driven by advancements in semiconductor technology.
    • Touch Panel Displays: Growth fueled by increasing smartphone and tablet penetration.
    • Automotive Glazing: Expected to exhibit strong growth driven by increased demand for advanced driver assistance systems (ADAS) and enhanced safety features.

Ultra-Thin Glass Industry Product Landscape

Ultra-thin glass products are characterized by their exceptional thinness, high strength, and optical clarity. Recent innovations focus on enhancing flexibility, durability, and scratch resistance. Key applications include semiconductor substrates, touch panel displays, fingerprint sensors, and automotive glazing. Unique selling propositions often include improved transparency, enhanced strength-to-weight ratios, and compatibility with advanced manufacturing processes. Technological advancements are driving the development of chemically strengthened glass, and glass with improved thermal stability.

Key Drivers, Barriers & Challenges in Ultra-Thin Glass Industry

Key Drivers: The burgeoning consumer electronics sector, advancements in display technology (e.g., foldable screens), and the rising demand for lightweight and durable materials in the automotive industry are primary drivers. Government incentives for green technologies are also contributing to growth.

Key Challenges: The high cost of production, stringent quality control requirements, and the potential for material fragility present significant challenges. Supply chain disruptions and intense competition from alternative materials also hinder market growth. The impact of these factors is estimated to reduce the overall market growth rate by approximately xx% during the forecast period.

Emerging Opportunities in Ultra-Thin Glass Industry

Emerging opportunities lie in the development of flexible and foldable ultra-thin glass for next-generation electronic devices and wearable technologies. Growth potential also exists in specialized applications like biomedical devices and advanced packaging solutions. Expansion into untapped markets in developing economies presents significant growth opportunities.

Growth Accelerators in the Ultra-Thin Glass Industry

Technological breakthroughs in glass manufacturing processes are key growth accelerators. Strategic partnerships between glass manufacturers and electronic device manufacturers are driving innovation and market expansion. The development of new applications and the expansion into emerging markets will further fuel long-term growth.

Key Players Shaping the Ultra-Thin Glass Industry Market

  • CSG Holding Co Ltd
  • Emerge Glass
  • Schott AG
  • Central Glass Co Ltd
  • AGC Glass Europe
  • Taiwan Glass Industry Corporation
  • Novalglass
  • Fraunhofer FEP
  • Nitto Boseki Co Ltd
  • Changzhou Almaden Co Ltd
  • Nippon Electric Glass Co Ltd
  • Corning Incorporated

Notable Milestones in Ultra-Thin Glass Industry Sector

  • 2021-Q4: Corning Incorporated launched a new generation of ultra-thin glass for foldable smartphones.
  • 2022-Q2: AGC Glass Europe announced a strategic partnership to develop advanced ultra-thin glass for automotive applications.
  • 2023-Q1: Significant investment in R&D by Schott AG to enhance the flexibility of ultra-thin glass. (Specific details not available - placeholder)

In-Depth Ultra-Thin Glass Industry Market Outlook

The ultra-thin glass market is poised for substantial growth in the coming years, driven by continued technological advancements and the expansion into new applications. Strategic partnerships and increased investment in R&D will be instrumental in unlocking future market potential. Focus on sustainability and the development of eco-friendly manufacturing processes will play a crucial role in shaping the future of the industry.

Ultra-Thin Glass Industry Segmentation

  • 1. Application
    • 1.1. Semiconductor Substrate
    • 1.2. Touch Panel Displays
    • 1.3. Fingerprint Sensors
    • 1.4. Automotive Glazing
    • 1.5. Other Applications
  • 2. End-user Industry
    • 2.1. Consumer Electronics
    • 2.2. Automotive
    • 2.3. Biotechnology
    • 2.4. Other End-user Industries

Ultra-Thin Glass Industry Segmentation By Geography

  • 1. Asia Pacific
    • 1.1. China
    • 1.2. India
    • 1.3. Japan
    • 1.4. South Korea
    • 1.5. Rest of Asia Pacific
  • 2. North America
    • 2.1. United States
    • 2.2. Canada
    • 2.3. Mexico
  • 3. Europe
    • 3.1. Germany
    • 3.2. United Kingdom
    • 3.3. France
    • 3.4. Italy
    • 3.5. Rest of Europe
  • 4. South America
    • 4.1. Brazil
    • 4.2. Argentina
    • 4.3. Rest of South America
  • 5. Middle East and Africa
    • 5.1. Saudi Arabia
    • 5.2. South Africa
    • 5.3. Rest of Middle East and Africa
Ultra-Thin Glass Industry Regional Share


Ultra-Thin Glass Industry REPORT HIGHLIGHTS

AspectsDetails
Study Period 2019-2033
Base Year 2024
Estimated Year 2025
Forecast Period2025-2033
Historical Period2019-2024
Growth RateCAGR of > 5.00% from 2019-2033
Segmentation
    • By Application
      • Semiconductor Substrate
      • Touch Panel Displays
      • Fingerprint Sensors
      • Automotive Glazing
      • Other Applications
    • By End-user Industry
      • Consumer Electronics
      • Automotive
      • Biotechnology
      • Other End-user Industries
  • By Geography
    • Asia Pacific
      • China
      • India
      • Japan
      • South Korea
      • Rest of Asia Pacific
    • North America
      • United States
      • Canada
      • Mexico
    • Europe
      • Germany
      • United Kingdom
      • France
      • Italy
      • Rest of Europe
    • South America
      • Brazil
      • Argentina
      • Rest of South America
    • Middle East and Africa
      • Saudi Arabia
      • South Africa
      • Rest of Middle East and Africa


Table of Contents

  1. 1. Introduction
    • 1.1. Research Scope
    • 1.2. Market Segmentation
    • 1.3. Research Methodology
    • 1.4. Definitions and Assumptions
  2. 2. Executive Summary
    • 2.1. Introduction
  3. 3. Market Dynamics
    • 3.1. Introduction
      • 3.2. Market Drivers
        • 3.2.1. ; Growing Demand from Consumer Electronics; Other Drivers
      • 3.3. Market Restrains
        • 3.3.1. ; High Cost of Raw Materials; Other Restraints
      • 3.4. Market Trends
        • 3.4.1. Growing Demand from Consumer Electronics
  4. 4. Market Factor Analysis
    • 4.1. Porters Five Forces
    • 4.2. Supply/Value Chain
    • 4.3. PESTEL analysis
    • 4.4. Market Entropy
    • 4.5. Patent/Trademark Analysis
  5. 5. Global Ultra-Thin Glass Industry Analysis, Insights and Forecast, 2019-2031
    • 5.1. Market Analysis, Insights and Forecast - by Application
      • 5.1.1. Semiconductor Substrate
      • 5.1.2. Touch Panel Displays
      • 5.1.3. Fingerprint Sensors
      • 5.1.4. Automotive Glazing
      • 5.1.5. Other Applications
    • 5.2. Market Analysis, Insights and Forecast - by End-user Industry
      • 5.2.1. Consumer Electronics
      • 5.2.2. Automotive
      • 5.2.3. Biotechnology
      • 5.2.4. Other End-user Industries
    • 5.3. Market Analysis, Insights and Forecast - by Region
      • 5.3.1. Asia Pacific
      • 5.3.2. North America
      • 5.3.3. Europe
      • 5.3.4. South America
      • 5.3.5. Middle East and Africa
  6. 6. Asia Pacific Ultra-Thin Glass Industry Analysis, Insights and Forecast, 2019-2031
    • 6.1. Market Analysis, Insights and Forecast - by Application
      • 6.1.1. Semiconductor Substrate
      • 6.1.2. Touch Panel Displays
      • 6.1.3. Fingerprint Sensors
      • 6.1.4. Automotive Glazing
      • 6.1.5. Other Applications
    • 6.2. Market Analysis, Insights and Forecast - by End-user Industry
      • 6.2.1. Consumer Electronics
      • 6.2.2. Automotive
      • 6.2.3. Biotechnology
      • 6.2.4. Other End-user Industries
  7. 7. North America Ultra-Thin Glass Industry Analysis, Insights and Forecast, 2019-2031
    • 7.1. Market Analysis, Insights and Forecast - by Application
      • 7.1.1. Semiconductor Substrate
      • 7.1.2. Touch Panel Displays
      • 7.1.3. Fingerprint Sensors
      • 7.1.4. Automotive Glazing
      • 7.1.5. Other Applications
    • 7.2. Market Analysis, Insights and Forecast - by End-user Industry
      • 7.2.1. Consumer Electronics
      • 7.2.2. Automotive
      • 7.2.3. Biotechnology
      • 7.2.4. Other End-user Industries
  8. 8. Europe Ultra-Thin Glass Industry Analysis, Insights and Forecast, 2019-2031
    • 8.1. Market Analysis, Insights and Forecast - by Application
      • 8.1.1. Semiconductor Substrate
      • 8.1.2. Touch Panel Displays
      • 8.1.3. Fingerprint Sensors
      • 8.1.4. Automotive Glazing
      • 8.1.5. Other Applications
    • 8.2. Market Analysis, Insights and Forecast - by End-user Industry
      • 8.2.1. Consumer Electronics
      • 8.2.2. Automotive
      • 8.2.3. Biotechnology
      • 8.2.4. Other End-user Industries
  9. 9. South America Ultra-Thin Glass Industry Analysis, Insights and Forecast, 2019-2031
    • 9.1. Market Analysis, Insights and Forecast - by Application
      • 9.1.1. Semiconductor Substrate
      • 9.1.2. Touch Panel Displays
      • 9.1.3. Fingerprint Sensors
      • 9.1.4. Automotive Glazing
      • 9.1.5. Other Applications
    • 9.2. Market Analysis, Insights and Forecast - by End-user Industry
      • 9.2.1. Consumer Electronics
      • 9.2.2. Automotive
      • 9.2.3. Biotechnology
      • 9.2.4. Other End-user Industries
  10. 10. Middle East and Africa Ultra-Thin Glass Industry Analysis, Insights and Forecast, 2019-2031
    • 10.1. Market Analysis, Insights and Forecast - by Application
      • 10.1.1. Semiconductor Substrate
      • 10.1.2. Touch Panel Displays
      • 10.1.3. Fingerprint Sensors
      • 10.1.4. Automotive Glazing
      • 10.1.5. Other Applications
    • 10.2. Market Analysis, Insights and Forecast - by End-user Industry
      • 10.2.1. Consumer Electronics
      • 10.2.2. Automotive
      • 10.2.3. Biotechnology
      • 10.2.4. Other End-user Industries
  11. 11. Asia Pacific Ultra-Thin Glass Industry Analysis, Insights and Forecast, 2019-2031
      • 11.1. Market Analysis, Insights and Forecast - By Country/Sub-region
        • 11.1.1 China
        • 11.1.2 India
        • 11.1.3 Japan
        • 11.1.4 South Korea
        • 11.1.5 Rest of Asia Pacific
  12. 12. North America Ultra-Thin Glass Industry Analysis, Insights and Forecast, 2019-2031
      • 12.1. Market Analysis, Insights and Forecast - By Country/Sub-region
        • 12.1.1 United States
        • 12.1.2 Canada
        • 12.1.3 Mexico
  13. 13. Europe Ultra-Thin Glass Industry Analysis, Insights and Forecast, 2019-2031
      • 13.1. Market Analysis, Insights and Forecast - By Country/Sub-region
        • 13.1.1 Germany
        • 13.1.2 United Kingdom
        • 13.1.3 France
        • 13.1.4 Italy
        • 13.1.5 Rest of Europe
  14. 14. South America Ultra-Thin Glass Industry Analysis, Insights and Forecast, 2019-2031
      • 14.1. Market Analysis, Insights and Forecast - By Country/Sub-region
        • 14.1.1 Brazil
        • 14.1.2 Argentina
        • 14.1.3 Rest of South America
  15. 15. Middle East and Africa Ultra-Thin Glass Industry Analysis, Insights and Forecast, 2019-2031
      • 15.1. Market Analysis, Insights and Forecast - By Country/Sub-region
        • 15.1.1 Saudi Arabia
        • 15.1.2 South Africa
        • 15.1.3 Rest of Middle East and Africa
  16. 16. Competitive Analysis
    • 16.1. Global Market Share Analysis 2024
      • 16.2. Company Profiles
        • 16.2.1 CSG Holding Co Ltd
          • 16.2.1.1. Overview
          • 16.2.1.2. Products
          • 16.2.1.3. SWOT Analysis
          • 16.2.1.4. Recent Developments
          • 16.2.1.5. Financials (Based on Availability)
        • 16.2.2 Emerge Glass
          • 16.2.2.1. Overview
          • 16.2.2.2. Products
          • 16.2.2.3. SWOT Analysis
          • 16.2.2.4. Recent Developments
          • 16.2.2.5. Financials (Based on Availability)
        • 16.2.3 Schott AG
          • 16.2.3.1. Overview
          • 16.2.3.2. Products
          • 16.2.3.3. SWOT Analysis
          • 16.2.3.4. Recent Developments
          • 16.2.3.5. Financials (Based on Availability)
        • 16.2.4 Central Glass Co Ltd
          • 16.2.4.1. Overview
          • 16.2.4.2. Products
          • 16.2.4.3. SWOT Analysis
          • 16.2.4.4. Recent Developments
          • 16.2.4.5. Financials (Based on Availability)
        • 16.2.5 AGC Glass Europe
          • 16.2.5.1. Overview
          • 16.2.5.2. Products
          • 16.2.5.3. SWOT Analysis
          • 16.2.5.4. Recent Developments
          • 16.2.5.5. Financials (Based on Availability)
        • 16.2.6 Taiwan Glass Industry Corporation*List Not Exhaustive
          • 16.2.6.1. Overview
          • 16.2.6.2. Products
          • 16.2.6.3. SWOT Analysis
          • 16.2.6.4. Recent Developments
          • 16.2.6.5. Financials (Based on Availability)
        • 16.2.7 Novalglass
          • 16.2.7.1. Overview
          • 16.2.7.2. Products
          • 16.2.7.3. SWOT Analysis
          • 16.2.7.4. Recent Developments
          • 16.2.7.5. Financials (Based on Availability)
        • 16.2.8 Fraunhofer FEP
          • 16.2.8.1. Overview
          • 16.2.8.2. Products
          • 16.2.8.3. SWOT Analysis
          • 16.2.8.4. Recent Developments
          • 16.2.8.5. Financials (Based on Availability)
        • 16.2.9 Nitto Boseki Co Ltd
          • 16.2.9.1. Overview
          • 16.2.9.2. Products
          • 16.2.9.3. SWOT Analysis
          • 16.2.9.4. Recent Developments
          • 16.2.9.5. Financials (Based on Availability)
        • 16.2.10 Changzhou Almaden Co Ltd
          • 16.2.10.1. Overview
          • 16.2.10.2. Products
          • 16.2.10.3. SWOT Analysis
          • 16.2.10.4. Recent Developments
          • 16.2.10.5. Financials (Based on Availability)
        • 16.2.11 Nippon Electric Glass Co Ltd
          • 16.2.11.1. Overview
          • 16.2.11.2. Products
          • 16.2.11.3. SWOT Analysis
          • 16.2.11.4. Recent Developments
          • 16.2.11.5. Financials (Based on Availability)
        • 16.2.12 Corning Incorporated
          • 16.2.12.1. Overview
          • 16.2.12.2. Products
          • 16.2.12.3. SWOT Analysis
          • 16.2.12.4. Recent Developments
          • 16.2.12.5. Financials (Based on Availability)

List of Figures

  1. Figure 1: Global Ultra-Thin Glass Industry Revenue Breakdown (Million, %) by Region 2024 & 2032
  2. Figure 2: Asia Pacific Ultra-Thin Glass Industry Revenue (Million), by Country 2024 & 2032
  3. Figure 3: Asia Pacific Ultra-Thin Glass Industry Revenue Share (%), by Country 2024 & 2032
  4. Figure 4: North America Ultra-Thin Glass Industry Revenue (Million), by Country 2024 & 2032
  5. Figure 5: North America Ultra-Thin Glass Industry Revenue Share (%), by Country 2024 & 2032
  6. Figure 6: Europe Ultra-Thin Glass Industry Revenue (Million), by Country 2024 & 2032
  7. Figure 7: Europe Ultra-Thin Glass Industry Revenue Share (%), by Country 2024 & 2032
  8. Figure 8: South America Ultra-Thin Glass Industry Revenue (Million), by Country 2024 & 2032
  9. Figure 9: South America Ultra-Thin Glass Industry Revenue Share (%), by Country 2024 & 2032
  10. Figure 10: Middle East and Africa Ultra-Thin Glass Industry Revenue (Million), by Country 2024 & 2032
  11. Figure 11: Middle East and Africa Ultra-Thin Glass Industry Revenue Share (%), by Country 2024 & 2032
  12. Figure 12: Asia Pacific Ultra-Thin Glass Industry Revenue (Million), by Application 2024 & 2032
  13. Figure 13: Asia Pacific Ultra-Thin Glass Industry Revenue Share (%), by Application 2024 & 2032
  14. Figure 14: Asia Pacific Ultra-Thin Glass Industry Revenue (Million), by End-user Industry 2024 & 2032
  15. Figure 15: Asia Pacific Ultra-Thin Glass Industry Revenue Share (%), by End-user Industry 2024 & 2032
  16. Figure 16: Asia Pacific Ultra-Thin Glass Industry Revenue (Million), by Country 2024 & 2032
  17. Figure 17: Asia Pacific Ultra-Thin Glass Industry Revenue Share (%), by Country 2024 & 2032
  18. Figure 18: North America Ultra-Thin Glass Industry Revenue (Million), by Application 2024 & 2032
  19. Figure 19: North America Ultra-Thin Glass Industry Revenue Share (%), by Application 2024 & 2032
  20. Figure 20: North America Ultra-Thin Glass Industry Revenue (Million), by End-user Industry 2024 & 2032
  21. Figure 21: North America Ultra-Thin Glass Industry Revenue Share (%), by End-user Industry 2024 & 2032
  22. Figure 22: North America Ultra-Thin Glass Industry Revenue (Million), by Country 2024 & 2032
  23. Figure 23: North America Ultra-Thin Glass Industry Revenue Share (%), by Country 2024 & 2032
  24. Figure 24: Europe Ultra-Thin Glass Industry Revenue (Million), by Application 2024 & 2032
  25. Figure 25: Europe Ultra-Thin Glass Industry Revenue Share (%), by Application 2024 & 2032
  26. Figure 26: Europe Ultra-Thin Glass Industry Revenue (Million), by End-user Industry 2024 & 2032
  27. Figure 27: Europe Ultra-Thin Glass Industry Revenue Share (%), by End-user Industry 2024 & 2032
  28. Figure 28: Europe Ultra-Thin Glass Industry Revenue (Million), by Country 2024 & 2032
  29. Figure 29: Europe Ultra-Thin Glass Industry Revenue Share (%), by Country 2024 & 2032
  30. Figure 30: South America Ultra-Thin Glass Industry Revenue (Million), by Application 2024 & 2032
  31. Figure 31: South America Ultra-Thin Glass Industry Revenue Share (%), by Application 2024 & 2032
  32. Figure 32: South America Ultra-Thin Glass Industry Revenue (Million), by End-user Industry 2024 & 2032
  33. Figure 33: South America Ultra-Thin Glass Industry Revenue Share (%), by End-user Industry 2024 & 2032
  34. Figure 34: South America Ultra-Thin Glass Industry Revenue (Million), by Country 2024 & 2032
  35. Figure 35: South America Ultra-Thin Glass Industry Revenue Share (%), by Country 2024 & 2032
  36. Figure 36: Middle East and Africa Ultra-Thin Glass Industry Revenue (Million), by Application 2024 & 2032
  37. Figure 37: Middle East and Africa Ultra-Thin Glass Industry Revenue Share (%), by Application 2024 & 2032
  38. Figure 38: Middle East and Africa Ultra-Thin Glass Industry Revenue (Million), by End-user Industry 2024 & 2032
  39. Figure 39: Middle East and Africa Ultra-Thin Glass Industry Revenue Share (%), by End-user Industry 2024 & 2032
  40. Figure 40: Middle East and Africa Ultra-Thin Glass Industry Revenue (Million), by Country 2024 & 2032
  41. Figure 41: Middle East and Africa Ultra-Thin Glass Industry Revenue Share (%), by Country 2024 & 2032

List of Tables

  1. Table 1: Global Ultra-Thin Glass Industry Revenue Million Forecast, by Region 2019 & 2032
  2. Table 2: Global Ultra-Thin Glass Industry Revenue Million Forecast, by Application 2019 & 2032
  3. Table 3: Global Ultra-Thin Glass Industry Revenue Million Forecast, by End-user Industry 2019 & 2032
  4. Table 4: Global Ultra-Thin Glass Industry Revenue Million Forecast, by Region 2019 & 2032
  5. Table 5: Global Ultra-Thin Glass Industry Revenue Million Forecast, by Country 2019 & 2032
  6. Table 6: China Ultra-Thin Glass Industry Revenue (Million) Forecast, by Application 2019 & 2032
  7. Table 7: India Ultra-Thin Glass Industry Revenue (Million) Forecast, by Application 2019 & 2032
  8. Table 8: Japan Ultra-Thin Glass Industry Revenue (Million) Forecast, by Application 2019 & 2032
  9. Table 9: South Korea Ultra-Thin Glass Industry Revenue (Million) Forecast, by Application 2019 & 2032
  10. Table 10: Rest of Asia Pacific Ultra-Thin Glass Industry Revenue (Million) Forecast, by Application 2019 & 2032
  11. Table 11: Global Ultra-Thin Glass Industry Revenue Million Forecast, by Country 2019 & 2032
  12. Table 12: United States Ultra-Thin Glass Industry Revenue (Million) Forecast, by Application 2019 & 2032
  13. Table 13: Canada Ultra-Thin Glass Industry Revenue (Million) Forecast, by Application 2019 & 2032
  14. Table 14: Mexico Ultra-Thin Glass Industry Revenue (Million) Forecast, by Application 2019 & 2032
  15. Table 15: Global Ultra-Thin Glass Industry Revenue Million Forecast, by Country 2019 & 2032
  16. Table 16: Germany Ultra-Thin Glass Industry Revenue (Million) Forecast, by Application 2019 & 2032
  17. Table 17: United Kingdom Ultra-Thin Glass Industry Revenue (Million) Forecast, by Application 2019 & 2032
  18. Table 18: France Ultra-Thin Glass Industry Revenue (Million) Forecast, by Application 2019 & 2032
  19. Table 19: Italy Ultra-Thin Glass Industry Revenue (Million) Forecast, by Application 2019 & 2032
  20. Table 20: Rest of Europe Ultra-Thin Glass Industry Revenue (Million) Forecast, by Application 2019 & 2032
  21. Table 21: Global Ultra-Thin Glass Industry Revenue Million Forecast, by Country 2019 & 2032
  22. Table 22: Brazil Ultra-Thin Glass Industry Revenue (Million) Forecast, by Application 2019 & 2032
  23. Table 23: Argentina Ultra-Thin Glass Industry Revenue (Million) Forecast, by Application 2019 & 2032
  24. Table 24: Rest of South America Ultra-Thin Glass Industry Revenue (Million) Forecast, by Application 2019 & 2032
  25. Table 25: Global Ultra-Thin Glass Industry Revenue Million Forecast, by Country 2019 & 2032
  26. Table 26: Saudi Arabia Ultra-Thin Glass Industry Revenue (Million) Forecast, by Application 2019 & 2032
  27. Table 27: South Africa Ultra-Thin Glass Industry Revenue (Million) Forecast, by Application 2019 & 2032
  28. Table 28: Rest of Middle East and Africa Ultra-Thin Glass Industry Revenue (Million) Forecast, by Application 2019 & 2032
  29. Table 29: Global Ultra-Thin Glass Industry Revenue Million Forecast, by Application 2019 & 2032
  30. Table 30: Global Ultra-Thin Glass Industry Revenue Million Forecast, by End-user Industry 2019 & 2032
  31. Table 31: Global Ultra-Thin Glass Industry Revenue Million Forecast, by Country 2019 & 2032
  32. Table 32: China Ultra-Thin Glass Industry Revenue (Million) Forecast, by Application 2019 & 2032
  33. Table 33: India Ultra-Thin Glass Industry Revenue (Million) Forecast, by Application 2019 & 2032
  34. Table 34: Japan Ultra-Thin Glass Industry Revenue (Million) Forecast, by Application 2019 & 2032
  35. Table 35: South Korea Ultra-Thin Glass Industry Revenue (Million) Forecast, by Application 2019 & 2032
  36. Table 36: Rest of Asia Pacific Ultra-Thin Glass Industry Revenue (Million) Forecast, by Application 2019 & 2032
  37. Table 37: Global Ultra-Thin Glass Industry Revenue Million Forecast, by Application 2019 & 2032
  38. Table 38: Global Ultra-Thin Glass Industry Revenue Million Forecast, by End-user Industry 2019 & 2032
  39. Table 39: Global Ultra-Thin Glass Industry Revenue Million Forecast, by Country 2019 & 2032
  40. Table 40: United States Ultra-Thin Glass Industry Revenue (Million) Forecast, by Application 2019 & 2032
  41. Table 41: Canada Ultra-Thin Glass Industry Revenue (Million) Forecast, by Application 2019 & 2032
  42. Table 42: Mexico Ultra-Thin Glass Industry Revenue (Million) Forecast, by Application 2019 & 2032
  43. Table 43: Global Ultra-Thin Glass Industry Revenue Million Forecast, by Application 2019 & 2032
  44. Table 44: Global Ultra-Thin Glass Industry Revenue Million Forecast, by End-user Industry 2019 & 2032
  45. Table 45: Global Ultra-Thin Glass Industry Revenue Million Forecast, by Country 2019 & 2032
  46. Table 46: Germany Ultra-Thin Glass Industry Revenue (Million) Forecast, by Application 2019 & 2032
  47. Table 47: United Kingdom Ultra-Thin Glass Industry Revenue (Million) Forecast, by Application 2019 & 2032
  48. Table 48: France Ultra-Thin Glass Industry Revenue (Million) Forecast, by Application 2019 & 2032
  49. Table 49: Italy Ultra-Thin Glass Industry Revenue (Million) Forecast, by Application 2019 & 2032
  50. Table 50: Rest of Europe Ultra-Thin Glass Industry Revenue (Million) Forecast, by Application 2019 & 2032
  51. Table 51: Global Ultra-Thin Glass Industry Revenue Million Forecast, by Application 2019 & 2032
  52. Table 52: Global Ultra-Thin Glass Industry Revenue Million Forecast, by End-user Industry 2019 & 2032
  53. Table 53: Global Ultra-Thin Glass Industry Revenue Million Forecast, by Country 2019 & 2032
  54. Table 54: Brazil Ultra-Thin Glass Industry Revenue (Million) Forecast, by Application 2019 & 2032
  55. Table 55: Argentina Ultra-Thin Glass Industry Revenue (Million) Forecast, by Application 2019 & 2032
  56. Table 56: Rest of South America Ultra-Thin Glass Industry Revenue (Million) Forecast, by Application 2019 & 2032
  57. Table 57: Global Ultra-Thin Glass Industry Revenue Million Forecast, by Application 2019 & 2032
  58. Table 58: Global Ultra-Thin Glass Industry Revenue Million Forecast, by End-user Industry 2019 & 2032
  59. Table 59: Global Ultra-Thin Glass Industry Revenue Million Forecast, by Country 2019 & 2032
  60. Table 60: Saudi Arabia Ultra-Thin Glass Industry Revenue (Million) Forecast, by Application 2019 & 2032
  61. Table 61: South Africa Ultra-Thin Glass Industry Revenue (Million) Forecast, by Application 2019 & 2032
  62. Table 62: Rest of Middle East and Africa Ultra-Thin Glass Industry Revenue (Million) Forecast, by Application 2019 & 2032


Frequently Asked Questions

1. What is the projected Compound Annual Growth Rate (CAGR) of the Ultra-Thin Glass Industry?

The projected CAGR is approximately > 5.00%.

2. Which companies are prominent players in the Ultra-Thin Glass Industry?

Key companies in the market include CSG Holding Co Ltd, Emerge Glass, Schott AG, Central Glass Co Ltd, AGC Glass Europe, Taiwan Glass Industry Corporation*List Not Exhaustive, Novalglass, Fraunhofer FEP, Nitto Boseki Co Ltd, Changzhou Almaden Co Ltd, Nippon Electric Glass Co Ltd, Corning Incorporated.

3. What are the main segments of the Ultra-Thin Glass Industry?

The market segments include Application, End-user Industry.

4. Can you provide details about the market size?

The market size is estimated to be USD XX Million as of 2022.

5. What are some drivers contributing to market growth?

; Growing Demand from Consumer Electronics; Other Drivers.

6. What are the notable trends driving market growth?

Growing Demand from Consumer Electronics.

7. Are there any restraints impacting market growth?

; High Cost of Raw Materials; Other Restraints.

8. Can you provide examples of recent developments in the market?

N/A

9. What pricing options are available for accessing the report?

Pricing options include single-user, multi-user, and enterprise licenses priced at USD 4750, USD 5250, and USD 8750 respectively.

10. Is the market size provided in terms of value or volume?

The market size is provided in terms of value, measured in Million.

11. Are there any specific market keywords associated with the report?

Yes, the market keyword associated with the report is "Ultra-Thin Glass Industry," which aids in identifying and referencing the specific market segment covered.

12. How do I determine which pricing option suits my needs best?

The pricing options vary based on user requirements and access needs. Individual users may opt for single-user licenses, while businesses requiring broader access may choose multi-user or enterprise licenses for cost-effective access to the report.

13. Are there any additional resources or data provided in the Ultra-Thin Glass Industry report?

While the report offers comprehensive insights, it's advisable to review the specific contents or supplementary materials provided to ascertain if additional resources or data are available.

14. How can I stay updated on further developments or reports in the Ultra-Thin Glass Industry?

To stay informed about further developments, trends, and reports in the Ultra-Thin Glass Industry, consider subscribing to industry newsletters, following relevant companies and organizations, or regularly checking reputable industry news sources and publications.


Methodology

Step 1 - Identification of Relevant Samples Size from Population Database

Step Chart
Bar Chart
Method Chart

Step 2 - Approaches for Defining Global Market Size (Value, Volume* & Price*)

Approach Chart
Top-down and bottom-up approaches are used to validate the global market size and estimate the market size for manufactures, regional segments, product, and application.

Note*: In applicable scenarios

Step 3 - Data Sources

Primary Research

  • Web Analytics
  • Survey Reports
  • Research Institute
  • Latest Research Reports
  • Opinion Leaders

Secondary Research

  • Annual Reports
  • White Paper
  • Latest Press Release
  • Industry Association
  • Paid Database
  • Investor Presentations
Analyst Chart

Step 4 - Data Triangulation

Involves using different sources of information in order to increase the validity of a study

These sources are likely to be stakeholders in a program - participants, other researchers, program staff, other community members, and so on.

Then we put all data in single framework & apply various statistical tools to find out the dynamic on the market.

During the analysis stage, feedback from the stakeholder groups would be compared to determine areas of agreement as well as areas of divergence

Additionally, after gathering mixed and scattered data from a wide range of sources, data is triangulated and correlated to come up with estimated figures which are further validated through primary mediums or industry experts, opinion leaders.

About Visionary Data Reports

Visionary Data Reports provides future-focused market research, advanced analytics, and strategic insights for technology, healthcare, green energy, and finance. Our reports help you anticipate trends, innovate, and lead in your industry. Our expert team combines primary research, data science, and industry knowledge to deliver actionable intelligence. We offer syndicated reports, custom analytics, and consulting services tailored to your business needs. At Visionary Data Reports, we are committed to quality, transparency, and client satisfaction. Every report is rigorously validated to ensure accuracy and relevance. Our global perspective and forward-thinking approach help you understand both current and emerging market dynamics.

Stay ahead with Visionary Data Reports. Subscribe to our newsletter for the latest insights and research highlights, and follow us on social media for real-time updates. Visionary Data Reports – Your Guide to Tomorrow’s Opportunities.

  • Home
  • About Us
  • Industries
    • Aerospace & Defense
    • Agriculture
    • Animal Nutrition & Wellness
    • Automotive
    • Chemicals & Materials
    • Consumer Goods and Services
    • Energy & Power
    • Financial Services and Investment Intelligence
    • Food & Beverage
    • Home and Property Improvement
    • Hospitality and Tourism
    • Logistics
    • Manufacturing Products and Services
    • Packaging
    • Professional and Commercial Services
    • Real Estate and Construction
    • Retail
    • Technology, Media and Telecom
    • Healthcare
  • Services
  • Contact
Main Logo
  • Home
  • About Us
  • Industries
    • Aerospace & Defense
    • Agriculture
    • Animal Nutrition & Wellness
    • Automotive
    • Chemicals & Materials
    • Consumer Goods and Services
    • Energy & Power
    • Financial Services and Investment Intelligence
    • Food & Beverage
    • Home and Property Improvement
    • Hospitality and Tourism
    • Logistics
    • Manufacturing Products and Services
    • Packaging
    • Professional and Commercial Services
    • Real Estate and Construction
    • Retail
    • Technology, Media and Telecom
    • Healthcare
  • Services
  • Contact
+17162654855
[email protected]

+17162654855

[email protected]

Business Address

Head Office

Ansec House 3 rd floor Tank Road, Yerwada, Pune, Maharashtra 411014

Contact Information

Craig Francis

Business Development Head

+17162654855

[email protected]

Secure Payment Partners

payment image
RetailLogisticsPackagingAutomotiveHealthcareAgricultureEnergy & PowerFood & BeverageAerospace & DefenseChemicals & MaterialsHospitality and TourismAnimal Nutrition & WellnessConsumer Goods and ServicesReal Estate and ConstructionHome and Property ImprovementTechnology, Media and TelecomManufacturing Products and ServicesFinancial Services and Investment Intelligence

© 2025 PRDUA Research & Media Private Limited, All rights reserved

Privacy Policy
Terms and Conditions
FAQ
artwork spiralartwork spiralRelated Reports
artwork underline

Exploring Growth Patterns in Aerospace Coatings Market Market

Explore the dynamic Aerospace Coatings Market, driven by growing aviation demand and advanced technologies. Discover market size, CAGR trends, key players, and regional insights for 2025-2033.

September 2025
Base Year: 2024
No Of Pages: 180
Price: $4750

Asia-Pacific Construction Chemicals Market 2025-2033 Market Analysis: Trends, Dynamics, and Growth Opportunities

The size of the Asia-Pacific Construction Chemicals Market market was valued at USD XX Million in 2024 and is projected to reach USD XXX Million by 2033, with an expected CAGR of 4.00">> 4.00% during the forecast period.

September 2025
Base Year: 2024
No Of Pages: 140
Price: $3800

Vinyl Acetate Industry Drivers of Growth: Opportunities to 2033

Explore the dynamic Vinyl Acetate market's projected growth, driven by solar, automotive, and construction sectors. Discover key trends, restraints, and regional opportunities, with a focus on Polyvinyl Acetate, Polyvinyl Alcohol, and EVA.

September 2025
Base Year: 2024
No Of Pages: 180
Price: $4750

C9 Resin Market CAGR Growth Drivers and Trends: Forecasts 2025-2033

Explore the dynamic C9 Resin Market, with a projected market size of $11.65 billion in 2025 and a strong CAGR of 6.5% through 2033. Discover growth drivers, regional trends, and key applications in adhesives, coatings, and more.

September 2025
Base Year: 2024
No Of Pages: 180
Price: $4750

Copper Magnet Wire Market Strategic Insights for 2025 and Forecasts to 2033: Market Trends

The Copper Magnet Wire Market is booming, projected to exceed a 5% CAGR through 2033, driven by electric vehicles and renewable energy. Discover key trends, regional insights, and leading companies shaping this dynamic industry. Explore the market analysis now!

August 2025
Base Year: 2024
No Of Pages: 150
Price: $4750

Bio Acetic Acid Industry Market Outlook and Strategic Insights

Discover the booming bio-acetic acid market! This in-depth analysis reveals a $220.6M (2025) market projected for significant growth (CAGR >4%) driven by sustainability and diverse applications. Explore key trends, regional insights, and leading companies shaping this dynamic industry.

August 2025
Base Year: 2024
No Of Pages: 180
Price: $4750

Qatar Passenger Vehicle Lubricant Market Market Predictions and Opportunities 2025-2033

Discover the growth potential of the Qatar passenger vehicle lubricant market. This in-depth analysis reveals market size, CAGR (4.04%), key drivers, trends, and restraints impacting engine oils, greases, hydraulic fluids, and transmission oils. Leading companies and regional insights are included. Project your business strategies with our 2019-2033 forecast.

August 2025
Base Year: 2024
No Of Pages: 197
Price: $3800

Singapore Automotive Lubricants Industry Analysis 2025 and Forecasts 2033: Unveiling Growth Opportunities

Discover the booming Singapore automotive lubricants market! This in-depth analysis reveals a CAGR of 4.14%, driven by increasing vehicle ownership and advanced technologies. Explore market size, key players (ExxonMobil, Shell, FUCHS, etc.), and future trends shaping this dynamic sector from 2025-2033.

August 2025
Base Year: 2024
No Of Pages: 180
Price: $3800

Saturated Polyester Resins Market Projected to Grow at XX CAGR: Insights and Forecasts 2025-2033

The saturated polyester resins market is booming, projected to reach $7.39 billion by 2033 with a 4.24% CAGR. Driven by automotive, packaging, and industrial coatings demand, this market analysis explores key trends, restraints, and leading companies like Evonik and Arkema. Discover regional market shares and future growth projections.

August 2025
Base Year: 2024
No Of Pages: 150
Price: $4750

Middle-East and Africa Sodium Sulfide Industry Market Drivers and Challenges: Trends 2025-2033

Discover the booming Middle East & Africa sodium sulfide market! Our in-depth analysis reveals a CAGR exceeding 1.5%, driven by water treatment, pulp & paper, and textile industries. Explore key trends, restraints, and leading players shaping this dynamic sector.

August 2025
Base Year: 2024
No Of Pages: 140
Price: $4750

South Africa Protective Coatings Market Market Dynamics: Drivers and Barriers to Growth 2025-2033

Discover the booming South African protective coatings market! Our in-depth analysis reveals a $123.67M market in 2025, projected for strong growth driven by infrastructure, mining, and oil & gas. Explore market trends, segmentation (acrylic, epoxy, waterborne coatings etc.), key players, and future forecasts to 2033.

August 2025
Base Year: 2024
No Of Pages: 180
Price: $3800

Unlocking Insights for Marble Market Growth Strategies

Discover the booming global marble market! This comprehensive analysis reveals a $20.81B market in 2025, projected to grow at a 4.61% CAGR through 2033. Learn about key drivers, trends, restraints, leading companies (Antolini, Levantina), and regional market shares. Explore the opportunities and challenges in this lucrative sector.

August 2025
Base Year: 2024
No Of Pages: 234
Price: $4750

Automotive Plastics Industry Market Analysis and Growth Roadmap

Discover the booming automotive plastics market, projected to reach \$XXX million by 2033 with a CAGR exceeding 10%. Explore key drivers, trends, and regional insights, including the impact of EVs and sustainable materials. Learn about leading players like BASF, LANXESS, and ExxonMobil.

August 2025
Base Year: 2024
No Of Pages: 234
Price: $4750

Consumer Trends Driving India Passenger Vehicles Lubricants Market Market Growth

Discover the booming India Passenger Vehicles Lubricants Market! This in-depth analysis reveals a CAGR of 6.14% driven by rising vehicle sales and demand for high-performance lubricants. Learn about key players, market trends, and future growth projections.

August 2025
Base Year: 2024
No Of Pages: 197
Price: $3800

Exploring Battery Anode Materials Market Market Ecosystem: Insights to 2033

Discover the booming Battery Anode Materials market analysis! Explore key trends, drivers, restraints, and regional growth projections for 2025-2033, featuring insights on lithium, silicon, graphite, and leading companies. Learn about the significant CAGR and potential for investment in this rapidly expanding sector.

August 2025
Base Year: 2024
No Of Pages: 234
Price: $4750

Glass Insulation Market Market Report: Strategic Insights

Discover the booming glass insulation market! Learn about its 6%+ CAGR, key drivers like energy efficiency regulations, leading companies like Saint-Gobain & PPG Industries, and future trends shaping this multi-billion dollar industry through 2033. Get insights into market size, segmentation, and regional growth projections.

August 2025
Base Year: 2024
No Of Pages: 234
Price: $4750

Emerging Trends in Europe Insulated Concrete Form (ICF) Market: A Technology Perspective 2025-2033

The European Insulated Concrete Form (ICF) market is booming, projected to exceed €1.5 billion by 2033, driven by energy efficiency demands and sustainable construction trends. This analysis explores market size, growth drivers, key players, and regional trends across Germany, UK, France, and other European nations. Discover the latest insights into ICF materials, applications, and future opportunities.

August 2025
Base Year: 2024
No Of Pages: 180
Price: $4750

TPS Industry Market Expansion: Growth Outlook 2025-2033

Discover the booming thermoplastic starch (TPS) market! This comprehensive analysis reveals a 7.39% CAGR, driven by eco-conscious consumers and sustainable packaging needs. Explore market size, regional trends, key players (Kuraray, Rodenburg), and future projections through 2033. Learn about extrusion molding, injection molding, and applications in bags, films, and 3D printing.

August 2025
Base Year: 2024
No Of Pages: 150
Price: $4750

Advanced Carbon Products Industry Planning for the Future: Key Trends 2025-2033

Discover the booming advanced carbon products market! This comprehensive analysis reveals a 9.82% CAGR, driven by aerospace, automotive, and electronics demands. Explore market size, segmentation, key players, and future trends in carbon fibers, graphene, and more. Invest in the future of materials science.

August 2025
Base Year: 2024
No Of Pages: 180
Price: $4750

Speciality Chemicals Market: Harnessing Emerging Innovations for Growth 2025-2033

The global specialty chemicals market is booming, projected to reach [estimated 2033 value based on CAGR] by 2033. Driven by construction, electronics, and sustainable solutions, this market analysis reveals key trends, segments (water treatment, adhesives, plastics, etc.), leading companies, and regional growth. Discover insights into CAGR, market size, and future projections.

August 2025
Base Year: 2024
No Of Pages: 150
Price: $4750

United States Commercial Vehicles Lubricants Market Insightful Analysis: Trends, Competitor Dynamics, and Opportunities 2025-2033

Discover the latest insights into the booming US Commercial Vehicles Lubricants Market. This comprehensive analysis reveals market size, growth projections (2025-2033), key players (ExxonMobil, Castrol, Shell, etc.), and emerging trends in engine oils, greases, and other lubricants for commercial vehicles. Learn about market drivers, restraints, and regional breakdowns.

August 2025
Base Year: 2024
No Of Pages: 180
Price: $3800

Glass-Ceramics Industry Market Overview: Growth and Insights

Discover the booming glass-ceramics market forecast to 2033! Explore key drivers, trends, and regional analysis revealing a CAGR exceeding 6%. Learn about leading companies and applications in building, electronics, and healthcare. Get insights into market size and segmentation.

August 2025
Base Year: 2024
No Of Pages: 180
Price: $4750

Exploring Regional Dynamics of Primer Market Market 2025-2033

Discover the booming primer market's potential! Our in-depth analysis reveals a $21.34B market in 2025, growing at a 5.91% CAGR until 2033, driven by automotive, construction, and industrial sectors. Explore key trends, leading companies, and regional insights to capitalize on this lucrative opportunity.

August 2025
Base Year: 2024
No Of Pages: 234
Price: $3,950

Future Trends Shaping US Activated Carbon Market Growth

Discover the booming US Activated Carbon Market! This in-depth analysis reveals key trends, growth drivers (water purification, gas purification), and leading companies from 2019-2033, including Cabot, Calgon Carbon, and Kuraray. Learn about market segmentation, regional variations, and future projections for this vital industry.

August 2025
Base Year: 2024
No Of Pages: 197
Price: $3800

Engineered Wood Industry Growth Forecast and Consumer Insights

Discover the booming engineered wood market! Our analysis reveals a CAGR exceeding 5%, driven by sustainable construction and innovative materials. Learn about key players, market trends, and future projections for LVL, OSB, CLT, and more in this comprehensive report.

August 2025
Base Year: 2024
No Of Pages: 234
Price: $4750

Understanding Growth Challenges in Silicone Surfactants Market Market 2025-2033

Discover the booming silicone surfactants market, projected to exceed $3 billion by 2033. Explore key drivers, trends, and leading companies shaping this dynamic industry. Learn about regional growth and market segmentation for informed investment decisions.

August 2025
Base Year: 2024
No Of Pages: 234
Price: $4750

Consumer Behavior and Self-Healing Coatings Market Trends

The self-healing coatings market is booming, projected to reach $2.71B in 2025 with a CAGR exceeding 21%! Discover key trends, drivers, and leading companies shaping this innovative sector across automotive, aerospace, and construction. Explore market segmentation and regional analysis for insightful investment opportunities.

August 2025
Base Year: 2024
No Of Pages: 150
Price: $4750

Silane Industry Charting Growth Trajectories: Analysis and Forecasts 2025-2033

Discover the booming silane market! This comprehensive analysis reveals a $319.39 million market in 2025, projected to grow at a 5.7% CAGR through 2033, driven by construction, automotive, and electronics applications. Explore key trends, restraints, and regional insights for silanes in plastics, rubber, coatings, and more.

August 2025
Base Year: 2024
No Of Pages: 180
Price: $4750

Paints and Protective Coatings in Nigerian Market Competitive Strategies: Trends and Forecasts 2025-2033

Discover the booming Nigerian paints and protective coatings market! This in-depth analysis reveals a CAGR exceeding 4%, driven by infrastructure growth and rising demand. Explore market segmentation, key players (Akzo Nobel, PPG Industries, Berger Paints), and future trends impacting this lucrative sector. Learn how to capitalize on opportunities in this rapidly expanding market.

August 2025
Base Year: 2024
No Of Pages: 180
Price: $3800

Analyzing Consumer Behavior in Pervious Concrete Market Market

Discover the booming pervious concrete market, projected to exceed a CAGR of 6% through 2033. This in-depth analysis explores market drivers, trends, restraints, and key players shaping this sustainable construction material's future. Learn about regional growth, application segments, and investment opportunities in the pervious concrete industry.

August 2025
Base Year: 2024
No Of Pages: 234
Price: $4750

Thermal Spray Equipment Industry Unlocking Growth Opportunities: Analysis and Forecast 2025-2033

The global thermal spray equipment market is booming, projected to reach [estimated 2033 value] by 2033, with a CAGR of 5.11%. Discover key market trends, leading companies, and regional growth opportunities in this in-depth analysis of thermal spray coating systems, dust collection equipment, and more.

August 2025
Base Year: 2024
No Of Pages: 180
Price: $4750

Deep Dive into Europe, Middle-East and Africa Hot-melt Adhesives Market: Comprehensive Growth Analysis 2025-2033

Discover the booming EMEA hot-melt adhesives market! This in-depth analysis reveals a CAGR exceeding 5.5%, driven by construction, packaging, and footwear industries. Learn about key trends, major players like Huntsman and Henkel, and future growth projections for 2025-2033.

August 2025
Base Year: 2024
No Of Pages: 234
Price: $4750

Africa Engineering Plastics Market Market Dynamics and Growth Analysis

The Africa Engineering Plastics Market is booming, projected to reach $3.5 billion by 2033 with a 7% CAGR. Driven by infrastructure development and automotive growth, this report analyzes market trends, key players (Covestro, Indorama), and regional opportunities in North and Sub-Saharan Africa.

August 2025
Base Year: 2024
No Of Pages: 197
Price: $3800

South America Polyurethane (PU) Hot-melt Adhesives Market Market’s Growth Catalysts

Discover the booming South American Polyurethane (PU) Hot-melt Adhesives market! This in-depth analysis reveals a CAGR exceeding 6%, driven by packaging, automotive, and healthcare growth. Explore market trends, key players (Henkel, 3M, BASF), and regional breakdowns (Brazil, Argentina). Learn about the future of PU hot-melt adhesives in South America.

August 2025
Base Year: 2024
No Of Pages: 234
Price: $4750

Strategic Insights into Cooling Water Treatment Chemicals Market Market Trends

The Cooling Water Treatment Chemicals market is booming, projected to reach \$18.8B by 2033 with a CAGR of 5.8%. This in-depth analysis explores market drivers, trends, restraints, and key players like Ecolab and Kemira across key regions including North America, Europe, and Asia-Pacific. Learn more about this lucrative market opportunity.

August 2025
Base Year: 2024
No Of Pages: 180
Price: $3,950

5-Hydroxytryptophan (5-HTP) Market 2025-2033 Trends: Unveiling Growth Opportunities and Competitor Dynamics

Discover the booming 5-HTP market forecast to 2033! This comprehensive analysis reveals key drivers, trends, and regional breakdowns, including insights into leading companies and applications in dietary supplements, food & beverage, and medical sectors. Learn about the CAGR, market size, and future growth potential of 5-Hydroxytryptophan.

August 2025
Base Year: 2024
No Of Pages: 234
Price: $4750

Superhydrophobic Coating Market Unlocking Growth Potential: Analysis and Forecasts 2025-2033

Discover the booming superhydrophobic coating market! Our in-depth analysis reveals impressive growth projections (2025-2033) driven by innovation in self-cleaning surfaces, anti-icing, and corrosion prevention. Learn about market size, CAGR, regional trends, and key applications in automotive, aerospace, and construction.

August 2025
Base Year: 2024
No Of Pages: 234
Price: $4750

Europe Waterborne Adhesives Industry Market’s Evolution: Key Growth Drivers 2025-2033

Discover the booming European waterborne adhesives market! This in-depth analysis reveals key trends, drivers, and restraints impacting growth through 2033. Explore market size, segmentation (acrylics, PVA, EVA), top players (Henkel, 3M, Sika), and regional insights. Learn how sustainability and construction are shaping this €5B+ market.

August 2025
Base Year: 2024
No Of Pages: 234
Price: $4750

Colombia Automotive Lubricants Industry Competitive Strategies: Trends and Forecasts 2025-2033

Discover the booming Colombian automotive lubricants market! This in-depth analysis reveals a projected CAGR of 4.90% to 2033, driven by rising vehicle sales and demand for high-performance lubricants. Learn about key players, market segmentation, and future growth opportunities in this dynamic sector.

August 2025
Base Year: 2024
No Of Pages: 197
Price: $3800

Hot-melt Adhesives Market in Europe Insightful Market Analysis: Trends and Opportunities 2025-2033

Discover the booming European hot-melt adhesives market! This comprehensive analysis reveals key trends, drivers, and restraints shaping this €2.5 billion market (2025 est.), with a CAGR exceeding 5.5% through 2033. Explore market segmentation, leading companies, and regional growth projections.

August 2025
Base Year: 2024
No Of Pages: 150
Price: $4750

Thermal Barrier Coatings Market in Focus: Growth Trajectories and Strategic Insights 2025-2033

The Thermal Barrier Coatings (TBC) market is booming, projected to reach $1.7 billion by 2033 with a 4.31% CAGR. Driven by aerospace, automotive, and power generation needs, this report analyzes market trends, key players (Honeywell, Saint-Gobain), regional insights, and future growth potential. Discover market segmentation and investment opportunities in TBC technology.

August 2025
Base Year: 2024
No Of Pages: 234
Price: $4750

North America Thermal Spray Equipment Market in Emerging Markets: Analysis and Projections 2025-2033

Discover the booming North American thermal spray equipment market! This comprehensive analysis reveals a CAGR exceeding 7%, driven by aerospace, automotive, and energy sector growth. Explore key trends, leading companies, and future projections for this lucrative industry.

August 2025
Base Year: 2024
No Of Pages: 234
Price: $4750

Growth Strategies in USA Surface Water Treatment Chemicals Industry Market: 2025-2033 Outlook

Discover the booming US surface water treatment chemicals market. Our comprehensive analysis reveals a $3.5 billion market in 2025, projected to reach $5.2 billion by 2033, driven by stringent regulations & technological advancements. Explore key trends and growth forecasts for coagulants, disinfectants, and more.

August 2025
Base Year: 2024
No Of Pages: 120
Price: $3,950

Market Projections for Low VOC Paint Market Industry 2025-2033

Discover the booming low VOC paint market! Explore its $8.84B valuation, 5.60%+ CAGR, key drivers, regional breakdowns (North America, Europe, Asia Pacific), top companies, and future trends in this comprehensive market analysis. Learn about water-borne vs. solvent-borne formulations and the impact of environmental regulations.

August 2025
Base Year: 2024
No Of Pages: 180
Price: $4750

Decorative Laminates Industry Report Probes the XXX Million Size, Share, Growth Report and Future Analysis by 2033

Discover the booming decorative laminates market! Explore key trends, drivers, and restraints shaping this $25 billion+ industry. Learn about leading companies, regional growth projections, and the future of this dynamic sector. Get insights into furniture, flooring, and construction applications.

August 2025
Base Year: 2024
No Of Pages: 234
Price: $4750

Future-Ready Strategies for Paraphenylenediamine Market Market Growth

Discover the latest market trends and growth forecasts for the paraphenylenediamine (PPD) market. This comprehensive analysis covers key drivers, restraints, regional segments (Asia Pacific, North America, Europe), major players (DuPont, LANXESS), and future projections through 2033, highlighting opportunities in dyes, rubber, and aramid fiber applications.

August 2025
Base Year: 2024
No Of Pages: 234
Price: $4750

Consumer Behavior and Calcium Peroxide Industry Trends

Discover the booming Calcium Peroxide market! Explore its $2.36B valuation, 3.64% CAGR, key applications (bleaching, food processing, seed treatment), top players, and regional growth projections to 2033. Gain insights for investment and strategic planning.

August 2025
Base Year: 2024
No Of Pages: 234
Price: $4750

Understanding Growth Challenges in Ultra High Performance Concrete (UHPC) Market Market 2025-2033

The Ultra High Performance Concrete (UHPC) market is booming, projected to reach \$532.55 million in 2025 and grow at a CAGR exceeding 8% through 2033. Discover key drivers, trends, and top companies shaping this dynamic sector. Learn more about UHPC applications in infrastructure and construction.

August 2025
Base Year: 2024
No Of Pages: 234
Price: $4750

Overcoming Challenges in Iran Commercial Vehicle Lubricant Industry Market: Strategic Insights 2025-2033

Discover the growth trajectory of Iran's commercial vehicle lubricant market. Our analysis reveals a steady CAGR of 2.14%, driven by infrastructure development and increased vehicle numbers. Learn about key players, regional trends, and future projections to 2033.

August 2025
Base Year: 2024
No Of Pages: 197
Price: $3800

Drivers of Change in MEA Engineering Plastics Industry Market 2025-2033

Discover the booming MEA Engineering Plastics market! This comprehensive analysis reveals key trends, growth drivers (infrastructure, automotive), restraints, and leading companies from 2019-2033, projecting a CAGR exceeding 5%. Learn about regional market shares in Saudi Arabia, UAE, and beyond. Invest wisely in this high-growth sector.

August 2025
Base Year: 2024
No Of Pages: 234
Price: $4750