
Key Insights
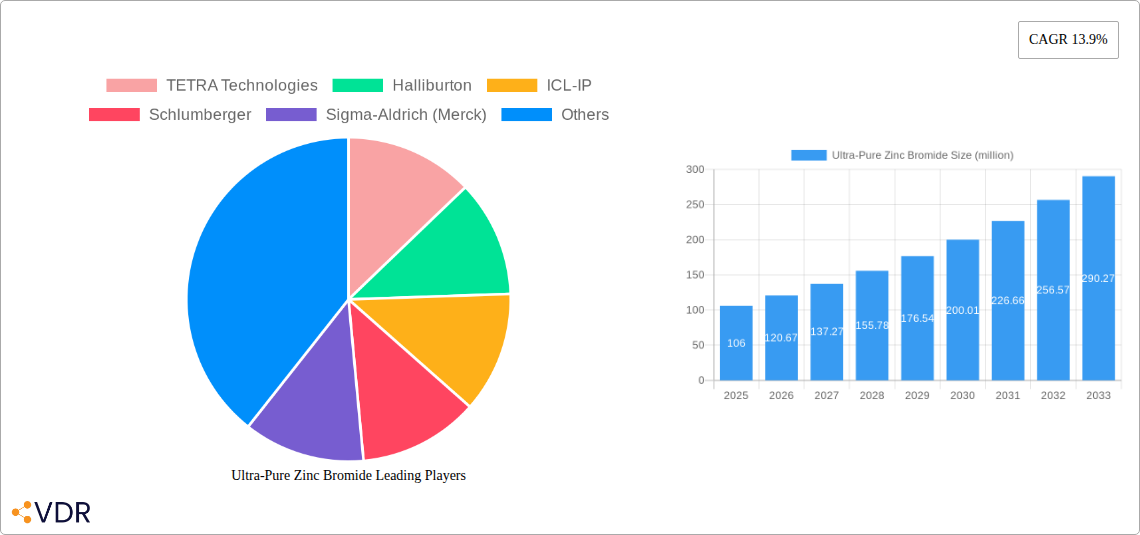
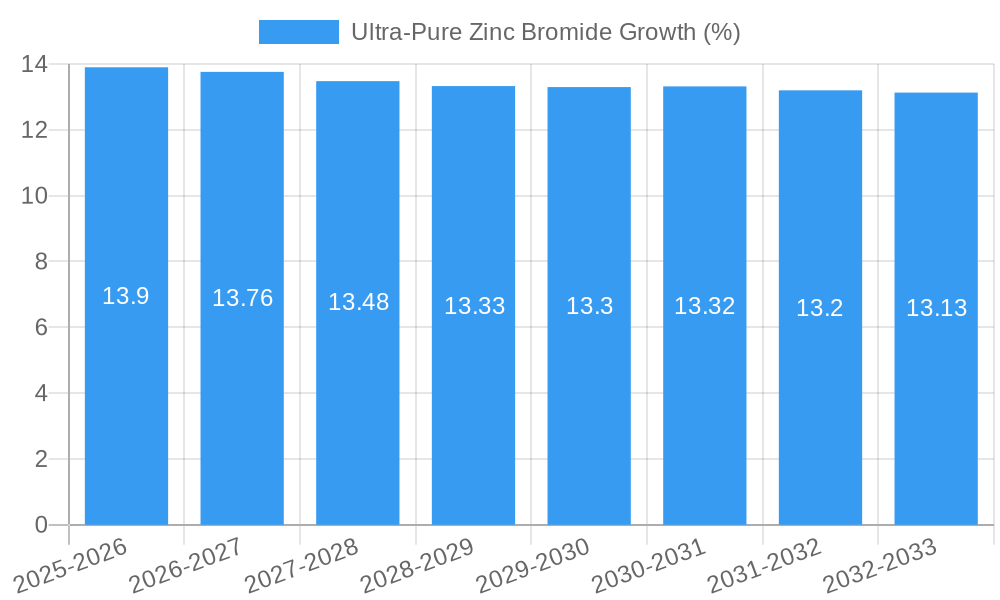
The global Ultra-Pure Zinc Bromide market is poised for substantial growth, with a current market size of approximately $106 million. Projected to expand at a robust Compound Annual Growth Rate (CAGR) of 13.9% from 2025 to 2033, the market's valuation is expected to reach significantly higher figures, driven by escalating demand from critical sectors like Oil & Gas and the burgeoning Batteries & Energy Storage industry. The Oil & Gas sector utilizes ultra-pure zinc bromide primarily as a completion fluid in high-pressure, high-temperature wells due to its superior density and thermal stability, offering enhanced operational efficiency and reservoir protection. Concurrently, the rapid advancements and widespread adoption of advanced battery technologies, particularly flow batteries, are creating a substantial new demand avenue for ultra-pure zinc bromide as a key electrolyte component. This surge in the energy storage sector is a pivotal driver, aligning with global decarbonization efforts and the increasing integration of renewable energy sources. The market's expansion is further supported by ongoing research and development focused on improving production processes and exploring novel applications, promising a dynamic and lucrative future for this specialized chemical.
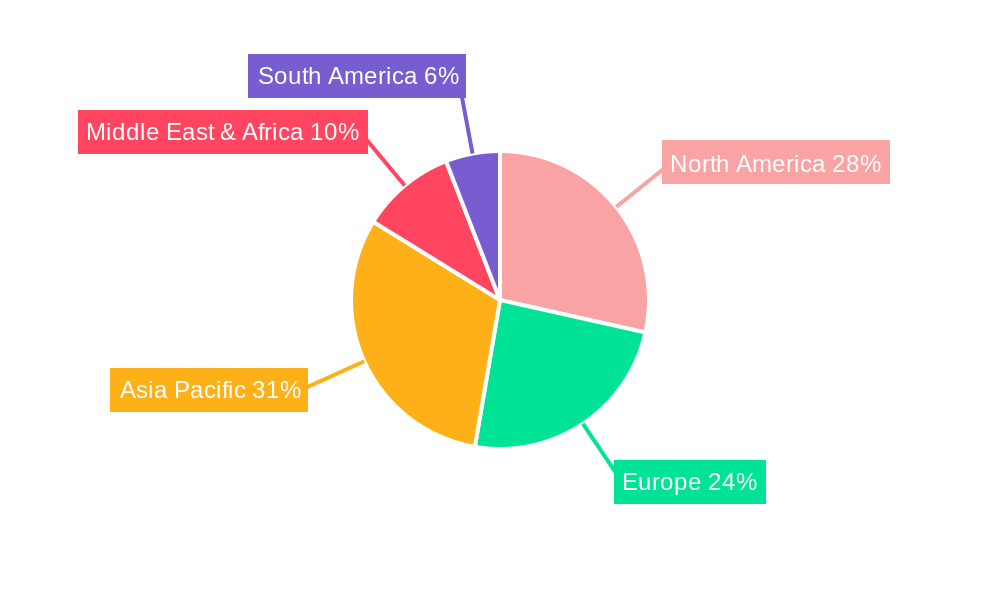
The market's growth trajectory, however, is not without its challenges. While the demand from key application segments is strong, potential restraints could emerge from the volatility in raw material prices, specifically bromine and zinc, which are subject to global supply-demand fluctuations and geopolitical factors. Stringent environmental regulations concerning the production and disposal of brominated compounds, while necessary for sustainability, could also impose additional operational costs and require significant investment in compliance. Despite these potential headwinds, the strong underlying demand from essential industries, coupled with the increasing focus on high-performance energy storage solutions, is expected to outweigh these limitations. The market is segmented into powder and solution forms, with the solution form likely experiencing higher demand due to its direct applicability in the aforementioned sectors. Geographically, North America and Asia Pacific are anticipated to be key growth regions, driven by their significant presence in the oil and gas industry and the rapid expansion of renewable energy and battery manufacturing capacities, respectively.
This in-depth report delivers a definitive analysis of the global Ultra-Pure Zinc Bromide market, a critical compound with burgeoning applications across diverse industries. Spanning the historical period of 2019-2024, with a base year of 2025 and a comprehensive forecast extending to 2033, this report provides actionable intelligence for stakeholders. We meticulously examine market dynamics, growth trajectories, regional dominance, product innovations, and the intricate interplay of drivers, barriers, and emerging opportunities.
Ultra-Pure Zinc Bromide Market Dynamics & Structure
The global Ultra-Pure Zinc Bromide market exhibits a moderately concentrated structure, characterized by the presence of established chemical manufacturers and specialized players. Technological innovation is a significant driver, particularly advancements in purification techniques leading to higher purity grades essential for sophisticated applications. Regulatory frameworks, while evolving, generally support the safe production and handling of zinc bromide compounds. Competitive product substitutes are limited for applications demanding its unique properties, though alternative chemistries exist in broader industrial contexts. End-user demographics are increasingly driven by the energy sector's demand for advanced battery chemistries and the oil and gas industry's reliance on high-density completion fluids. Mergers & Acquisitions (M&A) trends are observed as companies seek to consolidate market share, acquire proprietary technologies, and expand their geographical reach. The market is projected to see an M&A deal volume of approximately 20-30 units over the forecast period, with strategic acquisitions focusing on companies with advanced purification capabilities. Innovation barriers include the high capital expenditure required for advanced purification infrastructure and the stringent quality control measures necessary for achieving ultra-high purity levels.
Ultra-Pure Zinc Bromide Growth Trends & Insights
The global Ultra-Pure Zinc Bromide market is poised for significant expansion, driven by a confluence of technological advancements and escalating demand from key end-user industries. Our analysis, leveraging comprehensive market data, indicates a robust Compound Annual Growth Rate (CAGR) of approximately 6.5% during the forecast period (2025-2033). The market size, currently estimated at $550 million units in 2025, is projected to reach $880 million units by 2033. This growth trajectory is underpinned by increasing adoption rates in the Batteries & Energy Storage segment, particularly for zinc-based flow batteries that offer scalability and safety advantages. Technological disruptions, such as improvements in electrolyte formulation and electrode materials, are enhancing the performance and cost-effectiveness of these batteries, thus accelerating their market penetration. Consumer behavior shifts, while less direct, are indirectly influencing demand through a growing global emphasis on renewable energy sources and grid-scale energy storage solutions. The Oil & Gas sector continues to be a stable contributor, with ultra-pure zinc bromide serving as a high-density, solids-free completion fluid, essential for optimizing well productivity and minimizing formation damage. Market penetration in emerging economies, driven by infrastructure development and industrialization, is expected to further fuel this growth.
Dominant Regions, Countries, or Segments in Ultra-Pure Zinc Bromide
The Batteries & Energy Storage segment is emerging as the dominant force driving growth in the global Ultra-Pure Zinc Bromide market, projected to account for approximately 40% of the total market share by 2033. This ascendancy is propelled by the accelerating global transition towards renewable energy and the critical need for reliable and scalable energy storage solutions.
- North America is anticipated to lead in terms of market share, driven by substantial investments in advanced battery research and development, particularly in the United States. Favorable government policies supporting clean energy initiatives and a robust industrial base for chemical manufacturing contribute significantly to this dominance.
- The Asia-Pacific region is expected to witness the fastest growth rate, fueled by rapid industrialization, increasing demand for energy storage in grid modernization, and the burgeoning electric vehicle market in countries like China and South Korea. Significant investments in new manufacturing facilities and research centers are underway.
- In the Oil & Gas sector, the Middle East and North America remain key regions due to their extensive oil and gas exploration and production activities. The demand for high-performance completion fluids, where ultra-pure zinc bromide excels, is consistently high in these regions.
- Within product types, the Solution form of ultra-pure zinc bromide is expected to dominate market share, as it is directly applicable in most industrial processes, particularly in battery electrolytes and completion fluids. The Powder form, while crucial for certain synthesis processes, represents a smaller but important niche.
- Economic policies promoting green technologies and substantial infrastructure investments in energy storage projects are key drivers for the dominance of the Batteries & Energy Storage segment.
- Regulatory support for grid-scale battery deployment and the phasing out of fossil fuel-intensive energy sources are further bolstering the demand for zinc bromide-based solutions.
Ultra-Pure Zinc Bromide Product Landscape
The product landscape of Ultra-Pure Zinc Bromide is characterized by continuous advancements aimed at enhancing purity levels and optimizing performance for specific applications. Innovations focus on developing ultra-high purity grades (e.g., 99.999% purity) essential for sensitive electronic applications and advanced battery chemistries. Unique selling propositions lie in its high density, low corrosivity when properly formulated, and excellent electrochemical properties. Technological advancements in synthesis and purification processes, including advanced crystallization and membrane filtration techniques, are key differentiators for manufacturers. Applications are expanding beyond traditional Oil & Gas completion fluids into novel battery electrolytes and specialized chemical synthesis.
Key Drivers, Barriers & Challenges in Ultra-Pure Zinc Bromide
Key Drivers:
- Growing Demand for Energy Storage: The exponential rise in renewable energy adoption and the need for grid-scale energy storage solutions are primary growth catalysts for zinc-bromine flow batteries, a major application for ultra-pure zinc bromide.
- Advancements in Oil & Gas Exploration: Continued exploration and production activities, particularly in challenging environments, necessitate the use of high-density, solids-free completion fluids, where ultra-pure zinc bromide offers superior performance.
- Technological Innovation in Purity: Ongoing improvements in purification technologies are leading to higher purity grades, opening doors for new and more demanding applications.
- Environmental Regulations: Stricter environmental regulations in various industries are driving the adoption of safer and more efficient chemical solutions, which can benefit ultra-pure zinc bromide.
Barriers & Challenges:
- High Production Costs: The multi-stage purification process required to achieve ultra-high purity can be capital-intensive and lead to higher production costs, impacting price competitiveness.
- Supply Chain Volatility: Reliance on specific raw material sources and potential geopolitical disruptions can lead to supply chain volatility and price fluctuations for zinc and bromine.
- Competition from Alternative Technologies: While unique, ultra-pure zinc bromide faces indirect competition from other battery chemistries and alternative completion fluid formulations, particularly in cost-sensitive markets.
- Safety and Handling Concerns: Although relatively safe when handled properly, stringent safety protocols and specialized handling equipment are required, adding to operational complexities and costs.
Emerging Opportunities in Ultra-Pure Zinc Bromide
Emerging opportunities for Ultra-Pure Zinc Bromide lie in the expansion of its application in next-generation energy storage systems beyond current zinc-bromine flow batteries, exploring its potential in solid-state or hybrid battery architectures. Furthermore, its unique properties make it a promising candidate for specialized catalysts in advanced chemical synthesis and in niche applications within the electronics industry requiring extremely high purity. Untapped markets in developing economies looking to rapidly scale up their renewable energy infrastructure also present significant growth potential. The increasing focus on circular economy principles may also drive innovation in recycling and recovery processes for zinc bromide from spent batteries and industrial waste.
Growth Accelerators in the Ultra-Pure Zinc Bromide Industry
The long-term growth of the Ultra-Pure Zinc Bromide industry will be significantly accelerated by breakthroughs in cost-effective and scalable purification technologies. Strategic partnerships between chemical manufacturers and leading energy storage companies are crucial for co-developing optimized electrolyte formulations and testing new battery designs. Market expansion strategies targeting emerging economies with rapidly growing energy demands, coupled with government incentives for renewable energy deployment, will act as significant catalysts. Furthermore, research into novel applications in areas like advanced materials and specialized chemical processes will open up new revenue streams and solidify the compound's market position.
Key Players Shaping the Ultra-Pure Zinc Bromide Market
- TETRA Technologies
- Halliburton
- ICL-IP
- Schlumberger
- Sigma-Aldrich (Merck)
- Chemcon Speciality Chemicals Limited
- Thermo Scientific Alfa Aesar
- Honeywell
- TCI Chemical
- Shouguang Xinwanshun Chemical
- Shandong Weitai Fine Chemical
- ChemScene
- Wako Pure Chemical Industries (FUJIFILM)
- MODY CHEMI PHARMA
- Weifang Tianfu Chemical Technology
- TRC (LGC Limited)
- Shouguang Honghai Chemical
Notable Milestones in Ultra-Pure Zinc Bromide Sector
- 2020: Increased investment in R&D for zinc-based flow batteries by major energy storage companies.
- 2021: Development of new, more efficient purification methods leading to higher purity zinc bromide.
- 2022: Strategic partnerships formed between zinc bromide producers and oilfield service providers to enhance supply chain reliability.
- 2023: Significant advancements in the cost-effectiveness and lifespan of zinc-bromine flow battery systems, driving increased market interest.
- 2024: Expansion of production capacity by key players to meet growing demand from the renewable energy sector.
In-Depth Ultra-Pure Zinc Bromide Market Outlook
The future outlook for the Ultra-Pure Zinc Bromide market is overwhelmingly positive, driven by the sustained global push towards decarbonization and advanced industrial processes. Growth accelerators such as ongoing innovations in battery technology, particularly in enhancing the energy density and cycle life of zinc-bromine flow batteries, will continue to fuel demand. Strategic collaborations between manufacturers and end-users will pave the way for tailored solutions and market penetration in new geographical regions. The increasing recognition of zinc bromide's environmental advantages over certain alternatives will further solidify its market position, making it a vital component in the global transition to a sustainable energy future and advanced chemical applications.
Ultra-Pure Zinc Bromide Segmentation
-
1. Application
- 1.1. Oil & Gas
- 1.2. Batteries & Energy Storage
- 1.3. Others
-
2. Types
- 2.1. Powder
- 2.2. Solution
Ultra-Pure Zinc Bromide Segmentation By Geography
-
1. North America
- 1.1. United States
- 1.2. Canada
- 1.3. Mexico
-
2. South America
- 2.1. Brazil
- 2.2. Argentina
- 2.3. Rest of South America
-
3. Europe
- 3.1. United Kingdom
- 3.2. Germany
- 3.3. France
- 3.4. Italy
- 3.5. Spain
- 3.6. Russia
- 3.7. Benelux
- 3.8. Nordics
- 3.9. Rest of Europe
-
4. Middle East & Africa
- 4.1. Turkey
- 4.2. Israel
- 4.3. GCC
- 4.4. North Africa
- 4.5. South Africa
- 4.6. Rest of Middle East & Africa
-
5. Asia Pacific
- 5.1. China
- 5.2. India
- 5.3. Japan
- 5.4. South Korea
- 5.5. ASEAN
- 5.6. Oceania
- 5.7. Rest of Asia Pacific
Ultra-Pure Zinc Bromide REPORT HIGHLIGHTS
| Aspects | Details |
|---|---|
| Study Period | 2019-2033 |
| Base Year | 2024 |
| Estimated Year | 2025 |
| Forecast Period | 2025-2033 |
| Historical Period | 2019-2024 |
| Growth Rate | CAGR of 13.9% from 2019-2033 |
| Segmentation |
|
Table of Contents
- 1. Introduction
- 1.1. Research Scope
- 1.2. Market Segmentation
- 1.3. Research Methodology
- 1.4. Definitions and Assumptions
- 2. Executive Summary
- 2.1. Introduction
- 3. Market Dynamics
- 3.1. Introduction
- 3.2. Market Drivers
- 3.3. Market Restrains
- 3.4. Market Trends
- 4. Market Factor Analysis
- 4.1. Porters Five Forces
- 4.2. Supply/Value Chain
- 4.3. PESTEL analysis
- 4.4. Market Entropy
- 4.5. Patent/Trademark Analysis
- 5. Global Ultra-Pure Zinc Bromide Analysis, Insights and Forecast, 2019-2031
- 5.1. Market Analysis, Insights and Forecast - by Application
- 5.1.1. Oil & Gas
- 5.1.2. Batteries & Energy Storage
- 5.1.3. Others
- 5.2. Market Analysis, Insights and Forecast - by Types
- 5.2.1. Powder
- 5.2.2. Solution
- 5.3. Market Analysis, Insights and Forecast - by Region
- 5.3.1. North America
- 5.3.2. South America
- 5.3.3. Europe
- 5.3.4. Middle East & Africa
- 5.3.5. Asia Pacific
- 5.1. Market Analysis, Insights and Forecast - by Application
- 6. North America Ultra-Pure Zinc Bromide Analysis, Insights and Forecast, 2019-2031
- 6.1. Market Analysis, Insights and Forecast - by Application
- 6.1.1. Oil & Gas
- 6.1.2. Batteries & Energy Storage
- 6.1.3. Others
- 6.2. Market Analysis, Insights and Forecast - by Types
- 6.2.1. Powder
- 6.2.2. Solution
- 6.1. Market Analysis, Insights and Forecast - by Application
- 7. South America Ultra-Pure Zinc Bromide Analysis, Insights and Forecast, 2019-2031
- 7.1. Market Analysis, Insights and Forecast - by Application
- 7.1.1. Oil & Gas
- 7.1.2. Batteries & Energy Storage
- 7.1.3. Others
- 7.2. Market Analysis, Insights and Forecast - by Types
- 7.2.1. Powder
- 7.2.2. Solution
- 7.1. Market Analysis, Insights and Forecast - by Application
- 8. Europe Ultra-Pure Zinc Bromide Analysis, Insights and Forecast, 2019-2031
- 8.1. Market Analysis, Insights and Forecast - by Application
- 8.1.1. Oil & Gas
- 8.1.2. Batteries & Energy Storage
- 8.1.3. Others
- 8.2. Market Analysis, Insights and Forecast - by Types
- 8.2.1. Powder
- 8.2.2. Solution
- 8.1. Market Analysis, Insights and Forecast - by Application
- 9. Middle East & Africa Ultra-Pure Zinc Bromide Analysis, Insights and Forecast, 2019-2031
- 9.1. Market Analysis, Insights and Forecast - by Application
- 9.1.1. Oil & Gas
- 9.1.2. Batteries & Energy Storage
- 9.1.3. Others
- 9.2. Market Analysis, Insights and Forecast - by Types
- 9.2.1. Powder
- 9.2.2. Solution
- 9.1. Market Analysis, Insights and Forecast - by Application
- 10. Asia Pacific Ultra-Pure Zinc Bromide Analysis, Insights and Forecast, 2019-2031
- 10.1. Market Analysis, Insights and Forecast - by Application
- 10.1.1. Oil & Gas
- 10.1.2. Batteries & Energy Storage
- 10.1.3. Others
- 10.2. Market Analysis, Insights and Forecast - by Types
- 10.2.1. Powder
- 10.2.2. Solution
- 10.1. Market Analysis, Insights and Forecast - by Application
- 11. Competitive Analysis
- 11.1. Global Market Share Analysis 2024
- 11.2. Company Profiles
- 11.2.1 TETRA Technologies
- 11.2.1.1. Overview
- 11.2.1.2. Products
- 11.2.1.3. SWOT Analysis
- 11.2.1.4. Recent Developments
- 11.2.1.5. Financials (Based on Availability)
- 11.2.2 Halliburton
- 11.2.2.1. Overview
- 11.2.2.2. Products
- 11.2.2.3. SWOT Analysis
- 11.2.2.4. Recent Developments
- 11.2.2.5. Financials (Based on Availability)
- 11.2.3 ICL-IP
- 11.2.3.1. Overview
- 11.2.3.2. Products
- 11.2.3.3. SWOT Analysis
- 11.2.3.4. Recent Developments
- 11.2.3.5. Financials (Based on Availability)
- 11.2.4 Schlumberger
- 11.2.4.1. Overview
- 11.2.4.2. Products
- 11.2.4.3. SWOT Analysis
- 11.2.4.4. Recent Developments
- 11.2.4.5. Financials (Based on Availability)
- 11.2.5 Sigma-Aldrich (Merck)
- 11.2.5.1. Overview
- 11.2.5.2. Products
- 11.2.5.3. SWOT Analysis
- 11.2.5.4. Recent Developments
- 11.2.5.5. Financials (Based on Availability)
- 11.2.6 Chemcon Speciality Chemicals Limited
- 11.2.6.1. Overview
- 11.2.6.2. Products
- 11.2.6.3. SWOT Analysis
- 11.2.6.4. Recent Developments
- 11.2.6.5. Financials (Based on Availability)
- 11.2.7 Thermo Scientific Alfa Aesar
- 11.2.7.1. Overview
- 11.2.7.2. Products
- 11.2.7.3. SWOT Analysis
- 11.2.7.4. Recent Developments
- 11.2.7.5. Financials (Based on Availability)
- 11.2.8 Honeywell
- 11.2.8.1. Overview
- 11.2.8.2. Products
- 11.2.8.3. SWOT Analysis
- 11.2.8.4. Recent Developments
- 11.2.8.5. Financials (Based on Availability)
- 11.2.9 TCI Chemical
- 11.2.9.1. Overview
- 11.2.9.2. Products
- 11.2.9.3. SWOT Analysis
- 11.2.9.4. Recent Developments
- 11.2.9.5. Financials (Based on Availability)
- 11.2.10 Shouguang Xinwanshun Chemical
- 11.2.10.1. Overview
- 11.2.10.2. Products
- 11.2.10.3. SWOT Analysis
- 11.2.10.4. Recent Developments
- 11.2.10.5. Financials (Based on Availability)
- 11.2.11 Shandong Weitai Fine Chemical
- 11.2.11.1. Overview
- 11.2.11.2. Products
- 11.2.11.3. SWOT Analysis
- 11.2.11.4. Recent Developments
- 11.2.11.5. Financials (Based on Availability)
- 11.2.12 ChemScene
- 11.2.12.1. Overview
- 11.2.12.2. Products
- 11.2.12.3. SWOT Analysis
- 11.2.12.4. Recent Developments
- 11.2.12.5. Financials (Based on Availability)
- 11.2.13 Wako Pure Chemical Industries (FUJIFILM)
- 11.2.13.1. Overview
- 11.2.13.2. Products
- 11.2.13.3. SWOT Analysis
- 11.2.13.4. Recent Developments
- 11.2.13.5. Financials (Based on Availability)
- 11.2.14 MODY CHEMI PHARMA
- 11.2.14.1. Overview
- 11.2.14.2. Products
- 11.2.14.3. SWOT Analysis
- 11.2.14.4. Recent Developments
- 11.2.14.5. Financials (Based on Availability)
- 11.2.15 Weifang Tianfu Chemical Technology
- 11.2.15.1. Overview
- 11.2.15.2. Products
- 11.2.15.3. SWOT Analysis
- 11.2.15.4. Recent Developments
- 11.2.15.5. Financials (Based on Availability)
- 11.2.16 TRC (LGC Limited)
- 11.2.16.1. Overview
- 11.2.16.2. Products
- 11.2.16.3. SWOT Analysis
- 11.2.16.4. Recent Developments
- 11.2.16.5. Financials (Based on Availability)
- 11.2.17 Shouguang Honghai Chemical
- 11.2.17.1. Overview
- 11.2.17.2. Products
- 11.2.17.3. SWOT Analysis
- 11.2.17.4. Recent Developments
- 11.2.17.5. Financials (Based on Availability)
- 11.2.1 TETRA Technologies
List of Figures
- Figure 1: Global Ultra-Pure Zinc Bromide Revenue Breakdown (million, %) by Region 2024 & 2032
- Figure 2: Global Ultra-Pure Zinc Bromide Volume Breakdown (K, %) by Region 2024 & 2032
- Figure 3: North America Ultra-Pure Zinc Bromide Revenue (million), by Application 2024 & 2032
- Figure 4: North America Ultra-Pure Zinc Bromide Volume (K), by Application 2024 & 2032
- Figure 5: North America Ultra-Pure Zinc Bromide Revenue Share (%), by Application 2024 & 2032
- Figure 6: North America Ultra-Pure Zinc Bromide Volume Share (%), by Application 2024 & 2032
- Figure 7: North America Ultra-Pure Zinc Bromide Revenue (million), by Types 2024 & 2032
- Figure 8: North America Ultra-Pure Zinc Bromide Volume (K), by Types 2024 & 2032
- Figure 9: North America Ultra-Pure Zinc Bromide Revenue Share (%), by Types 2024 & 2032
- Figure 10: North America Ultra-Pure Zinc Bromide Volume Share (%), by Types 2024 & 2032
- Figure 11: North America Ultra-Pure Zinc Bromide Revenue (million), by Country 2024 & 2032
- Figure 12: North America Ultra-Pure Zinc Bromide Volume (K), by Country 2024 & 2032
- Figure 13: North America Ultra-Pure Zinc Bromide Revenue Share (%), by Country 2024 & 2032
- Figure 14: North America Ultra-Pure Zinc Bromide Volume Share (%), by Country 2024 & 2032
- Figure 15: South America Ultra-Pure Zinc Bromide Revenue (million), by Application 2024 & 2032
- Figure 16: South America Ultra-Pure Zinc Bromide Volume (K), by Application 2024 & 2032
- Figure 17: South America Ultra-Pure Zinc Bromide Revenue Share (%), by Application 2024 & 2032
- Figure 18: South America Ultra-Pure Zinc Bromide Volume Share (%), by Application 2024 & 2032
- Figure 19: South America Ultra-Pure Zinc Bromide Revenue (million), by Types 2024 & 2032
- Figure 20: South America Ultra-Pure Zinc Bromide Volume (K), by Types 2024 & 2032
- Figure 21: South America Ultra-Pure Zinc Bromide Revenue Share (%), by Types 2024 & 2032
- Figure 22: South America Ultra-Pure Zinc Bromide Volume Share (%), by Types 2024 & 2032
- Figure 23: South America Ultra-Pure Zinc Bromide Revenue (million), by Country 2024 & 2032
- Figure 24: South America Ultra-Pure Zinc Bromide Volume (K), by Country 2024 & 2032
- Figure 25: South America Ultra-Pure Zinc Bromide Revenue Share (%), by Country 2024 & 2032
- Figure 26: South America Ultra-Pure Zinc Bromide Volume Share (%), by Country 2024 & 2032
- Figure 27: Europe Ultra-Pure Zinc Bromide Revenue (million), by Application 2024 & 2032
- Figure 28: Europe Ultra-Pure Zinc Bromide Volume (K), by Application 2024 & 2032
- Figure 29: Europe Ultra-Pure Zinc Bromide Revenue Share (%), by Application 2024 & 2032
- Figure 30: Europe Ultra-Pure Zinc Bromide Volume Share (%), by Application 2024 & 2032
- Figure 31: Europe Ultra-Pure Zinc Bromide Revenue (million), by Types 2024 & 2032
- Figure 32: Europe Ultra-Pure Zinc Bromide Volume (K), by Types 2024 & 2032
- Figure 33: Europe Ultra-Pure Zinc Bromide Revenue Share (%), by Types 2024 & 2032
- Figure 34: Europe Ultra-Pure Zinc Bromide Volume Share (%), by Types 2024 & 2032
- Figure 35: Europe Ultra-Pure Zinc Bromide Revenue (million), by Country 2024 & 2032
- Figure 36: Europe Ultra-Pure Zinc Bromide Volume (K), by Country 2024 & 2032
- Figure 37: Europe Ultra-Pure Zinc Bromide Revenue Share (%), by Country 2024 & 2032
- Figure 38: Europe Ultra-Pure Zinc Bromide Volume Share (%), by Country 2024 & 2032
- Figure 39: Middle East & Africa Ultra-Pure Zinc Bromide Revenue (million), by Application 2024 & 2032
- Figure 40: Middle East & Africa Ultra-Pure Zinc Bromide Volume (K), by Application 2024 & 2032
- Figure 41: Middle East & Africa Ultra-Pure Zinc Bromide Revenue Share (%), by Application 2024 & 2032
- Figure 42: Middle East & Africa Ultra-Pure Zinc Bromide Volume Share (%), by Application 2024 & 2032
- Figure 43: Middle East & Africa Ultra-Pure Zinc Bromide Revenue (million), by Types 2024 & 2032
- Figure 44: Middle East & Africa Ultra-Pure Zinc Bromide Volume (K), by Types 2024 & 2032
- Figure 45: Middle East & Africa Ultra-Pure Zinc Bromide Revenue Share (%), by Types 2024 & 2032
- Figure 46: Middle East & Africa Ultra-Pure Zinc Bromide Volume Share (%), by Types 2024 & 2032
- Figure 47: Middle East & Africa Ultra-Pure Zinc Bromide Revenue (million), by Country 2024 & 2032
- Figure 48: Middle East & Africa Ultra-Pure Zinc Bromide Volume (K), by Country 2024 & 2032
- Figure 49: Middle East & Africa Ultra-Pure Zinc Bromide Revenue Share (%), by Country 2024 & 2032
- Figure 50: Middle East & Africa Ultra-Pure Zinc Bromide Volume Share (%), by Country 2024 & 2032
- Figure 51: Asia Pacific Ultra-Pure Zinc Bromide Revenue (million), by Application 2024 & 2032
- Figure 52: Asia Pacific Ultra-Pure Zinc Bromide Volume (K), by Application 2024 & 2032
- Figure 53: Asia Pacific Ultra-Pure Zinc Bromide Revenue Share (%), by Application 2024 & 2032
- Figure 54: Asia Pacific Ultra-Pure Zinc Bromide Volume Share (%), by Application 2024 & 2032
- Figure 55: Asia Pacific Ultra-Pure Zinc Bromide Revenue (million), by Types 2024 & 2032
- Figure 56: Asia Pacific Ultra-Pure Zinc Bromide Volume (K), by Types 2024 & 2032
- Figure 57: Asia Pacific Ultra-Pure Zinc Bromide Revenue Share (%), by Types 2024 & 2032
- Figure 58: Asia Pacific Ultra-Pure Zinc Bromide Volume Share (%), by Types 2024 & 2032
- Figure 59: Asia Pacific Ultra-Pure Zinc Bromide Revenue (million), by Country 2024 & 2032
- Figure 60: Asia Pacific Ultra-Pure Zinc Bromide Volume (K), by Country 2024 & 2032
- Figure 61: Asia Pacific Ultra-Pure Zinc Bromide Revenue Share (%), by Country 2024 & 2032
- Figure 62: Asia Pacific Ultra-Pure Zinc Bromide Volume Share (%), by Country 2024 & 2032
List of Tables
- Table 1: Global Ultra-Pure Zinc Bromide Revenue million Forecast, by Region 2019 & 2032
- Table 2: Global Ultra-Pure Zinc Bromide Volume K Forecast, by Region 2019 & 2032
- Table 3: Global Ultra-Pure Zinc Bromide Revenue million Forecast, by Application 2019 & 2032
- Table 4: Global Ultra-Pure Zinc Bromide Volume K Forecast, by Application 2019 & 2032
- Table 5: Global Ultra-Pure Zinc Bromide Revenue million Forecast, by Types 2019 & 2032
- Table 6: Global Ultra-Pure Zinc Bromide Volume K Forecast, by Types 2019 & 2032
- Table 7: Global Ultra-Pure Zinc Bromide Revenue million Forecast, by Region 2019 & 2032
- Table 8: Global Ultra-Pure Zinc Bromide Volume K Forecast, by Region 2019 & 2032
- Table 9: Global Ultra-Pure Zinc Bromide Revenue million Forecast, by Application 2019 & 2032
- Table 10: Global Ultra-Pure Zinc Bromide Volume K Forecast, by Application 2019 & 2032
- Table 11: Global Ultra-Pure Zinc Bromide Revenue million Forecast, by Types 2019 & 2032
- Table 12: Global Ultra-Pure Zinc Bromide Volume K Forecast, by Types 2019 & 2032
- Table 13: Global Ultra-Pure Zinc Bromide Revenue million Forecast, by Country 2019 & 2032
- Table 14: Global Ultra-Pure Zinc Bromide Volume K Forecast, by Country 2019 & 2032
- Table 15: United States Ultra-Pure Zinc Bromide Revenue (million) Forecast, by Application 2019 & 2032
- Table 16: United States Ultra-Pure Zinc Bromide Volume (K) Forecast, by Application 2019 & 2032
- Table 17: Canada Ultra-Pure Zinc Bromide Revenue (million) Forecast, by Application 2019 & 2032
- Table 18: Canada Ultra-Pure Zinc Bromide Volume (K) Forecast, by Application 2019 & 2032
- Table 19: Mexico Ultra-Pure Zinc Bromide Revenue (million) Forecast, by Application 2019 & 2032
- Table 20: Mexico Ultra-Pure Zinc Bromide Volume (K) Forecast, by Application 2019 & 2032
- Table 21: Global Ultra-Pure Zinc Bromide Revenue million Forecast, by Application 2019 & 2032
- Table 22: Global Ultra-Pure Zinc Bromide Volume K Forecast, by Application 2019 & 2032
- Table 23: Global Ultra-Pure Zinc Bromide Revenue million Forecast, by Types 2019 & 2032
- Table 24: Global Ultra-Pure Zinc Bromide Volume K Forecast, by Types 2019 & 2032
- Table 25: Global Ultra-Pure Zinc Bromide Revenue million Forecast, by Country 2019 & 2032
- Table 26: Global Ultra-Pure Zinc Bromide Volume K Forecast, by Country 2019 & 2032
- Table 27: Brazil Ultra-Pure Zinc Bromide Revenue (million) Forecast, by Application 2019 & 2032
- Table 28: Brazil Ultra-Pure Zinc Bromide Volume (K) Forecast, by Application 2019 & 2032
- Table 29: Argentina Ultra-Pure Zinc Bromide Revenue (million) Forecast, by Application 2019 & 2032
- Table 30: Argentina Ultra-Pure Zinc Bromide Volume (K) Forecast, by Application 2019 & 2032
- Table 31: Rest of South America Ultra-Pure Zinc Bromide Revenue (million) Forecast, by Application 2019 & 2032
- Table 32: Rest of South America Ultra-Pure Zinc Bromide Volume (K) Forecast, by Application 2019 & 2032
- Table 33: Global Ultra-Pure Zinc Bromide Revenue million Forecast, by Application 2019 & 2032
- Table 34: Global Ultra-Pure Zinc Bromide Volume K Forecast, by Application 2019 & 2032
- Table 35: Global Ultra-Pure Zinc Bromide Revenue million Forecast, by Types 2019 & 2032
- Table 36: Global Ultra-Pure Zinc Bromide Volume K Forecast, by Types 2019 & 2032
- Table 37: Global Ultra-Pure Zinc Bromide Revenue million Forecast, by Country 2019 & 2032
- Table 38: Global Ultra-Pure Zinc Bromide Volume K Forecast, by Country 2019 & 2032
- Table 39: United Kingdom Ultra-Pure Zinc Bromide Revenue (million) Forecast, by Application 2019 & 2032
- Table 40: United Kingdom Ultra-Pure Zinc Bromide Volume (K) Forecast, by Application 2019 & 2032
- Table 41: Germany Ultra-Pure Zinc Bromide Revenue (million) Forecast, by Application 2019 & 2032
- Table 42: Germany Ultra-Pure Zinc Bromide Volume (K) Forecast, by Application 2019 & 2032
- Table 43: France Ultra-Pure Zinc Bromide Revenue (million) Forecast, by Application 2019 & 2032
- Table 44: France Ultra-Pure Zinc Bromide Volume (K) Forecast, by Application 2019 & 2032
- Table 45: Italy Ultra-Pure Zinc Bromide Revenue (million) Forecast, by Application 2019 & 2032
- Table 46: Italy Ultra-Pure Zinc Bromide Volume (K) Forecast, by Application 2019 & 2032
- Table 47: Spain Ultra-Pure Zinc Bromide Revenue (million) Forecast, by Application 2019 & 2032
- Table 48: Spain Ultra-Pure Zinc Bromide Volume (K) Forecast, by Application 2019 & 2032
- Table 49: Russia Ultra-Pure Zinc Bromide Revenue (million) Forecast, by Application 2019 & 2032
- Table 50: Russia Ultra-Pure Zinc Bromide Volume (K) Forecast, by Application 2019 & 2032
- Table 51: Benelux Ultra-Pure Zinc Bromide Revenue (million) Forecast, by Application 2019 & 2032
- Table 52: Benelux Ultra-Pure Zinc Bromide Volume (K) Forecast, by Application 2019 & 2032
- Table 53: Nordics Ultra-Pure Zinc Bromide Revenue (million) Forecast, by Application 2019 & 2032
- Table 54: Nordics Ultra-Pure Zinc Bromide Volume (K) Forecast, by Application 2019 & 2032
- Table 55: Rest of Europe Ultra-Pure Zinc Bromide Revenue (million) Forecast, by Application 2019 & 2032
- Table 56: Rest of Europe Ultra-Pure Zinc Bromide Volume (K) Forecast, by Application 2019 & 2032
- Table 57: Global Ultra-Pure Zinc Bromide Revenue million Forecast, by Application 2019 & 2032
- Table 58: Global Ultra-Pure Zinc Bromide Volume K Forecast, by Application 2019 & 2032
- Table 59: Global Ultra-Pure Zinc Bromide Revenue million Forecast, by Types 2019 & 2032
- Table 60: Global Ultra-Pure Zinc Bromide Volume K Forecast, by Types 2019 & 2032
- Table 61: Global Ultra-Pure Zinc Bromide Revenue million Forecast, by Country 2019 & 2032
- Table 62: Global Ultra-Pure Zinc Bromide Volume K Forecast, by Country 2019 & 2032
- Table 63: Turkey Ultra-Pure Zinc Bromide Revenue (million) Forecast, by Application 2019 & 2032
- Table 64: Turkey Ultra-Pure Zinc Bromide Volume (K) Forecast, by Application 2019 & 2032
- Table 65: Israel Ultra-Pure Zinc Bromide Revenue (million) Forecast, by Application 2019 & 2032
- Table 66: Israel Ultra-Pure Zinc Bromide Volume (K) Forecast, by Application 2019 & 2032
- Table 67: GCC Ultra-Pure Zinc Bromide Revenue (million) Forecast, by Application 2019 & 2032
- Table 68: GCC Ultra-Pure Zinc Bromide Volume (K) Forecast, by Application 2019 & 2032
- Table 69: North Africa Ultra-Pure Zinc Bromide Revenue (million) Forecast, by Application 2019 & 2032
- Table 70: North Africa Ultra-Pure Zinc Bromide Volume (K) Forecast, by Application 2019 & 2032
- Table 71: South Africa Ultra-Pure Zinc Bromide Revenue (million) Forecast, by Application 2019 & 2032
- Table 72: South Africa Ultra-Pure Zinc Bromide Volume (K) Forecast, by Application 2019 & 2032
- Table 73: Rest of Middle East & Africa Ultra-Pure Zinc Bromide Revenue (million) Forecast, by Application 2019 & 2032
- Table 74: Rest of Middle East & Africa Ultra-Pure Zinc Bromide Volume (K) Forecast, by Application 2019 & 2032
- Table 75: Global Ultra-Pure Zinc Bromide Revenue million Forecast, by Application 2019 & 2032
- Table 76: Global Ultra-Pure Zinc Bromide Volume K Forecast, by Application 2019 & 2032
- Table 77: Global Ultra-Pure Zinc Bromide Revenue million Forecast, by Types 2019 & 2032
- Table 78: Global Ultra-Pure Zinc Bromide Volume K Forecast, by Types 2019 & 2032
- Table 79: Global Ultra-Pure Zinc Bromide Revenue million Forecast, by Country 2019 & 2032
- Table 80: Global Ultra-Pure Zinc Bromide Volume K Forecast, by Country 2019 & 2032
- Table 81: China Ultra-Pure Zinc Bromide Revenue (million) Forecast, by Application 2019 & 2032
- Table 82: China Ultra-Pure Zinc Bromide Volume (K) Forecast, by Application 2019 & 2032
- Table 83: India Ultra-Pure Zinc Bromide Revenue (million) Forecast, by Application 2019 & 2032
- Table 84: India Ultra-Pure Zinc Bromide Volume (K) Forecast, by Application 2019 & 2032
- Table 85: Japan Ultra-Pure Zinc Bromide Revenue (million) Forecast, by Application 2019 & 2032
- Table 86: Japan Ultra-Pure Zinc Bromide Volume (K) Forecast, by Application 2019 & 2032
- Table 87: South Korea Ultra-Pure Zinc Bromide Revenue (million) Forecast, by Application 2019 & 2032
- Table 88: South Korea Ultra-Pure Zinc Bromide Volume (K) Forecast, by Application 2019 & 2032
- Table 89: ASEAN Ultra-Pure Zinc Bromide Revenue (million) Forecast, by Application 2019 & 2032
- Table 90: ASEAN Ultra-Pure Zinc Bromide Volume (K) Forecast, by Application 2019 & 2032
- Table 91: Oceania Ultra-Pure Zinc Bromide Revenue (million) Forecast, by Application 2019 & 2032
- Table 92: Oceania Ultra-Pure Zinc Bromide Volume (K) Forecast, by Application 2019 & 2032
- Table 93: Rest of Asia Pacific Ultra-Pure Zinc Bromide Revenue (million) Forecast, by Application 2019 & 2032
- Table 94: Rest of Asia Pacific Ultra-Pure Zinc Bromide Volume (K) Forecast, by Application 2019 & 2032
Frequently Asked Questions
1. What is the projected Compound Annual Growth Rate (CAGR) of the Ultra-Pure Zinc Bromide?
The projected CAGR is approximately 13.9%.
2. Which companies are prominent players in the Ultra-Pure Zinc Bromide?
Key companies in the market include TETRA Technologies, Halliburton, ICL-IP, Schlumberger, Sigma-Aldrich (Merck), Chemcon Speciality Chemicals Limited, Thermo Scientific Alfa Aesar, Honeywell, TCI Chemical, Shouguang Xinwanshun Chemical, Shandong Weitai Fine Chemical, ChemScene, Wako Pure Chemical Industries (FUJIFILM), MODY CHEMI PHARMA, Weifang Tianfu Chemical Technology, TRC (LGC Limited), Shouguang Honghai Chemical.
3. What are the main segments of the Ultra-Pure Zinc Bromide?
The market segments include Application, Types.
4. Can you provide details about the market size?
The market size is estimated to be USD 106 million as of 2022.
5. What are some drivers contributing to market growth?
N/A
6. What are the notable trends driving market growth?
N/A
7. Are there any restraints impacting market growth?
N/A
8. Can you provide examples of recent developments in the market?
N/A
9. What pricing options are available for accessing the report?
Pricing options include single-user, multi-user, and enterprise licenses priced at USD 4350.00, USD 6525.00, and USD 8700.00 respectively.
10. Is the market size provided in terms of value or volume?
The market size is provided in terms of value, measured in million and volume, measured in K.
11. Are there any specific market keywords associated with the report?
Yes, the market keyword associated with the report is "Ultra-Pure Zinc Bromide," which aids in identifying and referencing the specific market segment covered.
12. How do I determine which pricing option suits my needs best?
The pricing options vary based on user requirements and access needs. Individual users may opt for single-user licenses, while businesses requiring broader access may choose multi-user or enterprise licenses for cost-effective access to the report.
13. Are there any additional resources or data provided in the Ultra-Pure Zinc Bromide report?
While the report offers comprehensive insights, it's advisable to review the specific contents or supplementary materials provided to ascertain if additional resources or data are available.
14. How can I stay updated on further developments or reports in the Ultra-Pure Zinc Bromide?
To stay informed about further developments, trends, and reports in the Ultra-Pure Zinc Bromide, consider subscribing to industry newsletters, following relevant companies and organizations, or regularly checking reputable industry news sources and publications.
Methodology
Step 1 - Identification of Relevant Samples Size from Population Database


Step 2 - Approaches for Defining Global Market Size (Value, Volume* & Price*)

Note*: In applicable scenarios
Step 3 - Data Sources
Primary Research
- Web Analytics
- Survey Reports
- Research Institute
- Latest Research Reports
- Opinion Leaders
Secondary Research
- Annual Reports
- White Paper
- Latest Press Release
- Industry Association
- Paid Database
- Investor Presentations

Step 4 - Data Triangulation
Involves using different sources of information in order to increase the validity of a study
These sources are likely to be stakeholders in a program - participants, other researchers, program staff, other community members, and so on.
Then we put all data in single framework & apply various statistical tools to find out the dynamic on the market.
During the analysis stage, feedback from the stakeholder groups would be compared to determine areas of agreement as well as areas of divergence


