

Key Insights
The UAE silica sand market, valued at approximately $150 million in 2025, is experiencing robust growth, projected to maintain a CAGR exceeding 5% from 2025 to 2033. This expansion is fueled by the nation's booming construction sector, particularly large-scale infrastructure projects and the ongoing real estate development. The increasing demand for glass manufacturing, paints and coatings, and the chemical production industries further contributes to the market's dynamism. Furthermore, the UAE's strategic location and its role as a regional hub for trade and industry facilitate the import and export of silica sand, boosting market activity. However, environmental regulations concerning sand mining and potential fluctuations in global commodity prices pose challenges to sustained growth. The competitive landscape includes both domestic and international players, with companies like Mitsubishi Corporation and Rawasy Group holding significant market shares. The market is segmented by end-user industry, with construction, glass manufacturing, and chemical production representing the largest consumers. Future growth will likely be influenced by government policies promoting sustainable construction practices and technological advancements in silica sand processing and application.
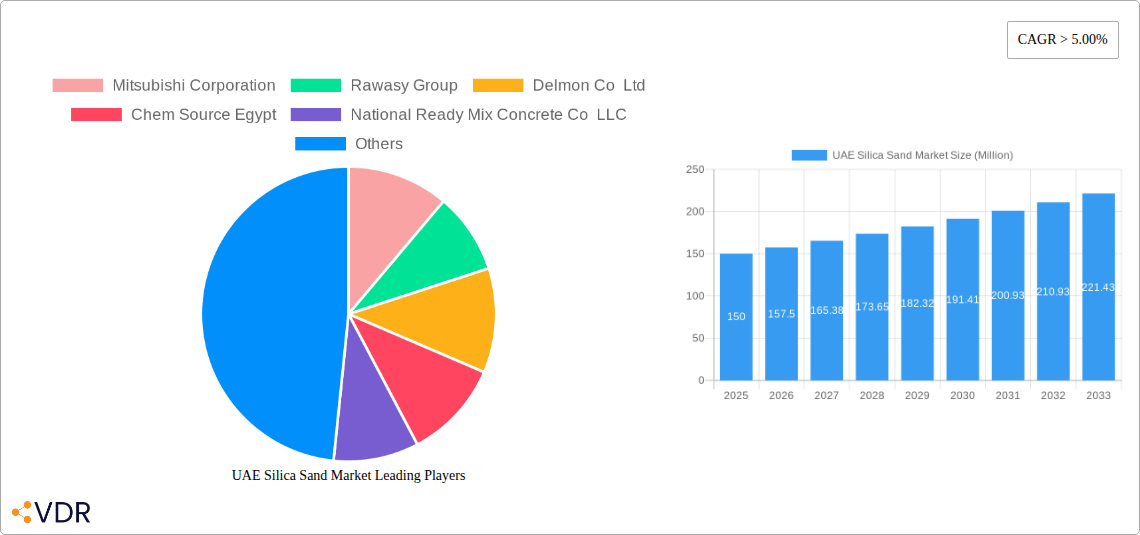
UAE Silica Sand Market Market Size (In Million)
The forecast period (2025-2033) anticipates continued growth driven by the UAE's ambitious infrastructure plans and sustained demand from diverse end-use sectors. Diversification of end-user applications, such as in the filtration and oil & gas industries, presents opportunities for market expansion. Companies are expected to focus on strategic partnerships, technological innovation, and sustainable sourcing practices to gain a competitive edge. The government’s commitment to infrastructure projects will likely play a key role in influencing demand and shaping market dynamics. Addressing environmental concerns related to sand mining through responsible sourcing and recycling will also be crucial for sustainable growth of the UAE silica sand market in the long term.
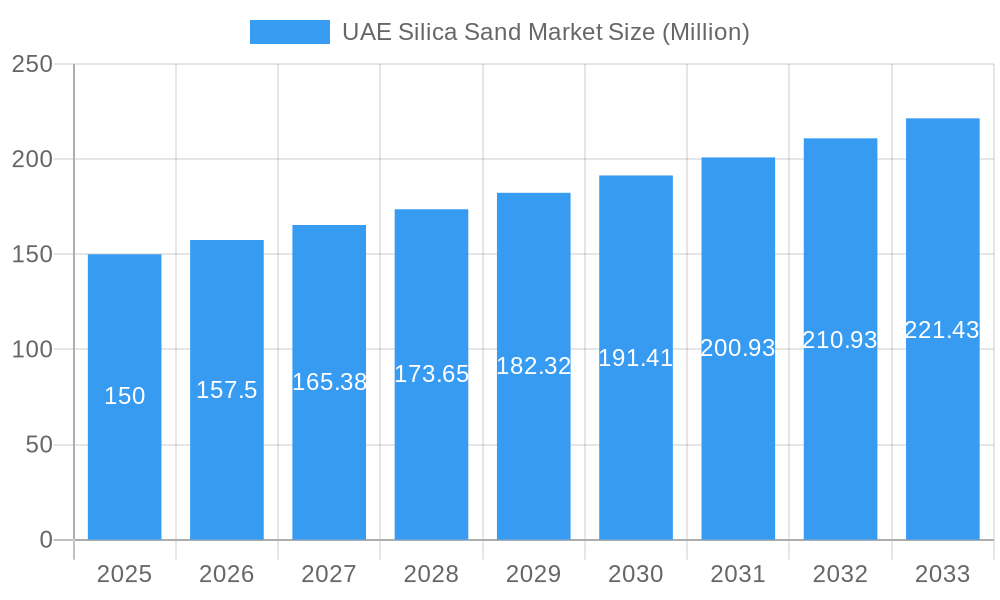
UAE Silica Sand Market Company Market Share
UAE Silica Sand Market: A Comprehensive Report (2019-2033)
This in-depth report provides a comprehensive analysis of the UAE silica sand market, offering valuable insights for industry professionals, investors, and strategic decision-makers. The report covers market dynamics, growth trends, key players, and future projections, leveraging data from the study period of 2019-2024, with a base year of 2025 and a forecast period spanning 2025-2033. The market is segmented by end-user industry, providing a granular understanding of the diverse applications of silica sand within the UAE.
UAE Silica Sand Market Market Dynamics & Structure
The UAE silica sand market is characterized by a moderately concentrated structure, with a few prominent players such as Mitsubishi Corporation, Rawasy Group, and Delmon Co Ltd holding significant market influence. A primary driver of growth is technological innovation, with a keen focus on enhancing the purity and consistency of silica sand to meet increasingly demanding industrial standards. The market operates within a framework of stringent environmental regulations pertaining to sand mining and processing, which influence operational practices and investment in sustainable technologies. While synthetic silica presents a competitive substitute, its higher cost limits its widespread adoption, thereby offering a degree of protection to the natural silica sand market. The expanding construction and manufacturing sectors are the foundational pillars fueling the demand for silica sand. Mergers and acquisitions (M&A) activity has been observed to be relatively subdued, with approximately XX deals recorded between 2019 and 2024, indicating a stable competitive landscape.
- Market Concentration: Moderately concentrated, with the top 5 players collectively accounting for approximately XX% of the market share. This suggests a landscape where established entities command a significant portion of the market.
- Technological Innovation: The emphasis is on improving the purity of silica sand and achieving precise particle size distribution. However, innovation is tempered by the considerable capital expenditure required for advanced processing technologies and research and development.
- Regulatory Framework: A robust and stringent regulatory environment governs all aspects of sand mining, including extraction methods, processing, and waste disposal, necessitating adherence to environmental protection standards.
- Competitive Substitutes: Synthetic silica presents a competitive alternative, but its higher production cost renders it a limited threat in most applications, making natural silica sand the preferred choice for a majority of users.
- End-User Demographics: Demand is primarily driven by large-scale infrastructure development projects and a burgeoning industrial growth trajectory across various sectors within the UAE.
- M&A Trends: The market has witnessed low merger and acquisition activity, with only XX deals recorded between 2019 and 2024. This indicates a stable and mature market structure with established players.
UAE Silica Sand Market Growth Trends & Insights
The UAE silica sand market has witnessed robust growth throughout the historical period (2019-2024), fueled by the nation's ambitious infrastructure development plans and the booming construction sector. The market size, valued at xx million units in 2024, is projected to reach xx million units by 2033, registering a CAGR of xx% during the forecast period (2025-2033). Increased adoption of silica sand in various end-user industries, coupled with technological advancements in processing techniques, contributes to this growth. Consumer behavior shifts towards sustainable and high-quality construction materials also play a crucial role. Market penetration is expected to increase from xx% in 2024 to xx% in 2033, indicating further growth potential.
Dominant Regions, Countries, or Segments in UAE Silica Sand Market
The construction sector unequivocally dominates the UAE silica sand market, responsible for approximately XX% of the total consumption. This overwhelming dominance is directly attributable to the region's consistent and substantial volume of construction projects, encompassing residential complexes, commercial establishments, and large-scale infrastructure development. Beyond construction, glass manufacturing emerges as another significant segment, capitalizing on the UAE's expanding glass industry. Furthermore, the chemical production sector relies heavily on silica sand as an indispensable raw material for a myriad of chemical processes and products.
-
Key Drivers:
- Construction Sector: The robust and ongoing expansion of infrastructure and a high volume of residential construction projects are the primary engines of demand.
- Government Initiatives: A strong governmental focus on promoting sustainable urban development and infrastructure modernization plays a crucial role in stimulating market growth.
- Economic Growth: The UAE's consistent and strong economic growth underpins industrial expansion and robust consumer spending, thereby bolstering the demand for silica sand across various applications.
-
Dominance Factors:
- Construction's High Consumption Volume: The sheer scale of concrete and mortar used in building and infrastructure projects creates an insatiable demand for silica sand.
- Geographic Proximity: The strategic location and availability of high-quality silica sand deposits within specific regions of the UAE contribute to cost efficiencies in extraction and transportation.
- Government Support: Favorable government policies that encourage domestic production and support the development of key industries directly contribute to the dominance of local silica sand.
UAE Silica Sand Market Product Landscape
The UAE silica sand market offers a diverse array of products meticulously tailored to meet the specific requirements of various end-user industries. This product spectrum is defined by varying particle sizes, shapes, and purity levels. The industry's innovation efforts are largely directed towards refining these characteristics, aiming to achieve enhanced particle size uniformity and higher purity levels. These advancements are crucial for elevating the performance and quality of the final products manufactured by downstream industries. The key differentiators and unique selling propositions in this market commonly revolve around ensuring consistent product quality, guaranteeing a reliable supply chain, and maintaining competitive pricing strategies.
Key Drivers, Barriers & Challenges in UAE Silica Sand Market
Key Drivers: The UAE's robust infrastructure development plans, diversification of the economy, and supportive government policies are key drivers. Technological advancements in silica sand processing techniques that improve purity and efficiency also contribute.
Challenges: Fluctuations in global commodity prices, environmental regulations around sand mining, and intense competition from international suppliers pose significant challenges. Supply chain disruptions due to global events can also impact market stability.
Emerging Opportunities in UAE Silica Sand Market
Emerging opportunities lie in exploring untapped markets like specialized glass manufacturing and high-purity silica applications for electronics. Innovations focusing on sustainability, such as utilizing recycled silica sand, also present growth potential. Expanding into new applications within the oil and gas, and water filtration industries represent additional opportunities.
Growth Accelerators in the UAE Silica Sand Market Industry
Strategic partnerships forged between silica sand producers and their key end-user industries are pivotal in accelerating market growth. These collaborations facilitate a more streamlined supply chain, ensure consistent product quality that aligns with specific industrial needs, and foster innovation. Furthermore, technological advancements in extraction and processing methodologies, particularly those that enhance operational efficiency, reduce environmental impact, and improve product quality, represent significant growth catalysts. Investments in research and development for more sustainable and efficient mining and processing techniques are crucial for future expansion.
Key Players Shaping the UAE Silica Sand Market Market
- Mitsubishi Corporation
- Rawasy Group
- Delmon Co Ltd
- Chem Source Egypt
- National Ready Mix Concrete Co LLC
- Adwan Chemical Industries Co Ltd
- Cairo Minerals
- Speciality Industries LLC
- Gulf Minerals
- Majd Al Muayad
Notable Milestones in UAE Silica Sand Market Sector
- 2021: Introduction of stricter environmental regulations for sand mining.
- 2022: Launch of a new high-purity silica sand processing plant by Delmon Co Ltd.
- 2023: A significant investment in silica sand processing technologies by Rawasy Group.
In-Depth UAE Silica Sand Market Market Outlook
The UAE silica sand market is strategically positioned for sustained and robust growth in the foreseeable future. This optimistic outlook is underpinned by a confluence of factors, including ongoing and planned infrastructure development projects, continuous technological advancements aimed at enhancing product quality and sustainability, and targeted strategic investments in the sector. The increasing emphasis on sustainability and the demand for high-quality, precisely engineered silica sand products will undoubtedly shape the future dynamics of the market. Significant opportunities lie in the exploration of novel applications for silica sand and the formation of strategic alliances that can leverage synergistic benefits, thereby unlocking new avenues for growth and market penetration.
UAE Silica Sand Market Segmentation
-
1. End-user Industry
- 1.1. Glass Manufacturing
- 1.2. Foundry
- 1.3. Chemical Production
- 1.4. Construction
- 1.5. Paints and Coatings
- 1.6. Ceramics and Refractories
- 1.7. Filtration
- 1.8. Oil and Gas
- 1.9. Other End-user Industries
UAE Silica Sand Market Segmentation By Geography
-
1. North America
- 1.1. United States
- 1.2. Canada
- 1.3. Mexico
-
2. South America
- 2.1. Brazil
- 2.2. Argentina
- 2.3. Rest of South America
-
3. Europe
- 3.1. United Kingdom
- 3.2. Germany
- 3.3. France
- 3.4. Italy
- 3.5. Spain
- 3.6. Russia
- 3.7. Benelux
- 3.8. Nordics
- 3.9. Rest of Europe
-
4. Middle East & Africa
- 4.1. Turkey
- 4.2. Israel
- 4.3. GCC
- 4.4. North Africa
- 4.5. South Africa
- 4.6. Rest of Middle East & Africa
-
5. Asia Pacific
- 5.1. China
- 5.2. India
- 5.3. Japan
- 5.4. South Korea
- 5.5. ASEAN
- 5.6. Oceania
- 5.7. Rest of Asia Pacific
UAE Silica Sand Market Regional Market Share
Geographic Coverage of UAE Silica Sand Market
UAE Silica Sand Market REPORT HIGHLIGHTS
| Aspects | Details |
|---|---|
| Study Period | 2020-2034 |
| Base Year | 2025 |
| Estimated Year | 2026 |
| Forecast Period | 2026-2034 |
| Historical Period | 2020-2025 |
| Growth Rate | CAGR of 7.7% from 2020-2034 |
| Segmentation |
|
Table of Contents
- 1. Introduction
- 1.1. Research Scope
- 1.2. Market Segmentation
- 1.3. Research Objective
- 1.4. Definitions and Assumptions
- 2. Executive Summary
- 2.1. Market Snapshot
- 3. Market Dynamics
- 3.1. Market Drivers
- 3.2. Market Restrains
- 3.3. Market Trends
- 3.4. Market Opportunities
- 4. Market Factor Analysis
- 4.1. Porters Five Forces
- 4.1.1. Bargaining Power of Suppliers
- 4.1.2. Bargaining Power of Buyers
- 4.1.3. Threat of New Entrants
- 4.1.4. Threat of Substitutes
- 4.1.5. Competitive Rivalry
- 4.2. PESTEL analysis
- 4.3. BCG Analysis
- 4.3.1. Stars (High Growth, High Market Share)
- 4.3.2. Cash Cows (Low Growth, High Market Share)
- 4.3.3. Question Mark (High Growth, Low Market Share)
- 4.3.4. Dogs (Low Growth, Low Market Share)
- 4.4. Ansoff Matrix Analysis
- 4.5. Supply Chain Analysis
- 4.6. Regulatory Landscape
- 4.7. Current Market Potential and Opportunity Assessment (TAM–SAM–SOM Framework)
- 4.8. VDR Analyst Note
- 4.1. Porters Five Forces
- 5. Market Analysis, Insights and Forecast 2021-2033
- 5.1. Market Analysis, Insights and Forecast - by End-user Industry
- 5.1.1. Glass Manufacturing
- 5.1.2. Foundry
- 5.1.3. Chemical Production
- 5.1.4. Construction
- 5.1.5. Paints and Coatings
- 5.1.6. Ceramics and Refractories
- 5.1.7. Filtration
- 5.1.8. Oil and Gas
- 5.1.9. Other End-user Industries
- 5.2. Market Analysis, Insights and Forecast - by Region
- 5.2.1. North America
- 5.2.2. South America
- 5.2.3. Europe
- 5.2.4. Middle East & Africa
- 5.2.5. Asia Pacific
- 5.1. Market Analysis, Insights and Forecast - by End-user Industry
- 6. Global UAE Silica Sand Market Analysis, Insights and Forecast, 2021-2033
- 6.1. Market Analysis, Insights and Forecast - by End-user Industry
- 6.1.1. Glass Manufacturing
- 6.1.2. Foundry
- 6.1.3. Chemical Production
- 6.1.4. Construction
- 6.1.5. Paints and Coatings
- 6.1.6. Ceramics and Refractories
- 6.1.7. Filtration
- 6.1.8. Oil and Gas
- 6.1.9. Other End-user Industries
- 6.1. Market Analysis, Insights and Forecast - by End-user Industry
- 7. North America UAE Silica Sand Market Analysis, Insights and Forecast, 2021-2033
- 7.1. Market Analysis, Insights and Forecast - by End-user Industry
- 7.1.1. Glass Manufacturing
- 7.1.2. Foundry
- 7.1.3. Chemical Production
- 7.1.4. Construction
- 7.1.5. Paints and Coatings
- 7.1.6. Ceramics and Refractories
- 7.1.7. Filtration
- 7.1.8. Oil and Gas
- 7.1.9. Other End-user Industries
- 7.1. Market Analysis, Insights and Forecast - by End-user Industry
- 8. South America UAE Silica Sand Market Analysis, Insights and Forecast, 2021-2033
- 8.1. Market Analysis, Insights and Forecast - by End-user Industry
- 8.1.1. Glass Manufacturing
- 8.1.2. Foundry
- 8.1.3. Chemical Production
- 8.1.4. Construction
- 8.1.5. Paints and Coatings
- 8.1.6. Ceramics and Refractories
- 8.1.7. Filtration
- 8.1.8. Oil and Gas
- 8.1.9. Other End-user Industries
- 8.1. Market Analysis, Insights and Forecast - by End-user Industry
- 9. Europe UAE Silica Sand Market Analysis, Insights and Forecast, 2021-2033
- 9.1. Market Analysis, Insights and Forecast - by End-user Industry
- 9.1.1. Glass Manufacturing
- 9.1.2. Foundry
- 9.1.3. Chemical Production
- 9.1.4. Construction
- 9.1.5. Paints and Coatings
- 9.1.6. Ceramics and Refractories
- 9.1.7. Filtration
- 9.1.8. Oil and Gas
- 9.1.9. Other End-user Industries
- 9.1. Market Analysis, Insights and Forecast - by End-user Industry
- 10. Middle East & Africa UAE Silica Sand Market Analysis, Insights and Forecast, 2021-2033
- 10.1. Market Analysis, Insights and Forecast - by End-user Industry
- 10.1.1. Glass Manufacturing
- 10.1.2. Foundry
- 10.1.3. Chemical Production
- 10.1.4. Construction
- 10.1.5. Paints and Coatings
- 10.1.6. Ceramics and Refractories
- 10.1.7. Filtration
- 10.1.8. Oil and Gas
- 10.1.9. Other End-user Industries
- 10.1. Market Analysis, Insights and Forecast - by End-user Industry
- 11. Asia Pacific UAE Silica Sand Market Analysis, Insights and Forecast, 2021-2033
- 11.1. Market Analysis, Insights and Forecast - by End-user Industry
- 11.1.1. Glass Manufacturing
- 11.1.2. Foundry
- 11.1.3. Chemical Production
- 11.1.4. Construction
- 11.1.5. Paints and Coatings
- 11.1.6. Ceramics and Refractories
- 11.1.7. Filtration
- 11.1.8. Oil and Gas
- 11.1.9. Other End-user Industries
- 11.1. Market Analysis, Insights and Forecast - by End-user Industry
- 12. Competitive Analysis
- 12.1. Company Profiles
- 12.1.1 Mitsubishi Corporation
- 12.1.1.1. Company Overview
- 12.1.1.2. Products
- 12.1.1.3. Company Financials
- 12.1.1.4. SWOT Analysis
- 12.1.2 Rawasy Group
- 12.1.2.1. Company Overview
- 12.1.2.2. Products
- 12.1.2.3. Company Financials
- 12.1.2.4. SWOT Analysis
- 12.1.3 Delmon Co Ltd
- 12.1.3.1. Company Overview
- 12.1.3.2. Products
- 12.1.3.3. Company Financials
- 12.1.3.4. SWOT Analysis
- 12.1.4 Chem Source Egypt
- 12.1.4.1. Company Overview
- 12.1.4.2. Products
- 12.1.4.3. Company Financials
- 12.1.4.4. SWOT Analysis
- 12.1.5 National Ready Mix Concrete Co LLC
- 12.1.5.1. Company Overview
- 12.1.5.2. Products
- 12.1.5.3. Company Financials
- 12.1.5.4. SWOT Analysis
- 12.1.6 Adwan Chemical Industries Co Ltd
- 12.1.6.1. Company Overview
- 12.1.6.2. Products
- 12.1.6.3. Company Financials
- 12.1.6.4. SWOT Analysis
- 12.1.7 Cairo Minerals
- 12.1.7.1. Company Overview
- 12.1.7.2. Products
- 12.1.7.3. Company Financials
- 12.1.7.4. SWOT Analysis
- 12.1.8 Speciality Industries LLC*List Not Exhaustive
- 12.1.8.1. Company Overview
- 12.1.8.2. Products
- 12.1.8.3. Company Financials
- 12.1.8.4. SWOT Analysis
- 12.1.9 Gulf Minerals
- 12.1.9.1. Company Overview
- 12.1.9.2. Products
- 12.1.9.3. Company Financials
- 12.1.9.4. SWOT Analysis
- 12.1.10 Majd Al Muayad
- 12.1.10.1. Company Overview
- 12.1.10.2. Products
- 12.1.10.3. Company Financials
- 12.1.10.4. SWOT Analysis
- 12.1.1 Mitsubishi Corporation
- 12.2. Market Entropy
- 12.2.1 Company's Key Areas Served
- 12.2.2 Recent Developments
- 12.3. Company Market Share Analysis 2025
- 12.3.1 Top 5 Companies Market Share Analysis
- 12.3.2 Top 3 Companies Market Share Analysis
- 12.4. List of Potential Customers
- 13. Research Methodology
List of Figures
- Figure 1: Global UAE Silica Sand Market Revenue Breakdown (billion, %) by Region 2025 & 2033
- Figure 2: North America UAE Silica Sand Market Revenue (billion), by End-user Industry 2025 & 2033
- Figure 3: North America UAE Silica Sand Market Revenue Share (%), by End-user Industry 2025 & 2033
- Figure 4: North America UAE Silica Sand Market Revenue (billion), by Country 2025 & 2033
- Figure 5: North America UAE Silica Sand Market Revenue Share (%), by Country 2025 & 2033
- Figure 6: South America UAE Silica Sand Market Revenue (billion), by End-user Industry 2025 & 2033
- Figure 7: South America UAE Silica Sand Market Revenue Share (%), by End-user Industry 2025 & 2033
- Figure 8: South America UAE Silica Sand Market Revenue (billion), by Country 2025 & 2033
- Figure 9: South America UAE Silica Sand Market Revenue Share (%), by Country 2025 & 2033
- Figure 10: Europe UAE Silica Sand Market Revenue (billion), by End-user Industry 2025 & 2033
- Figure 11: Europe UAE Silica Sand Market Revenue Share (%), by End-user Industry 2025 & 2033
- Figure 12: Europe UAE Silica Sand Market Revenue (billion), by Country 2025 & 2033
- Figure 13: Europe UAE Silica Sand Market Revenue Share (%), by Country 2025 & 2033
- Figure 14: Middle East & Africa UAE Silica Sand Market Revenue (billion), by End-user Industry 2025 & 2033
- Figure 15: Middle East & Africa UAE Silica Sand Market Revenue Share (%), by End-user Industry 2025 & 2033
- Figure 16: Middle East & Africa UAE Silica Sand Market Revenue (billion), by Country 2025 & 2033
- Figure 17: Middle East & Africa UAE Silica Sand Market Revenue Share (%), by Country 2025 & 2033
- Figure 18: Asia Pacific UAE Silica Sand Market Revenue (billion), by End-user Industry 2025 & 2033
- Figure 19: Asia Pacific UAE Silica Sand Market Revenue Share (%), by End-user Industry 2025 & 2033
- Figure 20: Asia Pacific UAE Silica Sand Market Revenue (billion), by Country 2025 & 2033
- Figure 21: Asia Pacific UAE Silica Sand Market Revenue Share (%), by Country 2025 & 2033
List of Tables
- Table 1: Global UAE Silica Sand Market Revenue billion Forecast, by End-user Industry 2020 & 2033
- Table 2: Global UAE Silica Sand Market Revenue billion Forecast, by Region 2020 & 2033
- Table 3: Global UAE Silica Sand Market Revenue billion Forecast, by End-user Industry 2020 & 2033
- Table 4: Global UAE Silica Sand Market Revenue billion Forecast, by Country 2020 & 2033
- Table 5: United States UAE Silica Sand Market Revenue (billion) Forecast, by Application 2020 & 2033
- Table 6: Canada UAE Silica Sand Market Revenue (billion) Forecast, by Application 2020 & 2033
- Table 7: Mexico UAE Silica Sand Market Revenue (billion) Forecast, by Application 2020 & 2033
- Table 8: Global UAE Silica Sand Market Revenue billion Forecast, by End-user Industry 2020 & 2033
- Table 9: Global UAE Silica Sand Market Revenue billion Forecast, by Country 2020 & 2033
- Table 10: Brazil UAE Silica Sand Market Revenue (billion) Forecast, by Application 2020 & 2033
- Table 11: Argentina UAE Silica Sand Market Revenue (billion) Forecast, by Application 2020 & 2033
- Table 12: Rest of South America UAE Silica Sand Market Revenue (billion) Forecast, by Application 2020 & 2033
- Table 13: Global UAE Silica Sand Market Revenue billion Forecast, by End-user Industry 2020 & 2033
- Table 14: Global UAE Silica Sand Market Revenue billion Forecast, by Country 2020 & 2033
- Table 15: United Kingdom UAE Silica Sand Market Revenue (billion) Forecast, by Application 2020 & 2033
- Table 16: Germany UAE Silica Sand Market Revenue (billion) Forecast, by Application 2020 & 2033
- Table 17: France UAE Silica Sand Market Revenue (billion) Forecast, by Application 2020 & 2033
- Table 18: Italy UAE Silica Sand Market Revenue (billion) Forecast, by Application 2020 & 2033
- Table 19: Spain UAE Silica Sand Market Revenue (billion) Forecast, by Application 2020 & 2033
- Table 20: Russia UAE Silica Sand Market Revenue (billion) Forecast, by Application 2020 & 2033
- Table 21: Benelux UAE Silica Sand Market Revenue (billion) Forecast, by Application 2020 & 2033
- Table 22: Nordics UAE Silica Sand Market Revenue (billion) Forecast, by Application 2020 & 2033
- Table 23: Rest of Europe UAE Silica Sand Market Revenue (billion) Forecast, by Application 2020 & 2033
- Table 24: Global UAE Silica Sand Market Revenue billion Forecast, by End-user Industry 2020 & 2033
- Table 25: Global UAE Silica Sand Market Revenue billion Forecast, by Country 2020 & 2033
- Table 26: Turkey UAE Silica Sand Market Revenue (billion) Forecast, by Application 2020 & 2033
- Table 27: Israel UAE Silica Sand Market Revenue (billion) Forecast, by Application 2020 & 2033
- Table 28: GCC UAE Silica Sand Market Revenue (billion) Forecast, by Application 2020 & 2033
- Table 29: North Africa UAE Silica Sand Market Revenue (billion) Forecast, by Application 2020 & 2033
- Table 30: South Africa UAE Silica Sand Market Revenue (billion) Forecast, by Application 2020 & 2033
- Table 31: Rest of Middle East & Africa UAE Silica Sand Market Revenue (billion) Forecast, by Application 2020 & 2033
- Table 32: Global UAE Silica Sand Market Revenue billion Forecast, by End-user Industry 2020 & 2033
- Table 33: Global UAE Silica Sand Market Revenue billion Forecast, by Country 2020 & 2033
- Table 34: China UAE Silica Sand Market Revenue (billion) Forecast, by Application 2020 & 2033
- Table 35: India UAE Silica Sand Market Revenue (billion) Forecast, by Application 2020 & 2033
- Table 36: Japan UAE Silica Sand Market Revenue (billion) Forecast, by Application 2020 & 2033
- Table 37: South Korea UAE Silica Sand Market Revenue (billion) Forecast, by Application 2020 & 2033
- Table 38: ASEAN UAE Silica Sand Market Revenue (billion) Forecast, by Application 2020 & 2033
- Table 39: Oceania UAE Silica Sand Market Revenue (billion) Forecast, by Application 2020 & 2033
- Table 40: Rest of Asia Pacific UAE Silica Sand Market Revenue (billion) Forecast, by Application 2020 & 2033
Frequently Asked Questions
1. What is the projected Compound Annual Growth Rate (CAGR) of the UAE Silica Sand Market?
The projected CAGR is approximately 7.7%.
2. Which companies are prominent players in the UAE Silica Sand Market?
Key companies in the market include Mitsubishi Corporation, Rawasy Group, Delmon Co Ltd, Chem Source Egypt, National Ready Mix Concrete Co LLC, Adwan Chemical Industries Co Ltd, Cairo Minerals, Speciality Industries LLC*List Not Exhaustive, Gulf Minerals, Majd Al Muayad.
3. What are the main segments of the UAE Silica Sand Market?
The market segments include End-user Industry.
4. Can you provide details about the market size?
The market size is estimated to be USD 14.1 billion as of 2022.
5. What are some drivers contributing to market growth?
Growing Land Reclamation Projects Across the Region.
6. What are the notable trends driving market growth?
Growing Land Reclamation to Drive Demand for Silica Sand.
7. Are there any restraints impacting market growth?
Competition from Various Substitutes; Development of Sand-Free Construction Products.
8. Can you provide examples of recent developments in the market?
N/A
9. What pricing options are available for accessing the report?
Pricing options include single-user, multi-user, and enterprise licenses priced at USD 3800, USD 4500, and USD 5800 respectively.
10. Is the market size provided in terms of value or volume?
The market size is provided in terms of value, measured in billion.
11. Are there any specific market keywords associated with the report?
Yes, the market keyword associated with the report is "UAE Silica Sand Market," which aids in identifying and referencing the specific market segment covered.
12. How do I determine which pricing option suits my needs best?
The pricing options vary based on user requirements and access needs. Individual users may opt for single-user licenses, while businesses requiring broader access may choose multi-user or enterprise licenses for cost-effective access to the report.
13. Are there any additional resources or data provided in the UAE Silica Sand Market report?
While the report offers comprehensive insights, it's advisable to review the specific contents or supplementary materials provided to ascertain if additional resources or data are available.
14. How can I stay updated on further developments or reports in the UAE Silica Sand Market?
To stay informed about further developments, trends, and reports in the UAE Silica Sand Market, consider subscribing to industry newsletters, following relevant companies and organizations, or regularly checking reputable industry news sources and publications.
Methodology
Step 1 - Identification of Relevant Samples Size from Population Database


Step 2 - Approaches for Defining Global Market Size (Value, Volume* & Price*)

Note*: In applicable scenarios
Step 3 - Data Sources
Primary Research
- Web Analytics
- Survey Reports
- Research Institute
- Latest Research Reports
- Opinion Leaders
Secondary Research
- Annual Reports
- White Paper
- Latest Press Release
- Industry Association
- Paid Database
- Investor Presentations

Step 4 - Data Triangulation
Involves using different sources of information in order to increase the validity of a study
These sources are likely to be stakeholders in a program - participants, other researchers, program staff, other community members, and so on.
Then we put all data in single framework & apply various statistical tools to find out the dynamic on the market.
During the analysis stage, feedback from the stakeholder groups would be compared to determine areas of agreement as well as areas of divergence