

Key Insights
The United Arab Emirates (UAE) MICE (Meetings, Incentives, Conferences, and Exhibitions) market is poised for substantial expansion. Driven by its strategic global positioning, world-class infrastructure, and dedication to hosting premier international events, the sector benefits from significant government investment in tourism and infrastructure. This fosters a highly competitive environment conducive to event organizers and attendees alike. While historical data from 2019-2024 is not detailed, the UAE's ambitious expansion plans and alignment with global MICE industry trends indicate robust growth during this period. The consistent high volume of international events, coupled with proactive marketing and state-of-the-art facilities, suggests a market size of approximately 53361.9 million by 2025. This upward trajectory is anticipated to continue through the forecast period of 2025-2033, with an estimated Compound Annual Growth Rate (CAGR) of 6.6%.
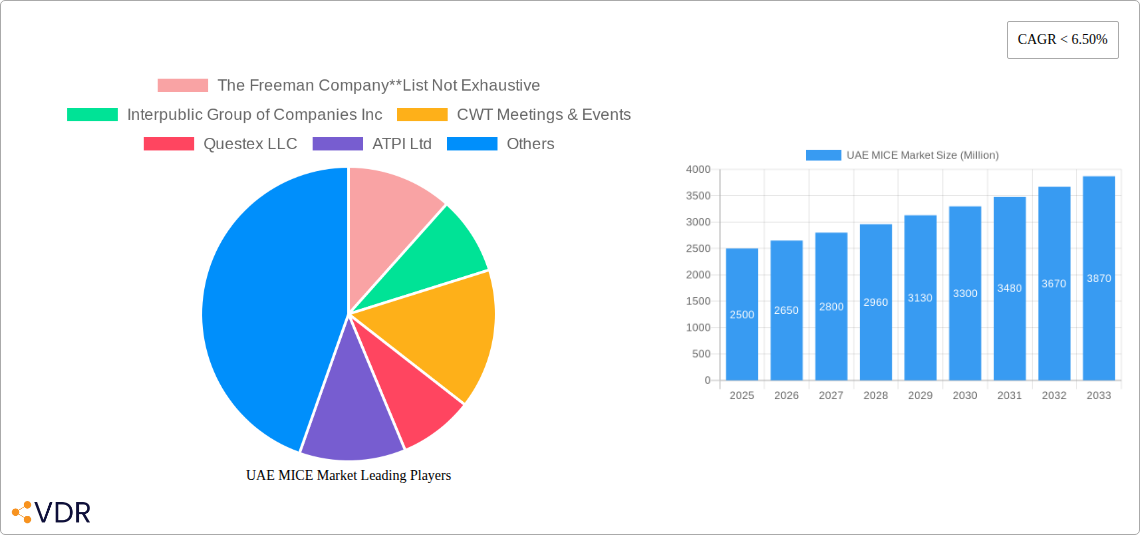
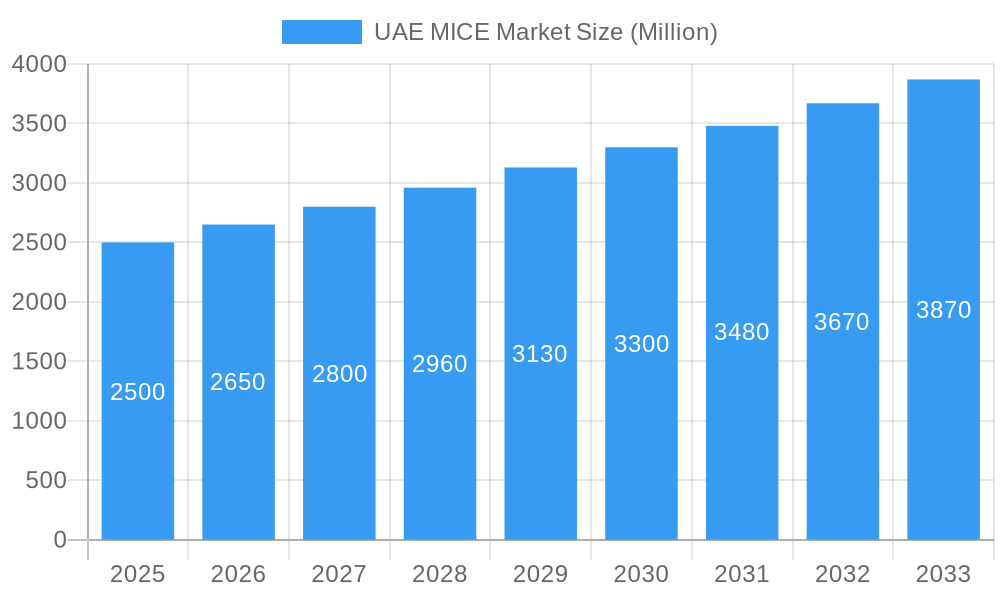
UAE MICE Market Market Size (In Billion)
The year 2024 serves as the base year for this analysis. The post-pandemic resurgence in demand for in-person events, amplified by the UAE's strategic recovery initiatives, is expected to contribute to a strong market performance. Ongoing economic diversification efforts, including investments in sustainable tourism and MICE technology, support sustained growth, though global economic factors and regional competition will influence market dynamics. Key determinants for long-term market success include visa policies, accessibility, and competitive pricing. A comprehensive and forward-thinking strategy is essential for the UAE to solidify its status as a leading global MICE destination.
UAE MICE Market Company Market Share
UAE MICE Market: A Comprehensive Market Report (2019-2033)
This in-depth report provides a comprehensive analysis of the UAE MICE (Meetings, Incentives, Conferences, and Exhibitions) market, offering valuable insights for industry professionals, investors, and stakeholders. The report covers the period from 2019 to 2033, with a focus on the estimated year 2025, and incorporates detailed market sizing, growth forecasts, and competitive landscape analysis. This report is crucial for understanding the dynamic UAE MICE market and capitalizing on its significant growth potential. The report includes analysis of parent market (Tourism) and child markets (Meeting, Incentive, Conventions, Exhibitions).
UAE MICE Market Dynamics & Structure
This section analyzes the UAE MICE market's structure, focusing on market concentration, technological advancements, regulatory frameworks, competitive substitutes, end-user demographics, and mergers and acquisitions (M&A) activity. The analysis incorporates both quantitative data (market share, M&A deal volume) and qualitative factors (innovation barriers).
- Market Concentration: The UAE MICE market exhibits a moderately concentrated structure, with a few large players holding significant market share. xx% of the market is controlled by the top 5 players.
- Technological Innovation: Technological advancements, such as virtual and hybrid event platforms, are transforming the industry, driving efficiency and expanding reach. However, adoption rates vary across segments.
- Regulatory Framework: The UAE government's supportive policies and infrastructure investments create a favorable regulatory environment for MICE events.
- Competitive Substitutes: The rise of virtual events presents a competitive substitute, but physical events remain crucial for networking and engagement.
- End-User Demographics: The UAE's diverse population and its position as a global hub attract a broad range of MICE event attendees.
- M&A Trends: The MICE sector has witnessed a moderate level of M&A activity in recent years, with larger companies consolidating their market position and expanding their service offerings. The total value of M&A deals between 2019 and 2024 is estimated at xx million.
UAE MICE Market Growth Trends & Insights
This section examines the historical and projected growth of the UAE MICE market, exploring market size evolution, adoption rates, technological disruptions, and shifting consumer behavior. The analysis includes key performance indicators such as the Compound Annual Growth Rate (CAGR) and market penetration rates.
The UAE MICE market experienced significant growth during the historical period (2019-2024), driven by factors such as increased tourism, government initiatives, and infrastructure development. The market size is predicted to be xx million in 2025, with a projected CAGR of xx% during the forecast period (2025-2033). Technological disruptions, such as the adoption of virtual and hybrid event formats, are reshaping consumer preferences and driving innovation within the industry. Consumer behavior is shifting towards more personalized, experiential, and technology-integrated MICE events.
Dominant Regions, Countries, or Segments in UAE MICE Market
This section identifies the leading region, country, or segment (Meeting, Incentive, Convention, Exhibition) driving market growth in the UAE.
- Dubai's Dominance: Dubai remains the dominant center for MICE events in the UAE, owing to its world-class infrastructure, strong tourism sector, and government support. Its market share is estimated at xx% in 2025.
- Key Drivers:
- Robust infrastructure: World-class venues like the Dubai World Trade Centre contribute significantly to Dubai's MICE success.
- Government support: Pro-business policies and initiatives aimed at promoting tourism and business events have fueled market growth.
- Strategic location: Dubai’s geographical location makes it easily accessible for international attendees.
- High-profile events: Hosting major international events further boosts the sector's visibility and attractiveness.
- Growth Potential of other segments: While Dubai dominates, other emirates also exhibit growth potential, especially Abu Dhabi, which is actively developing its MICE infrastructure. The Exhibitions segment is expected to experience the highest growth rate during the forecast period, driven by the increasing demand for specialized trade shows.
UAE MICE Market Product Landscape
The UAE MICE market offers a diverse range of products and services, from venue management and event planning to technological solutions for virtual and hybrid events. Recent innovations include advanced event management software, virtual reality experiences, and sustainable event practices. These solutions enhance event efficiency, attendee engagement, and overall sustainability. Unique selling propositions include personalized experiences, seamless technology integration, and commitment to sustainability.
Key Drivers, Barriers & Challenges in UAE MICE Market
Key Drivers:
- Government Initiatives: Supportive policies and substantial investments in infrastructure are major drivers of market growth.
- Tourism Growth: The UAE's flourishing tourism sector directly fuels the demand for MICE events.
- Expo 2020 Dubai Legacy: The Expo's success solidified the UAE's standing as a leading MICE destination, creating a positive ripple effect.
Key Challenges and Restraints:
- Competition: Intense competition from other regional and international MICE destinations can put pressure on pricing and margins.
- Economic Fluctuations: Global economic downturns can impact the frequency and scale of MICE events.
- Sustainability Concerns: The industry faces growing pressure to adopt sustainable practices and reduce its environmental impact.
Emerging Opportunities in UAE MICE Market
Emerging opportunities include the expansion of niche markets (e.g., medical conferences, technology summits), the adoption of innovative event formats (e.g., hybrid events, metaverse experiences), and the increasing focus on sustainability and corporate social responsibility. Untapped potential exists in attracting new types of events and expanding into regional markets.
Growth Accelerators in the UAE MICE Market Industry
Long-term growth will be driven by continuous infrastructure development, strategic partnerships between government agencies and private sector players, technological advancements, and the development of specialized event clusters focusing on specific industry sectors.
Key Players Shaping the UAE MICE Market Market
- The Freeman Company
- Interpublic Group of Companies Inc
- CWT Meetings & Events
- Questex LLC
- ATPI Ltd
- IBTM Events
- CIEVENTS
- BCD Meetings and Events
- Conference Care Ltd
Notable Milestones in UAE MICE Market Sector
- 2019: Dubai World Trade Centre welcomed a record 3.57 million delegates, showcasing a 4% increase in visitation. Dubai Business Events organized 301 meetings, conferences, and incentives, bidding for 595 events in 2020.
- 2020: Dubai's tourism sector was ranked among the top 10 strongest economic share generators.
- 2020-2022: Expo 2020 Dubai significantly boosted the UAE's MICE industry, bringing in substantial international attention and events.
In-Depth UAE MICE Market Market Outlook
The UAE MICE market is poised for continued growth, driven by robust infrastructure, government support, and a strong tourism sector. Strategic partnerships, technological innovation, and diversification into niche markets present significant opportunities for both established players and new entrants. The long-term outlook remains positive, with the potential for sustained expansion and market consolidation.
UAE MICE Market Segmentation
-
1. Event
- 1.1. Meeting
- 1.2. Incentive
- 1.3. Conventions
- 1.4. Exhibitions
UAE MICE Market Segmentation By Geography
-
1. North America
- 1.1. United States
- 1.2. Canada
- 1.3. Mexico
-
2. South America
- 2.1. Brazil
- 2.2. Argentina
- 2.3. Rest of South America
-
3. Europe
- 3.1. United Kingdom
- 3.2. Germany
- 3.3. France
- 3.4. Italy
- 3.5. Spain
- 3.6. Russia
- 3.7. Benelux
- 3.8. Nordics
- 3.9. Rest of Europe
-
4. Middle East & Africa
- 4.1. Turkey
- 4.2. Israel
- 4.3. GCC
- 4.4. North Africa
- 4.5. South Africa
- 4.6. Rest of Middle East & Africa
-
5. Asia Pacific
- 5.1. China
- 5.2. India
- 5.3. Japan
- 5.4. South Korea
- 5.5. ASEAN
- 5.6. Oceania
- 5.7. Rest of Asia Pacific
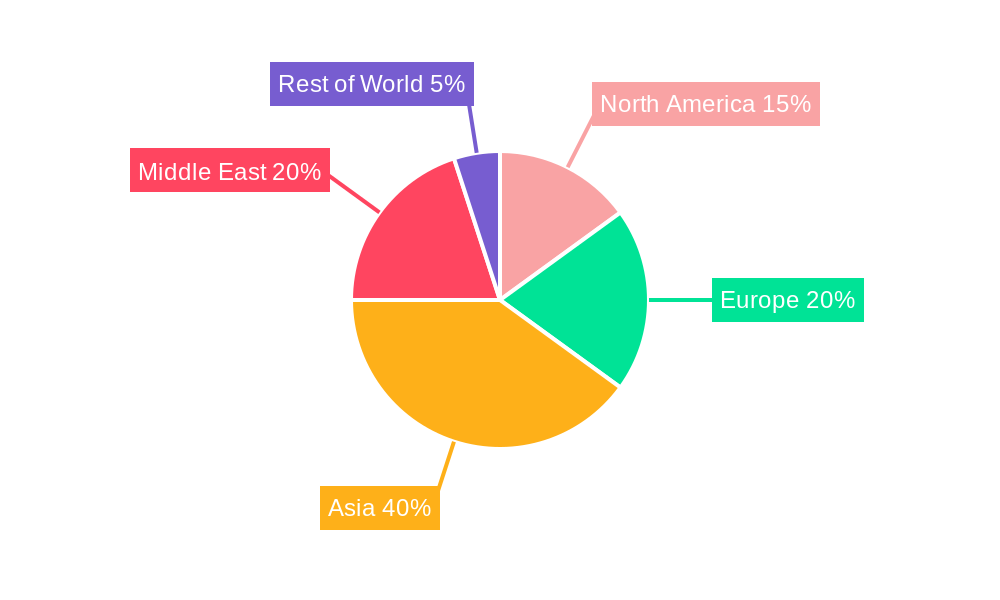
UAE MICE Market Regional Market Share
Geographic Coverage of UAE MICE Market
UAE MICE Market REPORT HIGHLIGHTS
| Aspects | Details |
|---|---|
| Study Period | 2020-2034 |
| Base Year | 2025 |
| Estimated Year | 2026 |
| Forecast Period | 2026-2034 |
| Historical Period | 2020-2025 |
| Growth Rate | CAGR of 6.6% from 2020-2034 |
| Segmentation |
|
Table of Contents
- 1. Introduction
- 1.1. Research Scope
- 1.2. Market Segmentation
- 1.3. Research Objective
- 1.4. Definitions and Assumptions
- 2. Executive Summary
- 2.1. Market Snapshot
- 3. Market Dynamics
- 3.1. Market Drivers
- 3.2. Market Restrains
- 3.3. Market Trends
- 3.4. Market Opportunities
- 4. Market Factor Analysis
- 4.1. Porters Five Forces
- 4.1.1. Bargaining Power of Suppliers
- 4.1.2. Bargaining Power of Buyers
- 4.1.3. Threat of New Entrants
- 4.1.4. Threat of Substitutes
- 4.1.5. Competitive Rivalry
- 4.2. PESTEL analysis
- 4.3. BCG Analysis
- 4.3.1. Stars (High Growth, High Market Share)
- 4.3.2. Cash Cows (Low Growth, High Market Share)
- 4.3.3. Question Mark (High Growth, Low Market Share)
- 4.3.4. Dogs (Low Growth, Low Market Share)
- 4.4. Ansoff Matrix Analysis
- 4.5. Supply Chain Analysis
- 4.6. Regulatory Landscape
- 4.7. Current Market Potential and Opportunity Assessment (TAM–SAM–SOM Framework)
- 4.8. VDR Analyst Note
- 4.1. Porters Five Forces
- 5. Market Analysis, Insights and Forecast 2021-2033
- 5.1. Market Analysis, Insights and Forecast - by Event
- 5.1.1. Meeting
- 5.1.2. Incentive
- 5.1.3. Conventions
- 5.1.4. Exhibitions
- 5.2. Market Analysis, Insights and Forecast - by Region
- 5.2.1. North America
- 5.2.2. South America
- 5.2.3. Europe
- 5.2.4. Middle East & Africa
- 5.2.5. Asia Pacific
- 5.1. Market Analysis, Insights and Forecast - by Event
- 6. Global UAE MICE Market Analysis, Insights and Forecast, 2021-2033
- 6.1. Market Analysis, Insights and Forecast - by Event
- 6.1.1. Meeting
- 6.1.2. Incentive
- 6.1.3. Conventions
- 6.1.4. Exhibitions
- 6.1. Market Analysis, Insights and Forecast - by Event
- 7. North America UAE MICE Market Analysis, Insights and Forecast, 2021-2033
- 7.1. Market Analysis, Insights and Forecast - by Event
- 7.1.1. Meeting
- 7.1.2. Incentive
- 7.1.3. Conventions
- 7.1.4. Exhibitions
- 7.1. Market Analysis, Insights and Forecast - by Event
- 8. South America UAE MICE Market Analysis, Insights and Forecast, 2021-2033
- 8.1. Market Analysis, Insights and Forecast - by Event
- 8.1.1. Meeting
- 8.1.2. Incentive
- 8.1.3. Conventions
- 8.1.4. Exhibitions
- 8.1. Market Analysis, Insights and Forecast - by Event
- 9. Europe UAE MICE Market Analysis, Insights and Forecast, 2021-2033
- 9.1. Market Analysis, Insights and Forecast - by Event
- 9.1.1. Meeting
- 9.1.2. Incentive
- 9.1.3. Conventions
- 9.1.4. Exhibitions
- 9.1. Market Analysis, Insights and Forecast - by Event
- 10. Middle East & Africa UAE MICE Market Analysis, Insights and Forecast, 2021-2033
- 10.1. Market Analysis, Insights and Forecast - by Event
- 10.1.1. Meeting
- 10.1.2. Incentive
- 10.1.3. Conventions
- 10.1.4. Exhibitions
- 10.1. Market Analysis, Insights and Forecast - by Event
- 11. Asia Pacific UAE MICE Market Analysis, Insights and Forecast, 2021-2033
- 11.1. Market Analysis, Insights and Forecast - by Event
- 11.1.1. Meeting
- 11.1.2. Incentive
- 11.1.3. Conventions
- 11.1.4. Exhibitions
- 11.1. Market Analysis, Insights and Forecast - by Event
- 12. Competitive Analysis
- 12.1. Company Profiles
- 12.1.1 The Freeman Company**List Not Exhaustive
- 12.1.1.1. Company Overview
- 12.1.1.2. Products
- 12.1.1.3. Company Financials
- 12.1.1.4. SWOT Analysis
- 12.1.2 Interpublic Group of Companies Inc
- 12.1.2.1. Company Overview
- 12.1.2.2. Products
- 12.1.2.3. Company Financials
- 12.1.2.4. SWOT Analysis
- 12.1.3 CWT Meetings & Events
- 12.1.3.1. Company Overview
- 12.1.3.2. Products
- 12.1.3.3. Company Financials
- 12.1.3.4. SWOT Analysis
- 12.1.4 Questex LLC
- 12.1.4.1. Company Overview
- 12.1.4.2. Products
- 12.1.4.3. Company Financials
- 12.1.4.4. SWOT Analysis
- 12.1.5 ATPI Ltd
- 12.1.5.1. Company Overview
- 12.1.5.2. Products
- 12.1.5.3. Company Financials
- 12.1.5.4. SWOT Analysis
- 12.1.6 IBTM Events
- 12.1.6.1. Company Overview
- 12.1.6.2. Products
- 12.1.6.3. Company Financials
- 12.1.6.4. SWOT Analysis
- 12.1.7 CIEVENTS
- 12.1.7.1. Company Overview
- 12.1.7.2. Products
- 12.1.7.3. Company Financials
- 12.1.7.4. SWOT Analysis
- 12.1.8 BCD Meetings and Events
- 12.1.8.1. Company Overview
- 12.1.8.2. Products
- 12.1.8.3. Company Financials
- 12.1.8.4. SWOT Analysis
- 12.1.9 Conference Care Ltd
- 12.1.9.1. Company Overview
- 12.1.9.2. Products
- 12.1.9.3. Company Financials
- 12.1.9.4. SWOT Analysis
- 12.1.1 The Freeman Company**List Not Exhaustive
- 12.2. Market Entropy
- 12.2.1 Company's Key Areas Served
- 12.2.2 Recent Developments
- 12.3. Company Market Share Analysis 2025
- 12.3.1 Top 5 Companies Market Share Analysis
- 12.3.2 Top 3 Companies Market Share Analysis
- 12.4. List of Potential Customers
- 13. Research Methodology
List of Figures
- Figure 1: Global UAE MICE Market Revenue Breakdown (million, %) by Region 2025 & 2033
- Figure 2: North America UAE MICE Market Revenue (million), by Event 2025 & 2033
- Figure 3: North America UAE MICE Market Revenue Share (%), by Event 2025 & 2033
- Figure 4: North America UAE MICE Market Revenue (million), by Country 2025 & 2033
- Figure 5: North America UAE MICE Market Revenue Share (%), by Country 2025 & 2033
- Figure 6: South America UAE MICE Market Revenue (million), by Event 2025 & 2033
- Figure 7: South America UAE MICE Market Revenue Share (%), by Event 2025 & 2033
- Figure 8: South America UAE MICE Market Revenue (million), by Country 2025 & 2033
- Figure 9: South America UAE MICE Market Revenue Share (%), by Country 2025 & 2033
- Figure 10: Europe UAE MICE Market Revenue (million), by Event 2025 & 2033
- Figure 11: Europe UAE MICE Market Revenue Share (%), by Event 2025 & 2033
- Figure 12: Europe UAE MICE Market Revenue (million), by Country 2025 & 2033
- Figure 13: Europe UAE MICE Market Revenue Share (%), by Country 2025 & 2033
- Figure 14: Middle East & Africa UAE MICE Market Revenue (million), by Event 2025 & 2033
- Figure 15: Middle East & Africa UAE MICE Market Revenue Share (%), by Event 2025 & 2033
- Figure 16: Middle East & Africa UAE MICE Market Revenue (million), by Country 2025 & 2033
- Figure 17: Middle East & Africa UAE MICE Market Revenue Share (%), by Country 2025 & 2033
- Figure 18: Asia Pacific UAE MICE Market Revenue (million), by Event 2025 & 2033
- Figure 19: Asia Pacific UAE MICE Market Revenue Share (%), by Event 2025 & 2033
- Figure 20: Asia Pacific UAE MICE Market Revenue (million), by Country 2025 & 2033
- Figure 21: Asia Pacific UAE MICE Market Revenue Share (%), by Country 2025 & 2033
List of Tables
- Table 1: Global UAE MICE Market Revenue million Forecast, by Event 2020 & 2033
- Table 2: Global UAE MICE Market Revenue million Forecast, by Region 2020 & 2033
- Table 3: Global UAE MICE Market Revenue million Forecast, by Event 2020 & 2033
- Table 4: Global UAE MICE Market Revenue million Forecast, by Country 2020 & 2033
- Table 5: United States UAE MICE Market Revenue (million) Forecast, by Application 2020 & 2033
- Table 6: Canada UAE MICE Market Revenue (million) Forecast, by Application 2020 & 2033
- Table 7: Mexico UAE MICE Market Revenue (million) Forecast, by Application 2020 & 2033
- Table 8: Global UAE MICE Market Revenue million Forecast, by Event 2020 & 2033
- Table 9: Global UAE MICE Market Revenue million Forecast, by Country 2020 & 2033
- Table 10: Brazil UAE MICE Market Revenue (million) Forecast, by Application 2020 & 2033
- Table 11: Argentina UAE MICE Market Revenue (million) Forecast, by Application 2020 & 2033
- Table 12: Rest of South America UAE MICE Market Revenue (million) Forecast, by Application 2020 & 2033
- Table 13: Global UAE MICE Market Revenue million Forecast, by Event 2020 & 2033
- Table 14: Global UAE MICE Market Revenue million Forecast, by Country 2020 & 2033
- Table 15: United Kingdom UAE MICE Market Revenue (million) Forecast, by Application 2020 & 2033
- Table 16: Germany UAE MICE Market Revenue (million) Forecast, by Application 2020 & 2033
- Table 17: France UAE MICE Market Revenue (million) Forecast, by Application 2020 & 2033
- Table 18: Italy UAE MICE Market Revenue (million) Forecast, by Application 2020 & 2033
- Table 19: Spain UAE MICE Market Revenue (million) Forecast, by Application 2020 & 2033
- Table 20: Russia UAE MICE Market Revenue (million) Forecast, by Application 2020 & 2033
- Table 21: Benelux UAE MICE Market Revenue (million) Forecast, by Application 2020 & 2033
- Table 22: Nordics UAE MICE Market Revenue (million) Forecast, by Application 2020 & 2033
- Table 23: Rest of Europe UAE MICE Market Revenue (million) Forecast, by Application 2020 & 2033
- Table 24: Global UAE MICE Market Revenue million Forecast, by Event 2020 & 2033
- Table 25: Global UAE MICE Market Revenue million Forecast, by Country 2020 & 2033
- Table 26: Turkey UAE MICE Market Revenue (million) Forecast, by Application 2020 & 2033
- Table 27: Israel UAE MICE Market Revenue (million) Forecast, by Application 2020 & 2033
- Table 28: GCC UAE MICE Market Revenue (million) Forecast, by Application 2020 & 2033
- Table 29: North Africa UAE MICE Market Revenue (million) Forecast, by Application 2020 & 2033
- Table 30: South Africa UAE MICE Market Revenue (million) Forecast, by Application 2020 & 2033
- Table 31: Rest of Middle East & Africa UAE MICE Market Revenue (million) Forecast, by Application 2020 & 2033
- Table 32: Global UAE MICE Market Revenue million Forecast, by Event 2020 & 2033
- Table 33: Global UAE MICE Market Revenue million Forecast, by Country 2020 & 2033
- Table 34: China UAE MICE Market Revenue (million) Forecast, by Application 2020 & 2033
- Table 35: India UAE MICE Market Revenue (million) Forecast, by Application 2020 & 2033
- Table 36: Japan UAE MICE Market Revenue (million) Forecast, by Application 2020 & 2033
- Table 37: South Korea UAE MICE Market Revenue (million) Forecast, by Application 2020 & 2033
- Table 38: ASEAN UAE MICE Market Revenue (million) Forecast, by Application 2020 & 2033
- Table 39: Oceania UAE MICE Market Revenue (million) Forecast, by Application 2020 & 2033
- Table 40: Rest of Asia Pacific UAE MICE Market Revenue (million) Forecast, by Application 2020 & 2033
Frequently Asked Questions
1. What is the projected Compound Annual Growth Rate (CAGR) of the UAE MICE Market?
The projected CAGR is approximately 6.6%.
2. Which companies are prominent players in the UAE MICE Market?
Key companies in the market include The Freeman Company**List Not Exhaustive, Interpublic Group of Companies Inc, CWT Meetings & Events, Questex LLC, ATPI Ltd, IBTM Events, CIEVENTS, BCD Meetings and Events, Conference Care Ltd.
3. What are the main segments of the UAE MICE Market?
The market segments include Event.
4. Can you provide details about the market size?
The market size is estimated to be USD 53361.9 million as of 2022.
5. What are some drivers contributing to market growth?
Social Media and Celebrity Influence; Increasing Disposable Income.
6. What are the notable trends driving market growth?
Enabling Digitised travel Ecosystem is driving the market.
7. Are there any restraints impacting market growth?
Cost of Services is a Restraining Factor for the Market; Limited Insurance Coverage is Restraining the Market.
8. Can you provide examples of recent developments in the market?
The Expo 2020 Dubai has brought a lot of positivity and the MICE (meetings, incentives, conferences and exhibitions) industry in the UAE and region is poised to grow with several new events added to the 2022 calendar.
9. What pricing options are available for accessing the report?
Pricing options include single-user, multi-user, and enterprise licenses priced at USD 3800, USD 4500, and USD 5800 respectively.
10. Is the market size provided in terms of value or volume?
The market size is provided in terms of value, measured in million.
11. Are there any specific market keywords associated with the report?
Yes, the market keyword associated with the report is "UAE MICE Market," which aids in identifying and referencing the specific market segment covered.
12. How do I determine which pricing option suits my needs best?
The pricing options vary based on user requirements and access needs. Individual users may opt for single-user licenses, while businesses requiring broader access may choose multi-user or enterprise licenses for cost-effective access to the report.
13. Are there any additional resources or data provided in the UAE MICE Market report?
While the report offers comprehensive insights, it's advisable to review the specific contents or supplementary materials provided to ascertain if additional resources or data are available.
14. How can I stay updated on further developments or reports in the UAE MICE Market?
To stay informed about further developments, trends, and reports in the UAE MICE Market, consider subscribing to industry newsletters, following relevant companies and organizations, or regularly checking reputable industry news sources and publications.
Methodology
Step 1 - Identification of Relevant Samples Size from Population Database


Step 2 - Approaches for Defining Global Market Size (Value, Volume* & Price*)

Note*: In applicable scenarios
Step 3 - Data Sources
Primary Research
- Web Analytics
- Survey Reports
- Research Institute
- Latest Research Reports
- Opinion Leaders
Secondary Research
- Annual Reports
- White Paper
- Latest Press Release
- Industry Association
- Paid Database
- Investor Presentations

Step 4 - Data Triangulation
Involves using different sources of information in order to increase the validity of a study
These sources are likely to be stakeholders in a program - participants, other researchers, program staff, other community members, and so on.
Then we put all data in single framework & apply various statistical tools to find out the dynamic on the market.
During the analysis stage, feedback from the stakeholder groups would be compared to determine areas of agreement as well as areas of divergence