

Key Insights
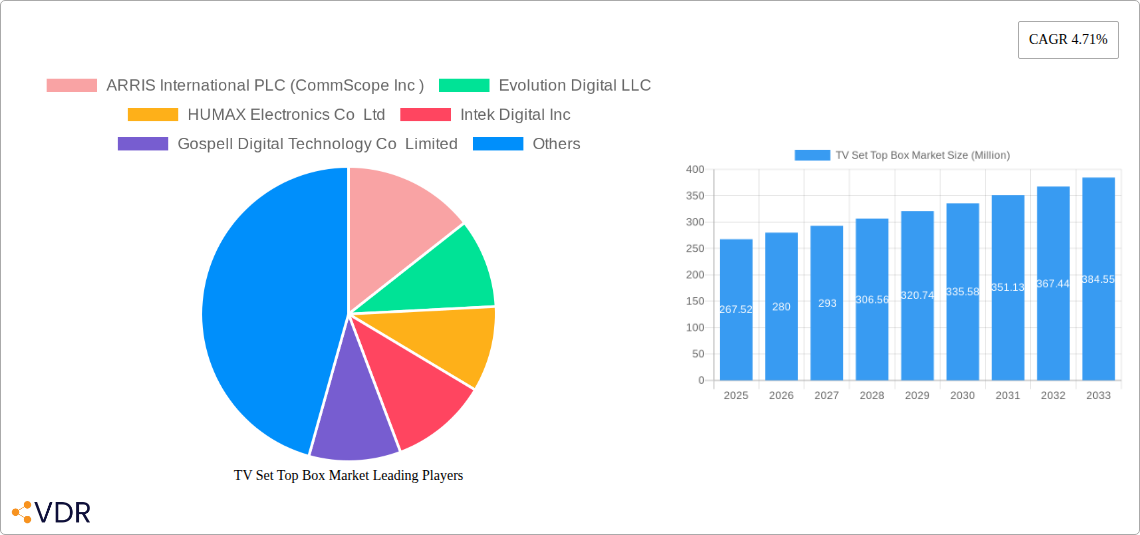
The global TV Set Top Box (STB) market, projected for significant expansion, is driven by the escalating demand for High-Definition (HD) and Ultra-High-Definition (UHD) content, the rapid adoption of Over-The-Top (OTT) streaming services, and the ongoing shift from traditional broadcast television. The market is expected to reach 307.1 million units, with a Compound Annual Growth Rate (CAGR) of 5.54% from the base year 2025 to 2033. Technological advancements, including smart features and enhanced user interfaces, are key growth catalysts. Growth is particularly propelled by the increasing adoption of IPTV and OTT services, alongside a rising preference for higher resolutions like UHD. The Asia Pacific region, led by China and India, is poised for substantial growth due to increasing internet penetration and a vast consumer base. Key market players include ARRIS International, HUMAX, and Technicolor, alongside emerging Asian competitors, all focused on delivering cost-effective, feature-rich solutions. Challenges include competition from smart TVs with integrated streaming capabilities and the imperative for manufacturers to adapt to evolving consumer preferences and technological innovations.
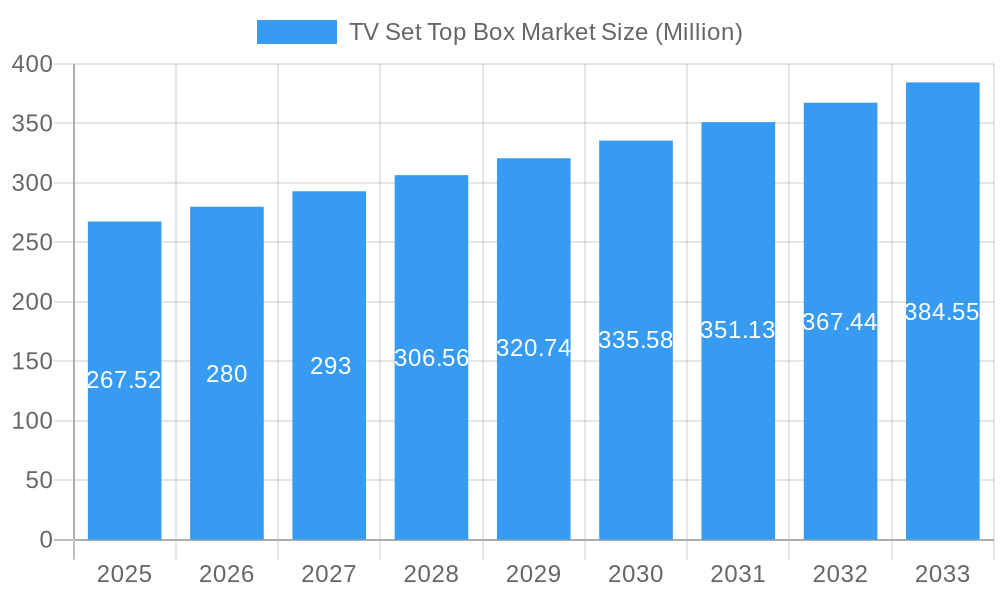
TV Set Top Box Market Market Size (In Million)
The competitive arena features a blend of established global companies and regional manufacturers. Ongoing technological progress in 4K/8K resolution support, enhanced processing power, and advanced features like voice control and smart home integration will continue to shape market dynamics. Furthermore, the growing adoption of cloud-based TV services and the increasing demand for personalized user experiences will define the future trajectory of the STB market. While the shift towards streaming services presents a challenge, the simultaneous demand for superior video quality and advanced features for both streaming and traditional broadcasting ensures the continued relevance of STBs. The market will emphasize integrating advanced functionalities within cost-effective frameworks to meet the diverse needs of consumers globally.
TV Set Top Box Market Company Market Share
TV Set Top Box Market Analysis: Global Outlook & Forecast (2019-2033)
This comprehensive report offers an in-depth analysis of the global TV Set Top Box market, covering market dynamics, growth trends, regional performance, product landscape, key players, and future outlook. The study period spans 2019-2033, with 2025 as the base year. The market is segmented by technology (Satellite/DTH, IPTV, Cable, Others), resolution (SD, HD, Ultra-HD and Higher), and key players. With a forecast period of 2025-2033 and a historical period of 2019-2024, this report is an essential resource for industry professionals, investors, and strategists. The market size is estimated at 307.1 million units for 2025, with a projected CAGR of 5.54%. The report forecasts xx million units by 2033.
TV Set Top Box Market Dynamics & Structure
The TV Set Top Box market is characterized by a moderately concentrated landscape, with several key players holding significant market share. Technological innovation, particularly in areas like 4K UHD, 5G integration, and smart TV functionalities, is a key driver. Regulatory frameworks impacting broadcasting and internet access influence market growth, while competitive pressures from streaming services and alternative entertainment options pose challenges. End-user demographics, shifting towards increased adoption of high-resolution streaming and smart features, also shape market dynamics. M&A activity has been moderate in recent years, with xx deals recorded between 2019 and 2024, resulting in a xx% shift in market share distribution among the top 5 players.
- Market Concentration: Moderately concentrated, with top 5 players holding approximately xx% of the market share in 2024.
- Technological Innovation: Key drivers include 4K UHD, 5G integration, and enhanced user interfaces (Android TV).
- Regulatory Frameworks: Government policies on broadcasting and internet access influence market access and growth.
- Competitive Substitutes: Streaming services and other digital entertainment platforms pose a significant competitive threat.
- End-User Demographics: Increasing demand for high-resolution content and smart features among younger demographics.
- M&A Trends: Moderate M&A activity, with xx deals recorded between 2019-2024, impacting market share distribution.
TV Set Top Box Market Growth Trends & Insights
The global TV Set Top Box market exhibited a CAGR of xx% during the historical period (2019-2024), reaching xx million units in 2024. Adoption rates are highest in regions with well-developed broadband infrastructure and high penetration of HD and Ultra-HD televisions. Technological disruptions, such as the increasing popularity of OTT platforms and the integration of smart features, are driving market growth. Consumer behavior shifts are evident in a preference for on-demand content and personalized viewing experiences. The forecast period (2025-2033) is expected to witness continued growth, driven by the expanding global broadband infrastructure, increasing penetration of smart TVs, and rising demand for high-quality streaming services. The market is expected to reach xx million units by 2033, exhibiting a projected CAGR of xx%. Factors like improved affordability and the development of more energy-efficient set-top boxes are also contributing to this positive outlook. However, challenges remain concerning the ongoing transition to streaming services and the increasing market fragmentation.
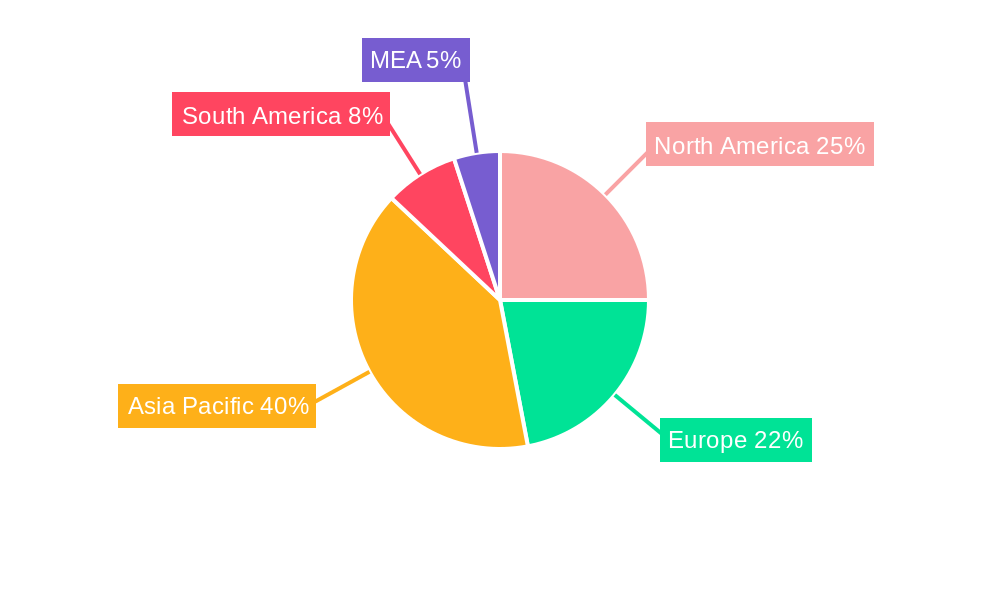
Dominant Regions, Countries, or Segments in TV Set Top Box Market
The Asia-Pacific region is expected to dominate the TV Set Top Box market throughout the forecast period, driven by strong economic growth, increasing disposable incomes, and significant expansion of broadband internet access. North America and Europe also contribute significantly. Within the technology segment, IPTV is anticipated to experience the fastest growth due to its flexibility and ability to integrate with OTT services. The Ultra-HD and Higher resolution segment also shows significant growth potential.
- Key Drivers:
- Asia-Pacific: Rapid economic growth, rising disposable incomes, expanding broadband infrastructure.
- IPTV Segment: Flexibility, integration with OTT services, high-quality streaming capabilities.
- Ultra-HD Segment: Growing consumer preference for high-resolution viewing experiences.
- Dominance Factors:
- Asia-Pacific: Large population base, increasing urbanization, strong government support for digitalization initiatives.
- IPTV: Enhanced features and flexibility compared to other technologies.
- Ultra-HD: Superior picture quality, driving consumer demand for enhanced viewing experience.
TV Set Top Box Market Product Landscape
The TV Set Top Box market showcases a wide array of products, ranging from basic SD models to advanced Ultra-HD set-top boxes with integrated smart functionalities, such as Android TV or other smart operating systems. Key innovations include improved energy efficiency, enhanced user interfaces, and seamless integration with streaming services. These innovations cater to a diverse range of consumer needs and preferences, focusing on improved user experience, personalized content delivery, and greater accessibility. These devices increasingly incorporate features that go beyond basic cable or satellite reception, offering advanced features like voice control, app stores, and integration with smart home ecosystems.
Key Drivers, Barriers & Challenges in TV Set Top Box Market
Key Drivers: The market is driven by the increasing adoption of high-definition and Ultra-HD televisions, the growth of broadband internet penetration, and the rising demand for on-demand and streaming content. Government initiatives promoting digital television and the development of advanced technologies like 5G also fuel market growth.
Key Challenges and Restraints: The market faces challenges from the increasing popularity of streaming services which directly compete with traditional cable TV, leading to declining subscriber bases for some cable operators. Supply chain disruptions, especially concerning the availability of crucial components, along with regulatory hurdles concerning data privacy, also create significant obstacles. Furthermore, intense competition from established and emerging players creates pricing pressures and necessitates ongoing innovation to maintain market share. This competitive landscape requires companies to constantly innovate and improve their product offerings, making it a high-stakes and dynamic market.
Emerging Opportunities in TV Set Top Box Market
Untapped markets in developing economies present significant opportunities, as increasing internet penetration and rising disposable incomes fuel demand. Innovative applications, such as integration with smart home ecosystems and personalized content recommendations, offer substantial growth potential. Evolving consumer preferences toward interactive and immersive viewing experiences open doors for manufacturers to develop next-generation set-top boxes with augmented reality or virtual reality capabilities.
Growth Accelerators in the TV Set Top Box Market Industry
Technological breakthroughs in areas such as 5G integration, improved energy efficiency, and advanced user interfaces are crucial catalysts for long-term growth. Strategic partnerships between manufacturers, content providers, and telecom operators facilitate seamless content delivery and expand market reach. Aggressive market expansion strategies, particularly in emerging economies, are key to unlocking long-term potential. This includes actively working with telecommunication providers and tailoring products to fit the unique requirements of each geographical market.
Key Players Shaping the TV Set Top Box Market Market
- ARRIS International PLC (CommScope Inc)
- Evolution Digital LLC
- HUMAX Electronics Co Ltd
- Intek Digital Inc
- Gospell Digital Technology Co Limited
- Shenzhen SDMC Technology Co Ltd
- Shenzhen Coship Electronics Co Ltd
- Sagemcom SAS
- ZTE Corporation
- Skyworth Digital Ltd
- Kaon Media Co Limited
- Technicolor SA
Notable Milestones in TV Set Top Box Market Sector
- February 2022: ZTE Corporation launched the ZXV10 B960GV1 5G media gateway set-top box, showcasing advancements in speed and video quality.
- March 2022: GTPL Hathway Limited introduced the GTPL Genie, a hybrid Android TV set-top box combining live TV and OTT capabilities.
In-Depth TV Set Top Box Market Market Outlook
The future of the TV Set Top Box market is bright, driven by several factors: Technological advancements, especially in areas of 5G, AI-powered features, and enhanced user interfaces will continue to attract consumers. Strategic partnerships are vital to gain access to content and distribution channels. Market expansion, especially in developing economies with increasing internet penetration, offers immense growth potential. Companies focused on innovation and strategic partnerships are best positioned to capture market share in this competitive and dynamic sector. The focus will be on integrating new technologies to meet ever-evolving user demand for high-quality, immersive, personalized entertainment experiences.
TV Set Top Box Market Segmentation
-
1. Technology
- 1.1. Satellite/DTH
- 1.2. IPTV
- 1.3. Cable
- 1.4. Other Types (DTT)
-
2. Resolution
- 2.1. SD
- 2.2. HD
- 2.3. Ultra-HD and Higher
TV Set Top Box Market Segmentation By Geography
- 1. North America
- 2. Europe
-
3. Asia
- 3.1. India
- 4. Australia and New Zealand
- 5. Latin America
- 6. Middle East and Africa
TV Set Top Box Market Regional Market Share
Geographic Coverage of TV Set Top Box Market
TV Set Top Box Market REPORT HIGHLIGHTS
| Aspects | Details |
|---|---|
| Study Period | 2020-2034 |
| Base Year | 2025 |
| Estimated Year | 2026 |
| Forecast Period | 2026-2034 |
| Historical Period | 2020-2025 |
| Growth Rate | CAGR of 5.54% from 2020-2034 |
| Segmentation |
|
Table of Contents
- 1. Introduction
- 1.1. Research Scope
- 1.2. Market Segmentation
- 1.3. Research Objective
- 1.4. Definitions and Assumptions
- 2. Executive Summary
- 2.1. Market Snapshot
- 3. Market Dynamics
- 3.1. Market Drivers
- 3.2. Market Restrains
- 3.3. Market Trends
- 3.4. Market Opportunities
- 4. Market Factor Analysis
- 4.1. Porters Five Forces
- 4.1.1. Bargaining Power of Suppliers
- 4.1.2. Bargaining Power of Buyers
- 4.1.3. Threat of New Entrants
- 4.1.4. Threat of Substitutes
- 4.1.5. Competitive Rivalry
- 4.2. PESTEL analysis
- 4.3. BCG Analysis
- 4.3.1. Stars (High Growth, High Market Share)
- 4.3.2. Cash Cows (Low Growth, High Market Share)
- 4.3.3. Question Mark (High Growth, Low Market Share)
- 4.3.4. Dogs (Low Growth, Low Market Share)
- 4.4. Ansoff Matrix Analysis
- 4.5. Supply Chain Analysis
- 4.6. Regulatory Landscape
- 4.7. Current Market Potential and Opportunity Assessment (TAM–SAM–SOM Framework)
- 4.8. VDR Analyst Note
- 4.1. Porters Five Forces
- 5. Market Analysis, Insights and Forecast 2021-2033
- 5.1. Market Analysis, Insights and Forecast - by Technology
- 5.1.1. Satellite/DTH
- 5.1.2. IPTV
- 5.1.3. Cable
- 5.1.4. Other Types (DTT)
- 5.2. Market Analysis, Insights and Forecast - by Resolution
- 5.2.1. SD
- 5.2.2. HD
- 5.2.3. Ultra-HD and Higher
- 5.3. Market Analysis, Insights and Forecast - by Region
- 5.3.1. North America
- 5.3.2. Europe
- 5.3.3. Asia
- 5.3.4. Australia and New Zealand
- 5.3.5. Latin America
- 5.3.6. Middle East and Africa
- 5.1. Market Analysis, Insights and Forecast - by Technology
- 6. Global TV Set Top Box Market Analysis, Insights and Forecast, 2021-2033
- 6.1. Market Analysis, Insights and Forecast - by Technology
- 6.1.1. Satellite/DTH
- 6.1.2. IPTV
- 6.1.3. Cable
- 6.1.4. Other Types (DTT)
- 6.2. Market Analysis, Insights and Forecast - by Resolution
- 6.2.1. SD
- 6.2.2. HD
- 6.2.3. Ultra-HD and Higher
- 6.1. Market Analysis, Insights and Forecast - by Technology
- 7. North America TV Set Top Box Market Analysis, Insights and Forecast, 2021-2033
- 7.1. Market Analysis, Insights and Forecast - by Technology
- 7.1.1. Satellite/DTH
- 7.1.2. IPTV
- 7.1.3. Cable
- 7.1.4. Other Types (DTT)
- 7.2. Market Analysis, Insights and Forecast - by Resolution
- 7.2.1. SD
- 7.2.2. HD
- 7.2.3. Ultra-HD and Higher
- 7.1. Market Analysis, Insights and Forecast - by Technology
- 8. Europe TV Set Top Box Market Analysis, Insights and Forecast, 2021-2033
- 8.1. Market Analysis, Insights and Forecast - by Technology
- 8.1.1. Satellite/DTH
- 8.1.2. IPTV
- 8.1.3. Cable
- 8.1.4. Other Types (DTT)
- 8.2. Market Analysis, Insights and Forecast - by Resolution
- 8.2.1. SD
- 8.2.2. HD
- 8.2.3. Ultra-HD and Higher
- 8.1. Market Analysis, Insights and Forecast - by Technology
- 9. Asia TV Set Top Box Market Analysis, Insights and Forecast, 2021-2033
- 9.1. Market Analysis, Insights and Forecast - by Technology
- 9.1.1. Satellite/DTH
- 9.1.2. IPTV
- 9.1.3. Cable
- 9.1.4. Other Types (DTT)
- 9.2. Market Analysis, Insights and Forecast - by Resolution
- 9.2.1. SD
- 9.2.2. HD
- 9.2.3. Ultra-HD and Higher
- 9.1. Market Analysis, Insights and Forecast - by Technology
- 10. Australia and New Zealand TV Set Top Box Market Analysis, Insights and Forecast, 2021-2033
- 10.1. Market Analysis, Insights and Forecast - by Technology
- 10.1.1. Satellite/DTH
- 10.1.2. IPTV
- 10.1.3. Cable
- 10.1.4. Other Types (DTT)
- 10.2. Market Analysis, Insights and Forecast - by Resolution
- 10.2.1. SD
- 10.2.2. HD
- 10.2.3. Ultra-HD and Higher
- 10.1. Market Analysis, Insights and Forecast - by Technology
- 11. Latin America TV Set Top Box Market Analysis, Insights and Forecast, 2021-2033
- 11.1. Market Analysis, Insights and Forecast - by Technology
- 11.1.1. Satellite/DTH
- 11.1.2. IPTV
- 11.1.3. Cable
- 11.1.4. Other Types (DTT)
- 11.2. Market Analysis, Insights and Forecast - by Resolution
- 11.2.1. SD
- 11.2.2. HD
- 11.2.3. Ultra-HD and Higher
- 11.1. Market Analysis, Insights and Forecast - by Technology
- 12. Middle East and Africa TV Set Top Box Market Analysis, Insights and Forecast, 2021-2033
- 12.1. Market Analysis, Insights and Forecast - by Technology
- 12.1.1. Satellite/DTH
- 12.1.2. IPTV
- 12.1.3. Cable
- 12.1.4. Other Types (DTT)
- 12.2. Market Analysis, Insights and Forecast - by Resolution
- 12.2.1. SD
- 12.2.2. HD
- 12.2.3. Ultra-HD and Higher
- 12.1. Market Analysis, Insights and Forecast - by Technology
- 13. Competitive Analysis
- 13.1. Company Profiles
- 13.1.1 ARRIS International PLC (CommScope Inc )
- 13.1.1.1. Company Overview
- 13.1.1.2. Products
- 13.1.1.3. Company Financials
- 13.1.1.4. SWOT Analysis
- 13.1.2 Evolution Digital LLC
- 13.1.2.1. Company Overview
- 13.1.2.2. Products
- 13.1.2.3. Company Financials
- 13.1.2.4. SWOT Analysis
- 13.1.3 HUMAX Electronics Co Ltd
- 13.1.3.1. Company Overview
- 13.1.3.2. Products
- 13.1.3.3. Company Financials
- 13.1.3.4. SWOT Analysis
- 13.1.4 Intek Digital Inc
- 13.1.4.1. Company Overview
- 13.1.4.2. Products
- 13.1.4.3. Company Financials
- 13.1.4.4. SWOT Analysis
- 13.1.5 Gospell Digital Technology Co Limited
- 13.1.5.1. Company Overview
- 13.1.5.2. Products
- 13.1.5.3. Company Financials
- 13.1.5.4. SWOT Analysis
- 13.1.6 Shenzhen SDMC Technology Co Ltd
- 13.1.6.1. Company Overview
- 13.1.6.2. Products
- 13.1.6.3. Company Financials
- 13.1.6.4. SWOT Analysis
- 13.1.7 Shenzhen Coship Electronics Co Ltd
- 13.1.7.1. Company Overview
- 13.1.7.2. Products
- 13.1.7.3. Company Financials
- 13.1.7.4. SWOT Analysis
- 13.1.8 Sagemcom SAS
- 13.1.8.1. Company Overview
- 13.1.8.2. Products
- 13.1.8.3. Company Financials
- 13.1.8.4. SWOT Analysis
- 13.1.9 ZTE Corporation
- 13.1.9.1. Company Overview
- 13.1.9.2. Products
- 13.1.9.3. Company Financials
- 13.1.9.4. SWOT Analysis
- 13.1.10 Skyworth Digital Ltd
- 13.1.10.1. Company Overview
- 13.1.10.2. Products
- 13.1.10.3. Company Financials
- 13.1.10.4. SWOT Analysis
- 13.1.11 Kaon Media Co Limited
- 13.1.11.1. Company Overview
- 13.1.11.2. Products
- 13.1.11.3. Company Financials
- 13.1.11.4. SWOT Analysis
- 13.1.12 Technicolor SA
- 13.1.12.1. Company Overview
- 13.1.12.2. Products
- 13.1.12.3. Company Financials
- 13.1.12.4. SWOT Analysis
- 13.1.1 ARRIS International PLC (CommScope Inc )
- 13.2. Market Entropy
- 13.2.1 Company's Key Areas Served
- 13.2.2 Recent Developments
- 13.3. Company Market Share Analysis 2025
- 13.3.1 Top 5 Companies Market Share Analysis
- 13.3.2 Top 3 Companies Market Share Analysis
- 13.4. List of Potential Customers
- 14. Research Methodology
List of Figures
- Figure 1: Global TV Set Top Box Market Revenue Breakdown (million, %) by Region 2025 & 2033
- Figure 2: Global TV Set Top Box Market Volume Breakdown (K Units, %) by Region 2025 & 2033
- Figure 3: North America TV Set Top Box Market Revenue (million), by Technology 2025 & 2033
- Figure 4: North America TV Set Top Box Market Volume (K Units), by Technology 2025 & 2033
- Figure 5: North America TV Set Top Box Market Revenue Share (%), by Technology 2025 & 2033
- Figure 6: North America TV Set Top Box Market Volume Share (%), by Technology 2025 & 2033
- Figure 7: North America TV Set Top Box Market Revenue (million), by Resolution 2025 & 2033
- Figure 8: North America TV Set Top Box Market Volume (K Units), by Resolution 2025 & 2033
- Figure 9: North America TV Set Top Box Market Revenue Share (%), by Resolution 2025 & 2033
- Figure 10: North America TV Set Top Box Market Volume Share (%), by Resolution 2025 & 2033
- Figure 11: North America TV Set Top Box Market Revenue (million), by Country 2025 & 2033
- Figure 12: North America TV Set Top Box Market Volume (K Units), by Country 2025 & 2033
- Figure 13: North America TV Set Top Box Market Revenue Share (%), by Country 2025 & 2033
- Figure 14: North America TV Set Top Box Market Volume Share (%), by Country 2025 & 2033
- Figure 15: Europe TV Set Top Box Market Revenue (million), by Technology 2025 & 2033
- Figure 16: Europe TV Set Top Box Market Volume (K Units), by Technology 2025 & 2033
- Figure 17: Europe TV Set Top Box Market Revenue Share (%), by Technology 2025 & 2033
- Figure 18: Europe TV Set Top Box Market Volume Share (%), by Technology 2025 & 2033
- Figure 19: Europe TV Set Top Box Market Revenue (million), by Resolution 2025 & 2033
- Figure 20: Europe TV Set Top Box Market Volume (K Units), by Resolution 2025 & 2033
- Figure 21: Europe TV Set Top Box Market Revenue Share (%), by Resolution 2025 & 2033
- Figure 22: Europe TV Set Top Box Market Volume Share (%), by Resolution 2025 & 2033
- Figure 23: Europe TV Set Top Box Market Revenue (million), by Country 2025 & 2033
- Figure 24: Europe TV Set Top Box Market Volume (K Units), by Country 2025 & 2033
- Figure 25: Europe TV Set Top Box Market Revenue Share (%), by Country 2025 & 2033
- Figure 26: Europe TV Set Top Box Market Volume Share (%), by Country 2025 & 2033
- Figure 27: Asia TV Set Top Box Market Revenue (million), by Technology 2025 & 2033
- Figure 28: Asia TV Set Top Box Market Volume (K Units), by Technology 2025 & 2033
- Figure 29: Asia TV Set Top Box Market Revenue Share (%), by Technology 2025 & 2033
- Figure 30: Asia TV Set Top Box Market Volume Share (%), by Technology 2025 & 2033
- Figure 31: Asia TV Set Top Box Market Revenue (million), by Resolution 2025 & 2033
- Figure 32: Asia TV Set Top Box Market Volume (K Units), by Resolution 2025 & 2033
- Figure 33: Asia TV Set Top Box Market Revenue Share (%), by Resolution 2025 & 2033
- Figure 34: Asia TV Set Top Box Market Volume Share (%), by Resolution 2025 & 2033
- Figure 35: Asia TV Set Top Box Market Revenue (million), by Country 2025 & 2033
- Figure 36: Asia TV Set Top Box Market Volume (K Units), by Country 2025 & 2033
- Figure 37: Asia TV Set Top Box Market Revenue Share (%), by Country 2025 & 2033
- Figure 38: Asia TV Set Top Box Market Volume Share (%), by Country 2025 & 2033
- Figure 39: Australia and New Zealand TV Set Top Box Market Revenue (million), by Technology 2025 & 2033
- Figure 40: Australia and New Zealand TV Set Top Box Market Volume (K Units), by Technology 2025 & 2033
- Figure 41: Australia and New Zealand TV Set Top Box Market Revenue Share (%), by Technology 2025 & 2033
- Figure 42: Australia and New Zealand TV Set Top Box Market Volume Share (%), by Technology 2025 & 2033
- Figure 43: Australia and New Zealand TV Set Top Box Market Revenue (million), by Resolution 2025 & 2033
- Figure 44: Australia and New Zealand TV Set Top Box Market Volume (K Units), by Resolution 2025 & 2033
- Figure 45: Australia and New Zealand TV Set Top Box Market Revenue Share (%), by Resolution 2025 & 2033
- Figure 46: Australia and New Zealand TV Set Top Box Market Volume Share (%), by Resolution 2025 & 2033
- Figure 47: Australia and New Zealand TV Set Top Box Market Revenue (million), by Country 2025 & 2033
- Figure 48: Australia and New Zealand TV Set Top Box Market Volume (K Units), by Country 2025 & 2033
- Figure 49: Australia and New Zealand TV Set Top Box Market Revenue Share (%), by Country 2025 & 2033
- Figure 50: Australia and New Zealand TV Set Top Box Market Volume Share (%), by Country 2025 & 2033
- Figure 51: Latin America TV Set Top Box Market Revenue (million), by Technology 2025 & 2033
- Figure 52: Latin America TV Set Top Box Market Volume (K Units), by Technology 2025 & 2033
- Figure 53: Latin America TV Set Top Box Market Revenue Share (%), by Technology 2025 & 2033
- Figure 54: Latin America TV Set Top Box Market Volume Share (%), by Technology 2025 & 2033
- Figure 55: Latin America TV Set Top Box Market Revenue (million), by Resolution 2025 & 2033
- Figure 56: Latin America TV Set Top Box Market Volume (K Units), by Resolution 2025 & 2033
- Figure 57: Latin America TV Set Top Box Market Revenue Share (%), by Resolution 2025 & 2033
- Figure 58: Latin America TV Set Top Box Market Volume Share (%), by Resolution 2025 & 2033
- Figure 59: Latin America TV Set Top Box Market Revenue (million), by Country 2025 & 2033
- Figure 60: Latin America TV Set Top Box Market Volume (K Units), by Country 2025 & 2033
- Figure 61: Latin America TV Set Top Box Market Revenue Share (%), by Country 2025 & 2033
- Figure 62: Latin America TV Set Top Box Market Volume Share (%), by Country 2025 & 2033
- Figure 63: Middle East and Africa TV Set Top Box Market Revenue (million), by Technology 2025 & 2033
- Figure 64: Middle East and Africa TV Set Top Box Market Volume (K Units), by Technology 2025 & 2033
- Figure 65: Middle East and Africa TV Set Top Box Market Revenue Share (%), by Technology 2025 & 2033
- Figure 66: Middle East and Africa TV Set Top Box Market Volume Share (%), by Technology 2025 & 2033
- Figure 67: Middle East and Africa TV Set Top Box Market Revenue (million), by Resolution 2025 & 2033
- Figure 68: Middle East and Africa TV Set Top Box Market Volume (K Units), by Resolution 2025 & 2033
- Figure 69: Middle East and Africa TV Set Top Box Market Revenue Share (%), by Resolution 2025 & 2033
- Figure 70: Middle East and Africa TV Set Top Box Market Volume Share (%), by Resolution 2025 & 2033
- Figure 71: Middle East and Africa TV Set Top Box Market Revenue (million), by Country 2025 & 2033
- Figure 72: Middle East and Africa TV Set Top Box Market Volume (K Units), by Country 2025 & 2033
- Figure 73: Middle East and Africa TV Set Top Box Market Revenue Share (%), by Country 2025 & 2033
- Figure 74: Middle East and Africa TV Set Top Box Market Volume Share (%), by Country 2025 & 2033
List of Tables
- Table 1: Global TV Set Top Box Market Revenue million Forecast, by Technology 2020 & 2033
- Table 2: Global TV Set Top Box Market Volume K Units Forecast, by Technology 2020 & 2033
- Table 3: Global TV Set Top Box Market Revenue million Forecast, by Resolution 2020 & 2033
- Table 4: Global TV Set Top Box Market Volume K Units Forecast, by Resolution 2020 & 2033
- Table 5: Global TV Set Top Box Market Revenue million Forecast, by Region 2020 & 2033
- Table 6: Global TV Set Top Box Market Volume K Units Forecast, by Region 2020 & 2033
- Table 7: Global TV Set Top Box Market Revenue million Forecast, by Technology 2020 & 2033
- Table 8: Global TV Set Top Box Market Volume K Units Forecast, by Technology 2020 & 2033
- Table 9: Global TV Set Top Box Market Revenue million Forecast, by Resolution 2020 & 2033
- Table 10: Global TV Set Top Box Market Volume K Units Forecast, by Resolution 2020 & 2033
- Table 11: Global TV Set Top Box Market Revenue million Forecast, by Country 2020 & 2033
- Table 12: Global TV Set Top Box Market Volume K Units Forecast, by Country 2020 & 2033
- Table 13: Global TV Set Top Box Market Revenue million Forecast, by Technology 2020 & 2033
- Table 14: Global TV Set Top Box Market Volume K Units Forecast, by Technology 2020 & 2033
- Table 15: Global TV Set Top Box Market Revenue million Forecast, by Resolution 2020 & 2033
- Table 16: Global TV Set Top Box Market Volume K Units Forecast, by Resolution 2020 & 2033
- Table 17: Global TV Set Top Box Market Revenue million Forecast, by Country 2020 & 2033
- Table 18: Global TV Set Top Box Market Volume K Units Forecast, by Country 2020 & 2033
- Table 19: Global TV Set Top Box Market Revenue million Forecast, by Technology 2020 & 2033
- Table 20: Global TV Set Top Box Market Volume K Units Forecast, by Technology 2020 & 2033
- Table 21: Global TV Set Top Box Market Revenue million Forecast, by Resolution 2020 & 2033
- Table 22: Global TV Set Top Box Market Volume K Units Forecast, by Resolution 2020 & 2033
- Table 23: Global TV Set Top Box Market Revenue million Forecast, by Country 2020 & 2033
- Table 24: Global TV Set Top Box Market Volume K Units Forecast, by Country 2020 & 2033
- Table 25: India TV Set Top Box Market Revenue (million) Forecast, by Application 2020 & 2033
- Table 26: India TV Set Top Box Market Volume (K Units) Forecast, by Application 2020 & 2033
- Table 27: Global TV Set Top Box Market Revenue million Forecast, by Technology 2020 & 2033
- Table 28: Global TV Set Top Box Market Volume K Units Forecast, by Technology 2020 & 2033
- Table 29: Global TV Set Top Box Market Revenue million Forecast, by Resolution 2020 & 2033
- Table 30: Global TV Set Top Box Market Volume K Units Forecast, by Resolution 2020 & 2033
- Table 31: Global TV Set Top Box Market Revenue million Forecast, by Country 2020 & 2033
- Table 32: Global TV Set Top Box Market Volume K Units Forecast, by Country 2020 & 2033
- Table 33: Global TV Set Top Box Market Revenue million Forecast, by Technology 2020 & 2033
- Table 34: Global TV Set Top Box Market Volume K Units Forecast, by Technology 2020 & 2033
- Table 35: Global TV Set Top Box Market Revenue million Forecast, by Resolution 2020 & 2033
- Table 36: Global TV Set Top Box Market Volume K Units Forecast, by Resolution 2020 & 2033
- Table 37: Global TV Set Top Box Market Revenue million Forecast, by Country 2020 & 2033
- Table 38: Global TV Set Top Box Market Volume K Units Forecast, by Country 2020 & 2033
- Table 39: Global TV Set Top Box Market Revenue million Forecast, by Technology 2020 & 2033
- Table 40: Global TV Set Top Box Market Volume K Units Forecast, by Technology 2020 & 2033
- Table 41: Global TV Set Top Box Market Revenue million Forecast, by Resolution 2020 & 2033
- Table 42: Global TV Set Top Box Market Volume K Units Forecast, by Resolution 2020 & 2033
- Table 43: Global TV Set Top Box Market Revenue million Forecast, by Country 2020 & 2033
- Table 44: Global TV Set Top Box Market Volume K Units Forecast, by Country 2020 & 2033
Frequently Asked Questions
1. What is the projected Compound Annual Growth Rate (CAGR) of the TV Set Top Box Market?
The projected CAGR is approximately 5.54%.
2. Which companies are prominent players in the TV Set Top Box Market?
Key companies in the market include ARRIS International PLC (CommScope Inc ), Evolution Digital LLC, HUMAX Electronics Co Ltd, Intek Digital Inc, Gospell Digital Technology Co Limited, Shenzhen SDMC Technology Co Ltd, Shenzhen Coship Electronics Co Ltd, Sagemcom SAS, ZTE Corporation, Skyworth Digital Ltd, Kaon Media Co Limited, Technicolor SA.
3. What are the main segments of the TV Set Top Box Market?
The market segments include Technology, Resolution.
4. Can you provide details about the market size?
The market size is estimated to be USD 307.1 million as of 2022.
5. What are some drivers contributing to market growth?
High Levels of Technological Innovations; Increasing Adoption of Set-Top Boxes in the Emerging Markets; Deployment of OS-based Devices.
6. What are the notable trends driving market growth?
HD Resolution Held the Largest Market Share.
7. Are there any restraints impacting market growth?
Growing Online OTT Services/Platform.
8. Can you provide examples of recent developments in the market?
March 2022 - The GTPL Genie, a Hybrid Android TV Set Top Box, which provides easy Live TV and OTT channels at an attractive bulk price, was introduced by GTPL Hathway Limited (GTPL), a leading supplier of digital cable TV and broadband service in India. GTPL Genie blends the strength of classic Cable TV with contemporary features and a customizable environment to offer a wide variety of content in OTT entertainment apps. Customers can now watch popular OTT app material on their existing TV screen in addition to line TV channels as part of GTPL Genie's expansion of its "Connection Dil Se" offer.
9. What pricing options are available for accessing the report?
Pricing options include single-user, multi-user, and enterprise licenses priced at USD 4750, USD 5250, and USD 8750 respectively.
10. Is the market size provided in terms of value or volume?
The market size is provided in terms of value, measured in million and volume, measured in K Units.
11. Are there any specific market keywords associated with the report?
Yes, the market keyword associated with the report is "TV Set Top Box Market," which aids in identifying and referencing the specific market segment covered.
12. How do I determine which pricing option suits my needs best?
The pricing options vary based on user requirements and access needs. Individual users may opt for single-user licenses, while businesses requiring broader access may choose multi-user or enterprise licenses for cost-effective access to the report.
13. Are there any additional resources or data provided in the TV Set Top Box Market report?
While the report offers comprehensive insights, it's advisable to review the specific contents or supplementary materials provided to ascertain if additional resources or data are available.
14. How can I stay updated on further developments or reports in the TV Set Top Box Market?
To stay informed about further developments, trends, and reports in the TV Set Top Box Market, consider subscribing to industry newsletters, following relevant companies and organizations, or regularly checking reputable industry news sources and publications.
Methodology
Step 1 - Identification of Relevant Samples Size from Population Database


Step 2 - Approaches for Defining Global Market Size (Value, Volume* & Price*)

Note*: In applicable scenarios
Step 3 - Data Sources
Primary Research
- Web Analytics
- Survey Reports
- Research Institute
- Latest Research Reports
- Opinion Leaders
Secondary Research
- Annual Reports
- White Paper
- Latest Press Release
- Industry Association
- Paid Database
- Investor Presentations

Step 4 - Data Triangulation
Involves using different sources of information in order to increase the validity of a study
These sources are likely to be stakeholders in a program - participants, other researchers, program staff, other community members, and so on.
Then we put all data in single framework & apply various statistical tools to find out the dynamic on the market.
During the analysis stage, feedback from the stakeholder groups would be compared to determine areas of agreement as well as areas of divergence