

Key Insights
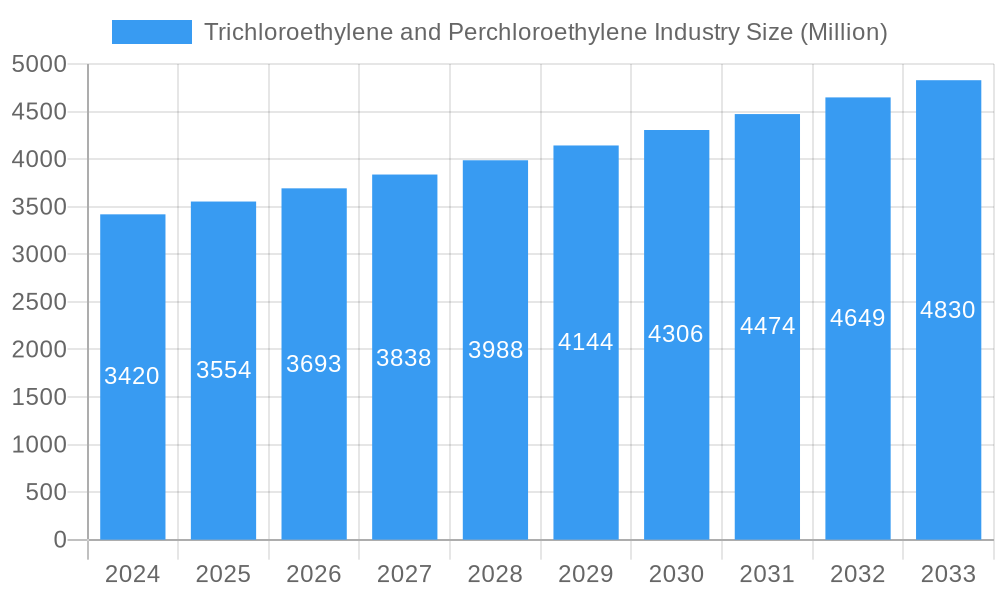
The global Trichloroethylene and Perchloroethylene market is projected to experience steady growth, with an estimated market size of $3.42 billion in 2024. Driven by essential applications in metal degreasing, dry cleaning, and as a crucial intermediate in chemical manufacturing, the market is expected to expand at a Compound Annual Growth Rate (CAGR) of 3.9% from 2025 to 2033. Perchloroethylene (PCE), in particular, continues to be a dominant segment due to its effectiveness as a solvent. The demand for these chemicals is significantly influenced by industrial activity, particularly in manufacturing sectors that rely on efficient cleaning and degreasing processes. Emerging economies, with their burgeoning industrial bases, are anticipated to be key growth engines, while advancements in alternative, more environmentally friendly solvents may pose a restraint to long-term expansion.
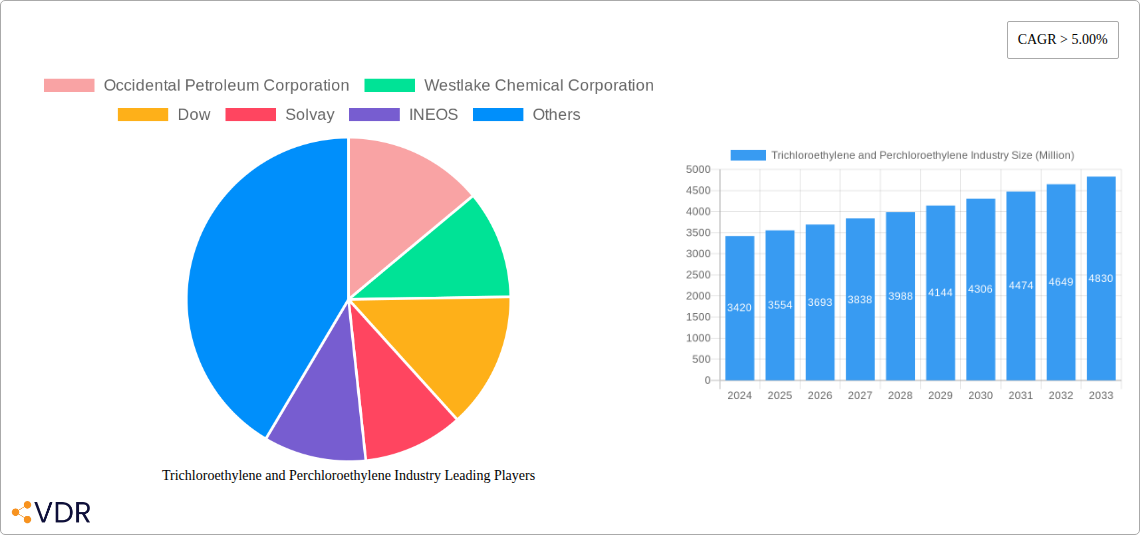
Trichloroethylene and Perchloroethylene Industry Market Size (In Billion)
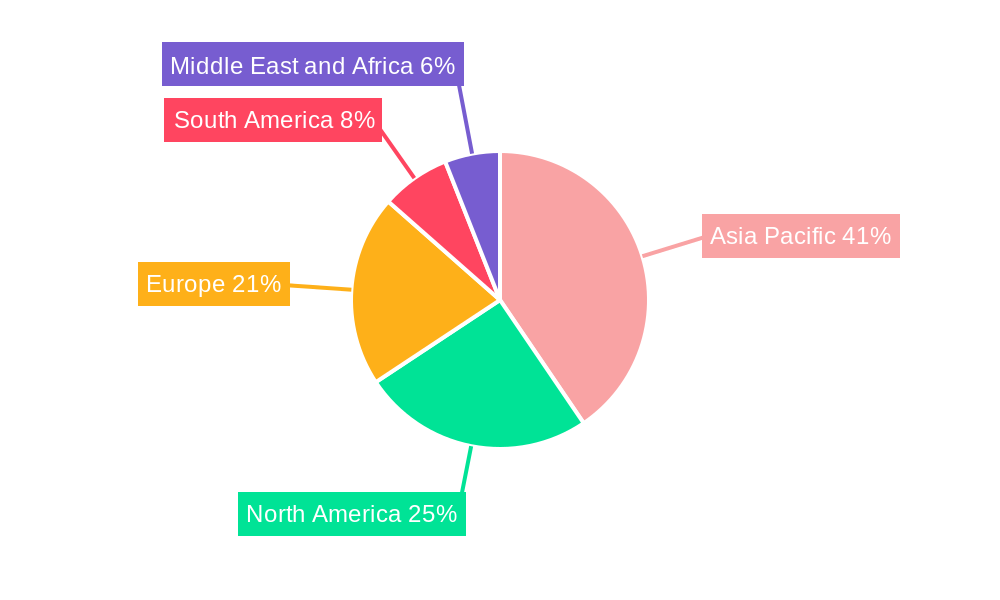
While historically reliant on specific industries, the market is evolving. The Refrigeration and Air Conditioning segment, though potentially facing regulatory pressures due to environmental concerns, still contributes to demand. Metal Degreasing remains a cornerstone application, bolstered by stringent quality control requirements in automotive and aerospace manufacturing. The Asia Pacific region, led by China and India, is poised to be the largest and fastest-growing market, owing to extensive industrialization and infrastructure development. North America and Europe, while mature markets, will continue to see demand driven by specialized industrial applications and the automotive sector. Innovations in production efficiency and the development of closed-loop systems for solvent recovery are key trends shaping the market landscape, aimed at mitigating environmental impact and enhancing economic viability.
Trichloroethylene and Perchloroethylene Industry Company Market Share
Comprehensive Report: Trichloroethylene and Perchloroethylene Industry Market Analysis & Forecast (2019-2033)
This in-depth report provides a detailed analysis of the global Trichloroethylene (TCE) and Perchloroethylene (PCE) industry, offering critical insights into market dynamics, growth trends, regional dominance, product landscape, key drivers, barriers, emerging opportunities, growth accelerators, and a comprehensive player analysis. With a study period spanning from 2019 to 2033, a base year of 2025, and a forecast period of 2025-2033, this report equips industry professionals with actionable intelligence to navigate the evolving market. Discover the parent and child market dynamics, segment breakdowns by type and application, and quantitative data in billions of USD.
Trichloroethylene and Perchloroethylene Industry Market Dynamics & Structure
The Trichloroethylene and Perchloroethylene (TCE & PCE) market exhibits a moderately concentrated structure, with key players like Occidental Petroleum Corporation, Westlake Chemical Corporation, Dow, Solvay, and INEOS holding significant market shares. Technological innovation is primarily driven by advancements in production efficiency and the development of safer handling and disposal methods, as regulatory scrutiny around environmental impact intensifies. Strict environmental regulations, particularly concerning emissions and waste management, act as both a barrier to entry and a catalyst for innovation in greener alternatives or closed-loop systems. Competitive product substitutes are emerging, with a growing emphasis on aqueous cleaning solutions and less volatile organic compounds (VOCs) for metal degreasing and dry cleaning applications, impacting the market penetration of TCE and PCE. End-user demographics are shifting, with a decline in traditional dry cleaning due to environmental concerns and a sustained demand from industrial metal degreasing and automotive aerosol applications. Mergers and acquisitions (M&A) activity, while not as pronounced as in some other chemical sectors, is present, aimed at consolidating market positions and expanding product portfolios. For instance, the historical period (2019-2024) has seen xx M&A deals with a combined value of $xx billion, signaling strategic moves to adapt to changing market demands. Barriers to innovation include the significant capital investment required for research into environmentally friendly alternatives and the challenge of achieving cost-competitiveness with established TCE and PCE processes.
Trichloroethylene and Perchloroethylene Industry Growth Trends & Insights
The Trichloroethylene and Perchloroethylene (TCE & PCE) market is projected to experience a steady growth trajectory over the forecast period. The global market size, valued at approximately $xx billion in 2024, is anticipated to reach $xx billion by 2033, exhibiting a Compound Annual Growth Rate (CAGR) of xx% from 2025 to 2033. This growth is underpinned by the persistent demand for these solvents in crucial industrial applications, particularly metal degreasing and specialized textile treatments, which are integral to manufacturing and automotive sectors. Adoption rates for TCE and PCE remain strong in regions with less stringent environmental regulations or where the cost-effectiveness of these solvents outweighs the investment in alternative technologies. However, the market is also witnessing significant technological disruptions. Research and development efforts are increasingly focused on enhancing the safety profiles of existing TCE and PCE products through improved containment and emission control technologies, and exploring synergistic blends that reduce the overall environmental footprint. Consumer behavior shifts, particularly in the dry cleaning sector, are leading to a decline in traditional PCE usage, prompting a greater focus on industrial applications. Market penetration for TCE and PCE in emerging economies, driven by rapid industrialization and infrastructure development, is expected to offset declines in more mature markets. The estimated market size in 2025 stands at $xx billion.
Dominant Regions, Countries, or Segments in Trichloroethylene and Perchloroethylene Industry
The Asia-Pacific region stands out as the dominant force in the Trichloroethylene and Perchloroethylene (TCE & PCE) market, driven by its burgeoning industrial sector and robust manufacturing output. Countries like China, India, and Southeast Asian nations are key contributors, fueled by significant investments in infrastructure, automotive manufacturing, and electronics production, all of which rely heavily on TCE and PCE for metal degreasing and specialized cleaning processes. Within segments, Metal Degreasing emerges as the leading application, accounting for an estimated xx% of the total market share in 2025 and projected to grow at a CAGR of xx% through 2033. This dominance is attributed to the critical role of effective metal cleaning in ensuring the quality and longevity of manufactured goods, from automotive components to industrial machinery.
Asia-Pacific's Dominance:
- Rapid industrialization and a large manufacturing base in China and India.
- Government initiatives promoting domestic manufacturing and industrial growth.
- Lower environmental compliance costs compared to Western regions, enabling wider adoption of traditional solvents.
- Significant presence of end-user industries like automotive and electronics.
Metal Degreasing Application:
- Essential for precision cleaning in the automotive, aerospace, and electronics industries.
- Cost-effectiveness and efficacy compared to many alternative cleaning methods.
- Continued demand for robust and reliable cleaning solutions in manufacturing processes.
While Perchloroethylene (PCE) remains a significant product type, Trichloroethylene (TCE) also holds a substantial market share, especially in industrial degreasing. The forecast period anticipates a sustained demand for TCE in metal degreasing applications, while the use of PCE in dry cleaning is expected to see a gradual decline due to regulatory pressures and the rise of eco-friendly alternatives. The "Other Applications" segment, encompassing niche industrial uses, also presents growth potential due to the unique solvent properties of TCE and PCE. The market size for TCE and PCE in 2025 is estimated at $xx billion.
Trichloroethylene and Perchloroethylene Industry Product Landscape
The product landscape for Trichloroethylene (TCE) and Perchloroethylene (PCE) is characterized by established chemical formulations and ongoing efforts to enhance their application efficiency and environmental compatibility. Key product innovations focus on improving purity grades for highly sensitive industrial processes, developing stabilized formulations to extend shelf life and minimize degradation, and introducing specialized blends tailored for specific cleaning challenges. For metal degreasing, products offer superior solvency for oils, greases, and waxes, ensuring critical surface preparation for subsequent treatments like painting or coating. In niche textile applications, TCE and PCE provide effective stain removal and finishing. While radical new chemical compounds are less frequent, the value proposition lies in consistent performance, cost-effectiveness, and the development of ancillary products like containment systems and waste treatment solutions that mitigate environmental risks associated with their use.
Key Drivers, Barriers & Challenges in Trichloroethylene and Perchloroethylene Industry
Key Drivers:
- Industrial Demand: Sustained and growing demand from metal degreasing, automotive aerosol, and specialized textile treatment applications, particularly in emerging economies.
- Cost-Effectiveness: TCE and PCE often remain the most economical choices for many industrial cleaning and degreasing processes compared to newer alternatives.
- Established Infrastructure: Existing manufacturing and distribution networks for TCE and PCE provide a competitive advantage.
- Performance Efficacy: Their high solvency power and effectiveness in removing stubborn contaminants are difficult to replicate with certain substitutes.
Barriers & Challenges:
- Environmental Regulations: Increasingly stringent regulations concerning volatile organic compound (VOC) emissions, hazardous waste disposal, and potential health risks associated with TCE and PCE. This leads to increased compliance costs and pressure to find alternatives.
- Health Concerns: Growing awareness and concern among workers and the public regarding the potential health impacts of exposure to TCE and PCE, necessitating strict safety protocols and handling procedures.
- Competition from Substitutes: The development and adoption of greener, less toxic cleaning solvents and technologies are posing a significant competitive threat, particularly in applications like dry cleaning.
- Supply Chain Volatility: Geopolitical factors and raw material availability can impact production costs and supply chain reliability.
- Public Perception: Negative public perception surrounding chlorinated solvents can influence purchasing decisions and regulatory policies. The market value of TCE & PCE in 2025 is estimated at $xx billion.
Emerging Opportunities in Trichloroethylene and Perchloroethylene Industry
Emerging opportunities within the Trichloroethylene and Perchloroethylene (TCE & PCE) industry lie in the development of closed-loop recycling and recovery systems that minimize environmental release and reduce the need for virgin production. Innovation in stabilized formulations and advanced containment technologies can enhance their appeal in regulated markets by mitigating risks and improving safety. Furthermore, exploring niche industrial applications where their unique solvency properties are indispensable, such as in specialized electronics manufacturing or specific medical device cleaning, presents untapped potential. The development of hybrid cleaning solutions that integrate TCE/PCE with greener solvents to optimize performance while reducing environmental impact could also open new avenues.
Growth Accelerators in the Trichloroethylene and Perchloroethylene Industry Industry
The long-term growth of the Trichloroethylene and Perchloroethylene (TCE & PCE) industry will be significantly accelerated by strategic partnerships focused on developing and implementing advanced emission control and waste management technologies. Investments in research and development for safer handling practices and improved product stewardship programs will be crucial in maintaining market access and addressing regulatory concerns. Furthermore, market expansion into regions with less restrictive environmental frameworks that still possess robust industrial growth will serve as a key accelerator. Technological breakthroughs in solvent recovery and purification techniques that enable cost-effective recycling will also be pivotal in sustaining the economic viability of TCE and PCE in the face of increasing environmental pressures.
Key Players Shaping the Trichloroethylene and Perchloroethylene Industry Market
- Occidental Petroleum Corporation
- Westlake Chemical Corporation
- Dow
- Solvay
- INEOS
- 3M
- Shin-Etsu Chemical
- Kem One
Notable Milestones in Trichloroethylene and Perchloroethylene Industry Sector
- 2019: Introduction of enhanced containment systems for industrial TCE usage by major manufacturers, aiming to reduce fugitive emissions.
- 2020: Increased regulatory scrutiny on PCE in dry cleaning in several European countries, driving a shift towards alternative cleaning methods.
- 2021: Development of advanced purification techniques for TCE and PCE, improving product quality and recyclability.
- 2022: Strategic partnerships formed to explore sustainable production methods and waste valorization for chlorinated solvents.
- 2023: Expansion of specialized TCE applications in niche automotive manufacturing processes requiring high-precision cleaning.
- 2024: Continued investment in R&D for stabilized TCE and PCE formulations to improve longevity and reduce environmental impact.
In-Depth Trichloroethylene and Perchloroethylene Industry Market Outlook
The Trichloroethylene and Perchloroethylene (TCE & PCE) industry outlook points towards a market that, while facing significant regulatory and environmental pressures, will persist due to its established role in critical industrial processes. Growth accelerators will center on the innovation of safer handling and disposal technologies, alongside the development of effective recycling and recovery systems that mitigate environmental footprints. Strategic alliances focused on sustainable product stewardship and market expansion in developing industrial economies will be vital for sustained growth. The future lies in adapting existing chemistries with enhanced environmental controls rather than outright replacement in many core industrial applications. The estimated market size for TCE and PCE in 2025 is $xx billion.
Trichloroethylene and Perchloroethylene Industry Segmentation
-
1. Type
- 1.1. Perchloroethylene (PCE)
- 1.2. Trichloroethylene (TCE)
- 1.3. 1,1,1-Trichloroethane (TCA)
-
2. Application
- 2.1. Refrigeration and Air Conditioning
- 2.2. Dry Cleaning
- 2.3. Metal Degreasing
- 2.4. Textile Treatment
- 2.5. Automotive Aerosols
- 2.6. Other Ap
Trichloroethylene and Perchloroethylene Industry Segmentation By Geography
-
1. Asia Pacific
- 1.1. China
- 1.2. India
- 1.3. Japan
- 1.4. South Korea
- 1.5. Rest of Asia Pacific
-
2. North America
- 2.1. United States
- 2.2. Canada
- 2.3. Mexico
-
3. Europe
- 3.1. Germany
- 3.2. United Kingdom
- 3.3. Italy
- 3.4. France
- 3.5. Rest of Europe
-
4. South America
- 4.1. Brazil
- 4.2. Argentina
- 4.3. Rest of South America
-
5. Middle East and Africa
- 5.1. Saudi Arabia
- 5.2. South Africa
- 5.3. Rest of Middle East and Africa
Trichloroethylene and Perchloroethylene Industry Regional Market Share
Geographic Coverage of Trichloroethylene and Perchloroethylene Industry
Trichloroethylene and Perchloroethylene Industry REPORT HIGHLIGHTS
| Aspects | Details |
|---|---|
| Study Period | 2020-2034 |
| Base Year | 2025 |
| Estimated Year | 2026 |
| Forecast Period | 2026-2034 |
| Historical Period | 2020-2025 |
| Growth Rate | CAGR of 3.2% from 2020-2034 |
| Segmentation |
|
Table of Contents
- 1. Introduction
- 1.1. Research Scope
- 1.2. Market Segmentation
- 1.3. Research Objective
- 1.4. Definitions and Assumptions
- 2. Executive Summary
- 2.1. Market Snapshot
- 3. Market Dynamics
- 3.1. Market Drivers
- 3.2. Market Restrains
- 3.3. Market Trends
- 3.4. Market Opportunities
- 4. Market Factor Analysis
- 4.1. Porters Five Forces
- 4.1.1. Bargaining Power of Suppliers
- 4.1.2. Bargaining Power of Buyers
- 4.1.3. Threat of New Entrants
- 4.1.4. Threat of Substitutes
- 4.1.5. Competitive Rivalry
- 4.2. PESTEL analysis
- 4.3. BCG Analysis
- 4.3.1. Stars (High Growth, High Market Share)
- 4.3.2. Cash Cows (Low Growth, High Market Share)
- 4.3.3. Question Mark (High Growth, Low Market Share)
- 4.3.4. Dogs (Low Growth, Low Market Share)
- 4.4. Ansoff Matrix Analysis
- 4.5. Supply Chain Analysis
- 4.6. Regulatory Landscape
- 4.7. Current Market Potential and Opportunity Assessment (TAM–SAM–SOM Framework)
- 4.8. VDR Analyst Note
- 4.1. Porters Five Forces
- 5. Market Analysis, Insights and Forecast 2021-2033
- 5.1. Market Analysis, Insights and Forecast - by Type
- 5.1.1. Perchloroethylene (PCE)
- 5.1.2. Trichloroethylene (TCE)
- 5.1.3. 1,1,1-Trichloroethane (TCA)
- 5.2. Market Analysis, Insights and Forecast - by Application
- 5.2.1. Refrigeration and Air Conditioning
- 5.2.2. Dry Cleaning
- 5.2.3. Metal Degreasing
- 5.2.4. Textile Treatment
- 5.2.5. Automotive Aerosols
- 5.2.6. Other Ap
- 5.3. Market Analysis, Insights and Forecast - by Region
- 5.3.1. Asia Pacific
- 5.3.2. North America
- 5.3.3. Europe
- 5.3.4. South America
- 5.3.5. Middle East and Africa
- 5.1. Market Analysis, Insights and Forecast - by Type
- 6. Global Trichloroethylene and Perchloroethylene Industry Analysis, Insights and Forecast, 2021-2033
- 6.1. Market Analysis, Insights and Forecast - by Type
- 6.1.1. Perchloroethylene (PCE)
- 6.1.2. Trichloroethylene (TCE)
- 6.1.3. 1,1,1-Trichloroethane (TCA)
- 6.2. Market Analysis, Insights and Forecast - by Application
- 6.2.1. Refrigeration and Air Conditioning
- 6.2.2. Dry Cleaning
- 6.2.3. Metal Degreasing
- 6.2.4. Textile Treatment
- 6.2.5. Automotive Aerosols
- 6.2.6. Other Ap
- 6.1. Market Analysis, Insights and Forecast - by Type
- 7. Asia Pacific Trichloroethylene and Perchloroethylene Industry Analysis, Insights and Forecast, 2021-2033
- 7.1. Market Analysis, Insights and Forecast - by Type
- 7.1.1. Perchloroethylene (PCE)
- 7.1.2. Trichloroethylene (TCE)
- 7.1.3. 1,1,1-Trichloroethane (TCA)
- 7.2. Market Analysis, Insights and Forecast - by Application
- 7.2.1. Refrigeration and Air Conditioning
- 7.2.2. Dry Cleaning
- 7.2.3. Metal Degreasing
- 7.2.4. Textile Treatment
- 7.2.5. Automotive Aerosols
- 7.2.6. Other Ap
- 7.1. Market Analysis, Insights and Forecast - by Type
- 8. North America Trichloroethylene and Perchloroethylene Industry Analysis, Insights and Forecast, 2021-2033
- 8.1. Market Analysis, Insights and Forecast - by Type
- 8.1.1. Perchloroethylene (PCE)
- 8.1.2. Trichloroethylene (TCE)
- 8.1.3. 1,1,1-Trichloroethane (TCA)
- 8.2. Market Analysis, Insights and Forecast - by Application
- 8.2.1. Refrigeration and Air Conditioning
- 8.2.2. Dry Cleaning
- 8.2.3. Metal Degreasing
- 8.2.4. Textile Treatment
- 8.2.5. Automotive Aerosols
- 8.2.6. Other Ap
- 8.1. Market Analysis, Insights and Forecast - by Type
- 9. Europe Trichloroethylene and Perchloroethylene Industry Analysis, Insights and Forecast, 2021-2033
- 9.1. Market Analysis, Insights and Forecast - by Type
- 9.1.1. Perchloroethylene (PCE)
- 9.1.2. Trichloroethylene (TCE)
- 9.1.3. 1,1,1-Trichloroethane (TCA)
- 9.2. Market Analysis, Insights and Forecast - by Application
- 9.2.1. Refrigeration and Air Conditioning
- 9.2.2. Dry Cleaning
- 9.2.3. Metal Degreasing
- 9.2.4. Textile Treatment
- 9.2.5. Automotive Aerosols
- 9.2.6. Other Ap
- 9.1. Market Analysis, Insights and Forecast - by Type
- 10. South America Trichloroethylene and Perchloroethylene Industry Analysis, Insights and Forecast, 2021-2033
- 10.1. Market Analysis, Insights and Forecast - by Type
- 10.1.1. Perchloroethylene (PCE)
- 10.1.2. Trichloroethylene (TCE)
- 10.1.3. 1,1,1-Trichloroethane (TCA)
- 10.2. Market Analysis, Insights and Forecast - by Application
- 10.2.1. Refrigeration and Air Conditioning
- 10.2.2. Dry Cleaning
- 10.2.3. Metal Degreasing
- 10.2.4. Textile Treatment
- 10.2.5. Automotive Aerosols
- 10.2.6. Other Ap
- 10.1. Market Analysis, Insights and Forecast - by Type
- 11. Middle East and Africa Trichloroethylene and Perchloroethylene Industry Analysis, Insights and Forecast, 2021-2033
- 11.1. Market Analysis, Insights and Forecast - by Type
- 11.1.1. Perchloroethylene (PCE)
- 11.1.2. Trichloroethylene (TCE)
- 11.1.3. 1,1,1-Trichloroethane (TCA)
- 11.2. Market Analysis, Insights and Forecast - by Application
- 11.2.1. Refrigeration and Air Conditioning
- 11.2.2. Dry Cleaning
- 11.2.3. Metal Degreasing
- 11.2.4. Textile Treatment
- 11.2.5. Automotive Aerosols
- 11.2.6. Other Ap
- 11.1. Market Analysis, Insights and Forecast - by Type
- 12. Competitive Analysis
- 12.1. Company Profiles
- 12.1.1 Occidental Petroleum Corporation
- 12.1.1.1. Company Overview
- 12.1.1.2. Products
- 12.1.1.3. Company Financials
- 12.1.1.4. SWOT Analysis
- 12.1.2 Westlake Chemical Corporation
- 12.1.2.1. Company Overview
- 12.1.2.2. Products
- 12.1.2.3. Company Financials
- 12.1.2.4. SWOT Analysis
- 12.1.3 Dow
- 12.1.3.1. Company Overview
- 12.1.3.2. Products
- 12.1.3.3. Company Financials
- 12.1.3.4. SWOT Analysis
- 12.1.4 Solvay
- 12.1.4.1. Company Overview
- 12.1.4.2. Products
- 12.1.4.3. Company Financials
- 12.1.4.4. SWOT Analysis
- 12.1.5 INEOS
- 12.1.5.1. Company Overview
- 12.1.5.2. Products
- 12.1.5.3. Company Financials
- 12.1.5.4. SWOT Analysis
- 12.1.6 3M
- 12.1.6.1. Company Overview
- 12.1.6.2. Products
- 12.1.6.3. Company Financials
- 12.1.6.4. SWOT Analysis
- 12.1.7 Shin-Etsu Chemica
- 12.1.7.1. Company Overview
- 12.1.7.2. Products
- 12.1.7.3. Company Financials
- 12.1.7.4. SWOT Analysis
- 12.1.8 Kem One
- 12.1.8.1. Company Overview
- 12.1.8.2. Products
- 12.1.8.3. Company Financials
- 12.1.8.4. SWOT Analysis
- 12.1.1 Occidental Petroleum Corporation
- 12.2. Market Entropy
- 12.2.1 Company's Key Areas Served
- 12.2.2 Recent Developments
- 12.3. Company Market Share Analysis 2025
- 12.3.1 Top 5 Companies Market Share Analysis
- 12.3.2 Top 3 Companies Market Share Analysis
- 12.4. List of Potential Customers
- 13. Research Methodology
List of Figures
- Figure 1: Global Trichloroethylene and Perchloroethylene Industry Revenue Breakdown (million, %) by Region 2025 & 2033
- Figure 2: Global Trichloroethylene and Perchloroethylene Industry Volume Breakdown (Kiloton, %) by Region 2025 & 2033
- Figure 3: Asia Pacific Trichloroethylene and Perchloroethylene Industry Revenue (million), by Type 2025 & 2033
- Figure 4: Asia Pacific Trichloroethylene and Perchloroethylene Industry Volume (Kiloton), by Type 2025 & 2033
- Figure 5: Asia Pacific Trichloroethylene and Perchloroethylene Industry Revenue Share (%), by Type 2025 & 2033
- Figure 6: Asia Pacific Trichloroethylene and Perchloroethylene Industry Volume Share (%), by Type 2025 & 2033
- Figure 7: Asia Pacific Trichloroethylene and Perchloroethylene Industry Revenue (million), by Application 2025 & 2033
- Figure 8: Asia Pacific Trichloroethylene and Perchloroethylene Industry Volume (Kiloton), by Application 2025 & 2033
- Figure 9: Asia Pacific Trichloroethylene and Perchloroethylene Industry Revenue Share (%), by Application 2025 & 2033
- Figure 10: Asia Pacific Trichloroethylene and Perchloroethylene Industry Volume Share (%), by Application 2025 & 2033
- Figure 11: Asia Pacific Trichloroethylene and Perchloroethylene Industry Revenue (million), by Country 2025 & 2033
- Figure 12: Asia Pacific Trichloroethylene and Perchloroethylene Industry Volume (Kiloton), by Country 2025 & 2033
- Figure 13: Asia Pacific Trichloroethylene and Perchloroethylene Industry Revenue Share (%), by Country 2025 & 2033
- Figure 14: Asia Pacific Trichloroethylene and Perchloroethylene Industry Volume Share (%), by Country 2025 & 2033
- Figure 15: North America Trichloroethylene and Perchloroethylene Industry Revenue (million), by Type 2025 & 2033
- Figure 16: North America Trichloroethylene and Perchloroethylene Industry Volume (Kiloton), by Type 2025 & 2033
- Figure 17: North America Trichloroethylene and Perchloroethylene Industry Revenue Share (%), by Type 2025 & 2033
- Figure 18: North America Trichloroethylene and Perchloroethylene Industry Volume Share (%), by Type 2025 & 2033
- Figure 19: North America Trichloroethylene and Perchloroethylene Industry Revenue (million), by Application 2025 & 2033
- Figure 20: North America Trichloroethylene and Perchloroethylene Industry Volume (Kiloton), by Application 2025 & 2033
- Figure 21: North America Trichloroethylene and Perchloroethylene Industry Revenue Share (%), by Application 2025 & 2033
- Figure 22: North America Trichloroethylene and Perchloroethylene Industry Volume Share (%), by Application 2025 & 2033
- Figure 23: North America Trichloroethylene and Perchloroethylene Industry Revenue (million), by Country 2025 & 2033
- Figure 24: North America Trichloroethylene and Perchloroethylene Industry Volume (Kiloton), by Country 2025 & 2033
- Figure 25: North America Trichloroethylene and Perchloroethylene Industry Revenue Share (%), by Country 2025 & 2033
- Figure 26: North America Trichloroethylene and Perchloroethylene Industry Volume Share (%), by Country 2025 & 2033
- Figure 27: Europe Trichloroethylene and Perchloroethylene Industry Revenue (million), by Type 2025 & 2033
- Figure 28: Europe Trichloroethylene and Perchloroethylene Industry Volume (Kiloton), by Type 2025 & 2033
- Figure 29: Europe Trichloroethylene and Perchloroethylene Industry Revenue Share (%), by Type 2025 & 2033
- Figure 30: Europe Trichloroethylene and Perchloroethylene Industry Volume Share (%), by Type 2025 & 2033
- Figure 31: Europe Trichloroethylene and Perchloroethylene Industry Revenue (million), by Application 2025 & 2033
- Figure 32: Europe Trichloroethylene and Perchloroethylene Industry Volume (Kiloton), by Application 2025 & 2033
- Figure 33: Europe Trichloroethylene and Perchloroethylene Industry Revenue Share (%), by Application 2025 & 2033
- Figure 34: Europe Trichloroethylene and Perchloroethylene Industry Volume Share (%), by Application 2025 & 2033
- Figure 35: Europe Trichloroethylene and Perchloroethylene Industry Revenue (million), by Country 2025 & 2033
- Figure 36: Europe Trichloroethylene and Perchloroethylene Industry Volume (Kiloton), by Country 2025 & 2033
- Figure 37: Europe Trichloroethylene and Perchloroethylene Industry Revenue Share (%), by Country 2025 & 2033
- Figure 38: Europe Trichloroethylene and Perchloroethylene Industry Volume Share (%), by Country 2025 & 2033
- Figure 39: South America Trichloroethylene and Perchloroethylene Industry Revenue (million), by Type 2025 & 2033
- Figure 40: South America Trichloroethylene and Perchloroethylene Industry Volume (Kiloton), by Type 2025 & 2033
- Figure 41: South America Trichloroethylene and Perchloroethylene Industry Revenue Share (%), by Type 2025 & 2033
- Figure 42: South America Trichloroethylene and Perchloroethylene Industry Volume Share (%), by Type 2025 & 2033
- Figure 43: South America Trichloroethylene and Perchloroethylene Industry Revenue (million), by Application 2025 & 2033
- Figure 44: South America Trichloroethylene and Perchloroethylene Industry Volume (Kiloton), by Application 2025 & 2033
- Figure 45: South America Trichloroethylene and Perchloroethylene Industry Revenue Share (%), by Application 2025 & 2033
- Figure 46: South America Trichloroethylene and Perchloroethylene Industry Volume Share (%), by Application 2025 & 2033
- Figure 47: South America Trichloroethylene and Perchloroethylene Industry Revenue (million), by Country 2025 & 2033
- Figure 48: South America Trichloroethylene and Perchloroethylene Industry Volume (Kiloton), by Country 2025 & 2033
- Figure 49: South America Trichloroethylene and Perchloroethylene Industry Revenue Share (%), by Country 2025 & 2033
- Figure 50: South America Trichloroethylene and Perchloroethylene Industry Volume Share (%), by Country 2025 & 2033
- Figure 51: Middle East and Africa Trichloroethylene and Perchloroethylene Industry Revenue (million), by Type 2025 & 2033
- Figure 52: Middle East and Africa Trichloroethylene and Perchloroethylene Industry Volume (Kiloton), by Type 2025 & 2033
- Figure 53: Middle East and Africa Trichloroethylene and Perchloroethylene Industry Revenue Share (%), by Type 2025 & 2033
- Figure 54: Middle East and Africa Trichloroethylene and Perchloroethylene Industry Volume Share (%), by Type 2025 & 2033
- Figure 55: Middle East and Africa Trichloroethylene and Perchloroethylene Industry Revenue (million), by Application 2025 & 2033
- Figure 56: Middle East and Africa Trichloroethylene and Perchloroethylene Industry Volume (Kiloton), by Application 2025 & 2033
- Figure 57: Middle East and Africa Trichloroethylene and Perchloroethylene Industry Revenue Share (%), by Application 2025 & 2033
- Figure 58: Middle East and Africa Trichloroethylene and Perchloroethylene Industry Volume Share (%), by Application 2025 & 2033
- Figure 59: Middle East and Africa Trichloroethylene and Perchloroethylene Industry Revenue (million), by Country 2025 & 2033
- Figure 60: Middle East and Africa Trichloroethylene and Perchloroethylene Industry Volume (Kiloton), by Country 2025 & 2033
- Figure 61: Middle East and Africa Trichloroethylene and Perchloroethylene Industry Revenue Share (%), by Country 2025 & 2033
- Figure 62: Middle East and Africa Trichloroethylene and Perchloroethylene Industry Volume Share (%), by Country 2025 & 2033
List of Tables
- Table 1: Global Trichloroethylene and Perchloroethylene Industry Revenue million Forecast, by Type 2020 & 2033
- Table 2: Global Trichloroethylene and Perchloroethylene Industry Volume Kiloton Forecast, by Type 2020 & 2033
- Table 3: Global Trichloroethylene and Perchloroethylene Industry Revenue million Forecast, by Application 2020 & 2033
- Table 4: Global Trichloroethylene and Perchloroethylene Industry Volume Kiloton Forecast, by Application 2020 & 2033
- Table 5: Global Trichloroethylene and Perchloroethylene Industry Revenue million Forecast, by Region 2020 & 2033
- Table 6: Global Trichloroethylene and Perchloroethylene Industry Volume Kiloton Forecast, by Region 2020 & 2033
- Table 7: Global Trichloroethylene and Perchloroethylene Industry Revenue million Forecast, by Type 2020 & 2033
- Table 8: Global Trichloroethylene and Perchloroethylene Industry Volume Kiloton Forecast, by Type 2020 & 2033
- Table 9: Global Trichloroethylene and Perchloroethylene Industry Revenue million Forecast, by Application 2020 & 2033
- Table 10: Global Trichloroethylene and Perchloroethylene Industry Volume Kiloton Forecast, by Application 2020 & 2033
- Table 11: Global Trichloroethylene and Perchloroethylene Industry Revenue million Forecast, by Country 2020 & 2033
- Table 12: Global Trichloroethylene and Perchloroethylene Industry Volume Kiloton Forecast, by Country 2020 & 2033
- Table 13: China Trichloroethylene and Perchloroethylene Industry Revenue (million) Forecast, by Application 2020 & 2033
- Table 14: China Trichloroethylene and Perchloroethylene Industry Volume (Kiloton) Forecast, by Application 2020 & 2033
- Table 15: India Trichloroethylene and Perchloroethylene Industry Revenue (million) Forecast, by Application 2020 & 2033
- Table 16: India Trichloroethylene and Perchloroethylene Industry Volume (Kiloton) Forecast, by Application 2020 & 2033
- Table 17: Japan Trichloroethylene and Perchloroethylene Industry Revenue (million) Forecast, by Application 2020 & 2033
- Table 18: Japan Trichloroethylene and Perchloroethylene Industry Volume (Kiloton) Forecast, by Application 2020 & 2033
- Table 19: South Korea Trichloroethylene and Perchloroethylene Industry Revenue (million) Forecast, by Application 2020 & 2033
- Table 20: South Korea Trichloroethylene and Perchloroethylene Industry Volume (Kiloton) Forecast, by Application 2020 & 2033
- Table 21: Rest of Asia Pacific Trichloroethylene and Perchloroethylene Industry Revenue (million) Forecast, by Application 2020 & 2033
- Table 22: Rest of Asia Pacific Trichloroethylene and Perchloroethylene Industry Volume (Kiloton) Forecast, by Application 2020 & 2033
- Table 23: Global Trichloroethylene and Perchloroethylene Industry Revenue million Forecast, by Type 2020 & 2033
- Table 24: Global Trichloroethylene and Perchloroethylene Industry Volume Kiloton Forecast, by Type 2020 & 2033
- Table 25: Global Trichloroethylene and Perchloroethylene Industry Revenue million Forecast, by Application 2020 & 2033
- Table 26: Global Trichloroethylene and Perchloroethylene Industry Volume Kiloton Forecast, by Application 2020 & 2033
- Table 27: Global Trichloroethylene and Perchloroethylene Industry Revenue million Forecast, by Country 2020 & 2033
- Table 28: Global Trichloroethylene and Perchloroethylene Industry Volume Kiloton Forecast, by Country 2020 & 2033
- Table 29: United States Trichloroethylene and Perchloroethylene Industry Revenue (million) Forecast, by Application 2020 & 2033
- Table 30: United States Trichloroethylene and Perchloroethylene Industry Volume (Kiloton) Forecast, by Application 2020 & 2033
- Table 31: Canada Trichloroethylene and Perchloroethylene Industry Revenue (million) Forecast, by Application 2020 & 2033
- Table 32: Canada Trichloroethylene and Perchloroethylene Industry Volume (Kiloton) Forecast, by Application 2020 & 2033
- Table 33: Mexico Trichloroethylene and Perchloroethylene Industry Revenue (million) Forecast, by Application 2020 & 2033
- Table 34: Mexico Trichloroethylene and Perchloroethylene Industry Volume (Kiloton) Forecast, by Application 2020 & 2033
- Table 35: Global Trichloroethylene and Perchloroethylene Industry Revenue million Forecast, by Type 2020 & 2033
- Table 36: Global Trichloroethylene and Perchloroethylene Industry Volume Kiloton Forecast, by Type 2020 & 2033
- Table 37: Global Trichloroethylene and Perchloroethylene Industry Revenue million Forecast, by Application 2020 & 2033
- Table 38: Global Trichloroethylene and Perchloroethylene Industry Volume Kiloton Forecast, by Application 2020 & 2033
- Table 39: Global Trichloroethylene and Perchloroethylene Industry Revenue million Forecast, by Country 2020 & 2033
- Table 40: Global Trichloroethylene and Perchloroethylene Industry Volume Kiloton Forecast, by Country 2020 & 2033
- Table 41: Germany Trichloroethylene and Perchloroethylene Industry Revenue (million) Forecast, by Application 2020 & 2033
- Table 42: Germany Trichloroethylene and Perchloroethylene Industry Volume (Kiloton) Forecast, by Application 2020 & 2033
- Table 43: United Kingdom Trichloroethylene and Perchloroethylene Industry Revenue (million) Forecast, by Application 2020 & 2033
- Table 44: United Kingdom Trichloroethylene and Perchloroethylene Industry Volume (Kiloton) Forecast, by Application 2020 & 2033
- Table 45: Italy Trichloroethylene and Perchloroethylene Industry Revenue (million) Forecast, by Application 2020 & 2033
- Table 46: Italy Trichloroethylene and Perchloroethylene Industry Volume (Kiloton) Forecast, by Application 2020 & 2033
- Table 47: France Trichloroethylene and Perchloroethylene Industry Revenue (million) Forecast, by Application 2020 & 2033
- Table 48: France Trichloroethylene and Perchloroethylene Industry Volume (Kiloton) Forecast, by Application 2020 & 2033
- Table 49: Rest of Europe Trichloroethylene and Perchloroethylene Industry Revenue (million) Forecast, by Application 2020 & 2033
- Table 50: Rest of Europe Trichloroethylene and Perchloroethylene Industry Volume (Kiloton) Forecast, by Application 2020 & 2033
- Table 51: Global Trichloroethylene and Perchloroethylene Industry Revenue million Forecast, by Type 2020 & 2033
- Table 52: Global Trichloroethylene and Perchloroethylene Industry Volume Kiloton Forecast, by Type 2020 & 2033
- Table 53: Global Trichloroethylene and Perchloroethylene Industry Revenue million Forecast, by Application 2020 & 2033
- Table 54: Global Trichloroethylene and Perchloroethylene Industry Volume Kiloton Forecast, by Application 2020 & 2033
- Table 55: Global Trichloroethylene and Perchloroethylene Industry Revenue million Forecast, by Country 2020 & 2033
- Table 56: Global Trichloroethylene and Perchloroethylene Industry Volume Kiloton Forecast, by Country 2020 & 2033
- Table 57: Brazil Trichloroethylene and Perchloroethylene Industry Revenue (million) Forecast, by Application 2020 & 2033
- Table 58: Brazil Trichloroethylene and Perchloroethylene Industry Volume (Kiloton) Forecast, by Application 2020 & 2033
- Table 59: Argentina Trichloroethylene and Perchloroethylene Industry Revenue (million) Forecast, by Application 2020 & 2033
- Table 60: Argentina Trichloroethylene and Perchloroethylene Industry Volume (Kiloton) Forecast, by Application 2020 & 2033
- Table 61: Rest of South America Trichloroethylene and Perchloroethylene Industry Revenue (million) Forecast, by Application 2020 & 2033
- Table 62: Rest of South America Trichloroethylene and Perchloroethylene Industry Volume (Kiloton) Forecast, by Application 2020 & 2033
- Table 63: Global Trichloroethylene and Perchloroethylene Industry Revenue million Forecast, by Type 2020 & 2033
- Table 64: Global Trichloroethylene and Perchloroethylene Industry Volume Kiloton Forecast, by Type 2020 & 2033
- Table 65: Global Trichloroethylene and Perchloroethylene Industry Revenue million Forecast, by Application 2020 & 2033
- Table 66: Global Trichloroethylene and Perchloroethylene Industry Volume Kiloton Forecast, by Application 2020 & 2033
- Table 67: Global Trichloroethylene and Perchloroethylene Industry Revenue million Forecast, by Country 2020 & 2033
- Table 68: Global Trichloroethylene and Perchloroethylene Industry Volume Kiloton Forecast, by Country 2020 & 2033
- Table 69: Saudi Arabia Trichloroethylene and Perchloroethylene Industry Revenue (million) Forecast, by Application 2020 & 2033
- Table 70: Saudi Arabia Trichloroethylene and Perchloroethylene Industry Volume (Kiloton) Forecast, by Application 2020 & 2033
- Table 71: South Africa Trichloroethylene and Perchloroethylene Industry Revenue (million) Forecast, by Application 2020 & 2033
- Table 72: South Africa Trichloroethylene and Perchloroethylene Industry Volume (Kiloton) Forecast, by Application 2020 & 2033
- Table 73: Rest of Middle East and Africa Trichloroethylene and Perchloroethylene Industry Revenue (million) Forecast, by Application 2020 & 2033
- Table 74: Rest of Middle East and Africa Trichloroethylene and Perchloroethylene Industry Volume (Kiloton) Forecast, by Application 2020 & 2033
Frequently Asked Questions
1. What is the projected Compound Annual Growth Rate (CAGR) of the Trichloroethylene and Perchloroethylene Industry?
The projected CAGR is approximately 3.2%.
2. Which companies are prominent players in the Trichloroethylene and Perchloroethylene Industry?
Key companies in the market include Occidental Petroleum Corporation, Westlake Chemical Corporation, Dow, Solvay, INEOS, 3M, Shin-Etsu Chemica, Kem One.
3. What are the main segments of the Trichloroethylene and Perchloroethylene Industry?
The market segments include Type, Application.
4. Can you provide details about the market size?
The market size is estimated to be USD 452.01 million as of 2022.
5. What are some drivers contributing to market growth?
Increasing Demand for Trichloroethylene (TCE) for Degreasing Applications; Other Drivers.
6. What are the notable trends driving market growth?
Perchloroethylene is Expected to Dominate the Market.
7. Are there any restraints impacting market growth?
Implementation of Montreal Protocol and Kyoto Protocol; Stringent Government Regulations Concerning Perchloroethylene Use.
8. Can you provide examples of recent developments in the market?
N/A
9. What pricing options are available for accessing the report?
Pricing options include single-user, multi-user, and enterprise licenses priced at USD 4750, USD 5250, and USD 8750 respectively.
10. Is the market size provided in terms of value or volume?
The market size is provided in terms of value, measured in million and volume, measured in Kiloton.
11. Are there any specific market keywords associated with the report?
Yes, the market keyword associated with the report is "Trichloroethylene and Perchloroethylene Industry," which aids in identifying and referencing the specific market segment covered.
12. How do I determine which pricing option suits my needs best?
The pricing options vary based on user requirements and access needs. Individual users may opt for single-user licenses, while businesses requiring broader access may choose multi-user or enterprise licenses for cost-effective access to the report.
13. Are there any additional resources or data provided in the Trichloroethylene and Perchloroethylene Industry report?
While the report offers comprehensive insights, it's advisable to review the specific contents or supplementary materials provided to ascertain if additional resources or data are available.
14. How can I stay updated on further developments or reports in the Trichloroethylene and Perchloroethylene Industry?
To stay informed about further developments, trends, and reports in the Trichloroethylene and Perchloroethylene Industry, consider subscribing to industry newsletters, following relevant companies and organizations, or regularly checking reputable industry news sources and publications.
Methodology
Step 1 - Identification of Relevant Samples Size from Population Database


Step 2 - Approaches for Defining Global Market Size (Value, Volume* & Price*)

Note*: In applicable scenarios
Step 3 - Data Sources
Primary Research
- Web Analytics
- Survey Reports
- Research Institute
- Latest Research Reports
- Opinion Leaders
Secondary Research
- Annual Reports
- White Paper
- Latest Press Release
- Industry Association
- Paid Database
- Investor Presentations

Step 4 - Data Triangulation
Involves using different sources of information in order to increase the validity of a study
These sources are likely to be stakeholders in a program - participants, other researchers, program staff, other community members, and so on.
Then we put all data in single framework & apply various statistical tools to find out the dynamic on the market.
During the analysis stage, feedback from the stakeholder groups would be compared to determine areas of agreement as well as areas of divergence