

Key Insights
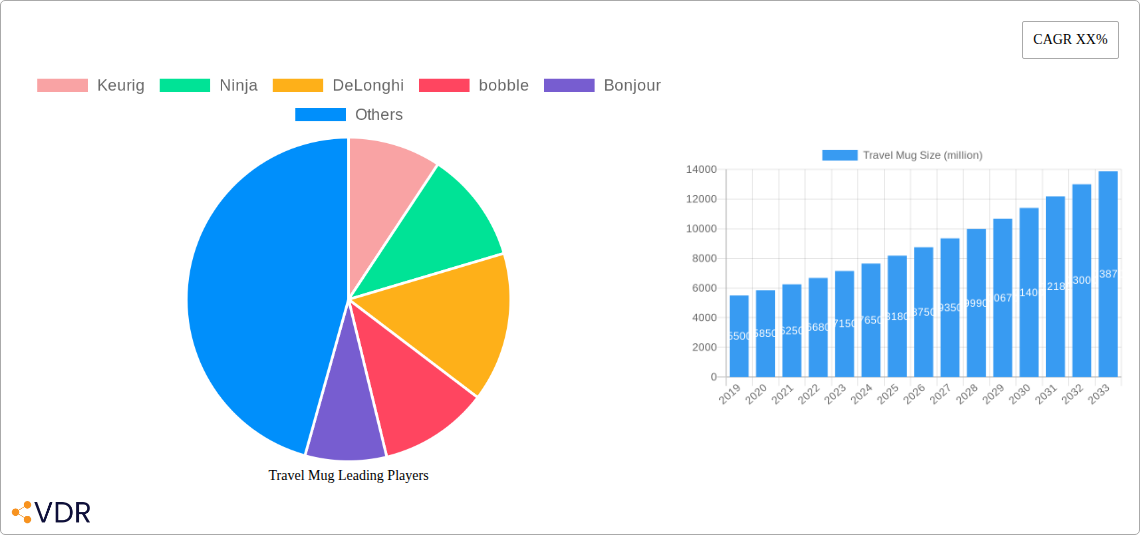
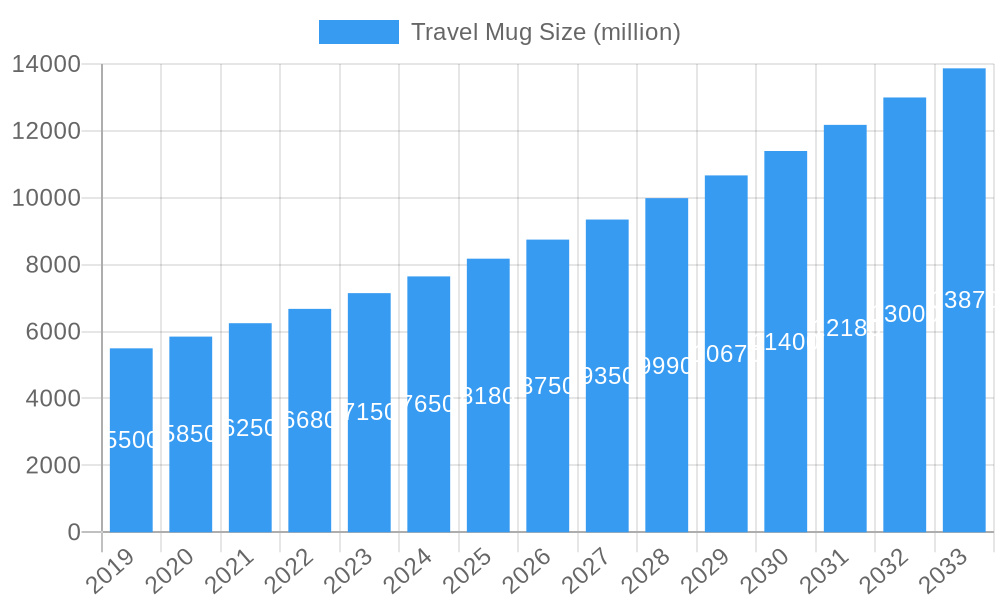
The global travel mug market is projected for substantial growth, reaching an estimated market size of $14.32 billion by 2025. This expansion is driven by a Compound Annual Growth Rate (CAGR) of approximately 7.48% from 2019 to 2033. Key growth factors include the increasing adoption of on-the-go lifestyles, a heightened consumer focus on sustainability and waste reduction, and advancements in materials and design leading to enhanced performance and durability. Market expansion is further supported by personalization trends and the convenience of online sales channels.
Travel Mug Market Size (In Billion)
Challenges for the market include the initial cost of premium products, which may deter price-sensitive consumers, and intense competition among manufacturers. The market is segmented by sales channel, with online sales currently dominating. Stainless steel travel mugs are expected to lead in product type due to their superior insulation and durability. Key industry players are actively pursuing innovation and portfolio expansion to gain market share. Geographically, the Asia Pacific region is poised for the fastest growth, while North America and Europe represent mature markets with a strong demand for premium and eco-friendly options.
Travel Mug Company Market Share
This report offers a comprehensive analysis of the global travel mug market, encompassing market dynamics, growth trends, regional performance, product segmentation, competitive landscape, and future projections. The study covers the period from 2019 to 2033, with a base year of 2025 and a forecast period of 2025–2033. Analysis includes segments such as Application (Online Sales, Offline Sales) and Types (Stainless Steel Travel Mug, Ceramic Travel Mug, Plastic Travel Mug, Other). Key companies including Keurig, Ninja, DeLonghi, bobble, Bonjour, Cake Boss, Caribou Coffee, Contigo, Disney, Ignite, Primula, and Zojirushi are examined.
Travel Mug Market Dynamics & Structure
The global Travel Mug market is characterized by moderate to high concentration, with key players like Contigo and Zojirushi holding significant market shares. Technological innovation, particularly in insulation materials and leak-proof designs, is a primary driver, fostering product differentiation and premiumization. Regulatory frameworks primarily focus on material safety and environmental standards, impacting manufacturing processes and product certifications. Competitive product substitutes, such as reusable tumblers and portable drinkware, offer consumers a range of choices, influencing demand for specialized travel mugs. End-user demographics are broad, encompassing students, professionals, travelers, and outdoor enthusiasts, each with distinct preferences for functionality, aesthetics, and brand loyalty. Mergers and acquisitions (M&A) trends indicate strategic consolidation to enhance market reach and product portfolios. For instance, the acquisition of smaller innovative brands by larger corporations aims to capture niche markets and accelerate product development. The market witnessed approximately 5-7 significant M&A deals within the historical period 2019-2024. Barriers to innovation include the high cost of advanced material research and development and lengthy product testing cycles.
Travel Mug Growth Trends & Insights
The Travel Mug market has experienced consistent growth, driven by increasing consumer preference for portable and eco-friendly beverage solutions. The market size is projected to reach approximately $5.5 billion by 2025, exhibiting a Compound Annual Growth Rate (CAGR) of around 6.2% from 2019 to 2033. Adoption rates are high across developed and developing economies, fueled by busy lifestyles and a growing awareness of the environmental impact of single-use coffee cups. Technological disruptions, such as advanced vacuum insulation and smart features like temperature control, are enhancing product utility and creating new market segments. Consumer behavior shifts indicate a growing demand for durable, aesthetically pleasing, and personalized travel mugs. The convenience of carrying hot or cold beverages on the go, coupled with the rising popularity of coffee culture and ready-to-drink beverages, further propels market expansion. The increasing disposable income and a strong emphasis on sustainable living are also significant contributing factors to the robust growth trajectory. Market penetration is estimated to be around 45% in key urban centers.
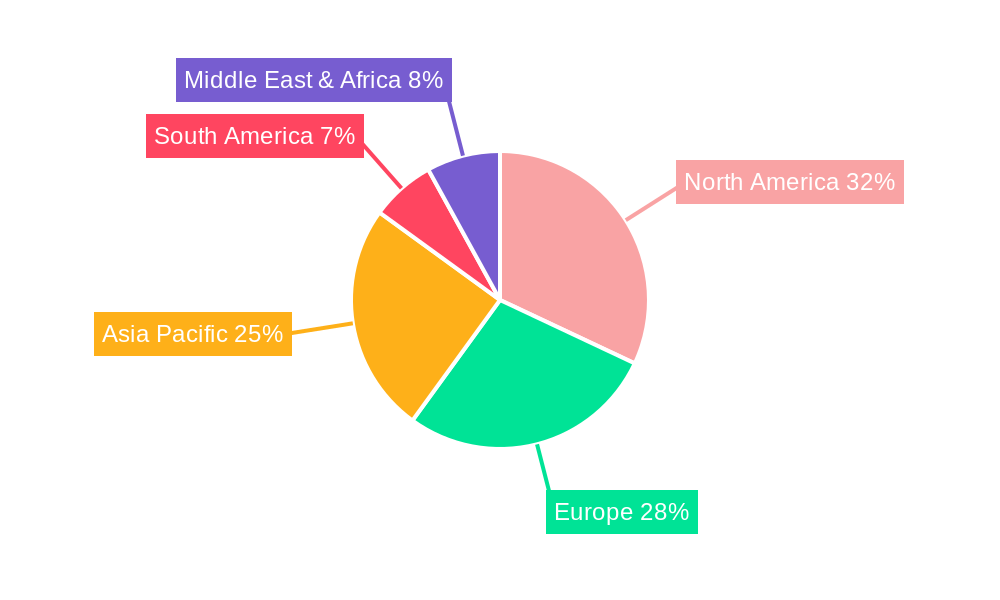
Dominant Regions, Countries, or Segments in Travel Mug
North America currently dominates the Travel Mug market, driven by a well-established coffee culture, high disposable incomes, and a strong consumer inclination towards convenience and sustainability. The United States, in particular, represents a significant market share, with a high adoption rate of travel mugs across various demographic segments. Online Sales is the leading application segment, accounting for approximately 55% of the total market revenue, facilitated by robust e-commerce infrastructure and the accessibility of a wide range of brands and products. Stainless Steel Travel Mugs represent the largest product type segment, capturing around 60% of the market, owing to their durability, superior insulation properties, and resistance to corrosion. Key drivers for dominance include supportive government initiatives promoting reusable products, extensive retail distribution networks, and a significant presence of leading manufacturers. For example, the US government's focus on reducing plastic waste has indirectly boosted the demand for reusable travel mugs. Europe, with its strong environmental consciousness and growing café culture, is the second-largest regional market. Asia-Pacific is emerging as a high-growth region, propelled by rapid urbanization, increasing disposable incomes, and a growing adoption of Western lifestyle trends, including coffee consumption and portable drinkware. The market share of Stainless Steel Travel Mugs in North America is approximately 65%, followed by Europe at 58%.
Travel Mug Product Landscape
The Travel Mug product landscape is characterized by continuous innovation focused on enhancing user experience and functionality. Advancements in vacuum insulation technology have led to travel mugs capable of maintaining beverage temperatures for up to 24 hours. Leak-proof lids with secure locking mechanisms are a standard feature, ensuring portability without spillage. Design innovation is also prevalent, with manufacturers offering a variety of colors, finishes, and customization options to appeal to diverse consumer preferences. Smart travel mugs incorporating temperature display or control features are emerging as a niche segment, catering to tech-savvy consumers. Performance metrics such as insulation duration, durability, and ease of cleaning are key differentiators.
Key Drivers, Barriers & Challenges in Travel Mug
The primary forces propelling the Travel Mug market include the increasing demand for convenience, the growing global coffee and tea culture, and rising environmental consciousness, leading to a preference for reusable alternatives over disposable cups. Technological advancements in material science and product design, such as improved insulation and leak-proof features, further drive adoption. Economic factors like rising disposable incomes and the widespread availability of online sales channels also contribute to market growth.
Key challenges and restraints include intense market competition, leading to price sensitivity and pressure on profit margins. Supply chain disruptions, particularly those related to raw material availability and logistics, can impact production and costs, with an estimated 10-15% impact on costs during peak disruptions. Regulatory hurdles, although generally favorable for reusable products, can add complexity to international trade and product compliance. The presence of lower-priced generic alternatives also poses a challenge to premium product segments.
Emerging Opportunities in Travel Mug
Emerging opportunities in the Travel Mug sector lie in the development of smart travel mugs with integrated technology for temperature control and beverage tracking. The growing trend of personalization and customization presents a significant avenue for manufacturers to offer unique products. Untapped markets in developing economies, with increasing urbanization and adoption of Western lifestyles, offer substantial growth potential. Furthermore, the demand for sustainable and ethically sourced materials creates opportunities for eco-friendly product lines.
Growth Accelerators in the Travel Mug Industry
Catalysts driving long-term growth in the Travel Mug industry include technological breakthroughs in insulation materials and ergonomic designs, leading to superior product performance. Strategic partnerships between beverage brands and travel mug manufacturers for co-branded products can expand market reach and consumer engagement. Market expansion strategies targeting emerging economies and specific demographic groups with tailored product offerings will further accelerate growth. The increasing focus on health and wellness also promotes the use of reusable containers for homemade beverages.
Key Players Shaping the Travel Mug Market
- Keurig
- Ninja
- DeLonghi
- bobble
- Bonjour
- Cake Boss
- Caribou Coffee
- Contigo
- Disney
- Ignite
- Primula
- Zojirushi
Notable Milestones in Travel Mug Sector
- 2019: Launch of advanced vacuum insulation technology by Zojirushi, significantly extending temperature retention capabilities.
- 2020: Contigo's expansion into new international markets, driven by growing global demand for leak-proof travel mugs.
- 2021: Introduction of smart temperature-controlled travel mugs by select brands, catering to a niche tech-savvy consumer base.
- 2022: Increased focus on sustainable materials and recycled content in product manufacturing across leading companies.
- 2023: Significant growth in online sales channels for travel mugs, with e-commerce platforms becoming a dominant distribution strategy.
- 2024: Mergers and acquisitions aimed at consolidating market share and expanding product portfolios in the reusable drinkware sector.
In-Depth Travel Mug Market Outlook
The future of the Travel Mug market is exceptionally promising, driven by sustained global trends towards convenience, personalization, and environmental responsibility. Growth accelerators, including advancements in smart technology, sustainable material innovations, and strategic market expansion into emerging economies, will continue to fuel demand. The increasing adoption of coffee culture worldwide and the ongoing shift away from single-use plastics present robust opportunities for market penetration. Strategic partnerships and a focus on catering to evolving consumer preferences for both functionality and aesthetics will be crucial for sustained success. The market is poised for continued expansion, offering significant potential for stakeholders to capitalize on these burgeoning trends.
Travel Mug Segmentation
-
1. Application
- 1.1. Online Sales
- 1.2. Offline Sales
-
2. Types
- 2.1. Stainless Steel Travel Mug
- 2.2. Ceramic Travel Mug
- 2.3. Plastic Travel Mug
- 2.4. Other
Travel Mug Segmentation By Geography
-
1. North America
- 1.1. United States
- 1.2. Canada
- 1.3. Mexico
-
2. South America
- 2.1. Brazil
- 2.2. Argentina
- 2.3. Rest of South America
-
3. Europe
- 3.1. United Kingdom
- 3.2. Germany
- 3.3. France
- 3.4. Italy
- 3.5. Spain
- 3.6. Russia
- 3.7. Benelux
- 3.8. Nordics
- 3.9. Rest of Europe
-
4. Middle East & Africa
- 4.1. Turkey
- 4.2. Israel
- 4.3. GCC
- 4.4. North Africa
- 4.5. South Africa
- 4.6. Rest of Middle East & Africa
-
5. Asia Pacific
- 5.1. China
- 5.2. India
- 5.3. Japan
- 5.4. South Korea
- 5.5. ASEAN
- 5.6. Oceania
- 5.7. Rest of Asia Pacific
Travel Mug Regional Market Share
Geographic Coverage of Travel Mug
Travel Mug REPORT HIGHLIGHTS
| Aspects | Details |
|---|---|
| Study Period | 2020-2034 |
| Base Year | 2025 |
| Estimated Year | 2026 |
| Forecast Period | 2026-2034 |
| Historical Period | 2020-2025 |
| Growth Rate | CAGR of 7.48% from 2020-2034 |
| Segmentation |
|
Table of Contents
- 1. Introduction
- 1.1. Research Scope
- 1.2. Market Segmentation
- 1.3. Research Objective
- 1.4. Definitions and Assumptions
- 2. Executive Summary
- 2.1. Market Snapshot
- 3. Market Dynamics
- 3.1. Market Drivers
- 3.2. Market Restrains
- 3.3. Market Trends
- 3.4. Market Opportunities
- 4. Market Factor Analysis
- 4.1. Porters Five Forces
- 4.1.1. Bargaining Power of Suppliers
- 4.1.2. Bargaining Power of Buyers
- 4.1.3. Threat of New Entrants
- 4.1.4. Threat of Substitutes
- 4.1.5. Competitive Rivalry
- 4.2. PESTEL analysis
- 4.3. BCG Analysis
- 4.3.1. Stars (High Growth, High Market Share)
- 4.3.2. Cash Cows (Low Growth, High Market Share)
- 4.3.3. Question Mark (High Growth, Low Market Share)
- 4.3.4. Dogs (Low Growth, Low Market Share)
- 4.4. Ansoff Matrix Analysis
- 4.5. Supply Chain Analysis
- 4.6. Regulatory Landscape
- 4.7. Current Market Potential and Opportunity Assessment (TAM–SAM–SOM Framework)
- 4.8. VDR Analyst Note
- 4.1. Porters Five Forces
- 5. Market Analysis, Insights and Forecast 2021-2033
- 5.1. Market Analysis, Insights and Forecast - by Application
- 5.1.1. Online Sales
- 5.1.2. Offline Sales
- 5.2. Market Analysis, Insights and Forecast - by Types
- 5.2.1. Stainless Steel Travel Mug
- 5.2.2. Ceramic Travel Mug
- 5.2.3. Plastic Travel Mug
- 5.2.4. Other
- 5.3. Market Analysis, Insights and Forecast - by Region
- 5.3.1. North America
- 5.3.2. South America
- 5.3.3. Europe
- 5.3.4. Middle East & Africa
- 5.3.5. Asia Pacific
- 5.1. Market Analysis, Insights and Forecast - by Application
- 6. Global Travel Mug Analysis, Insights and Forecast, 2021-2033
- 6.1. Market Analysis, Insights and Forecast - by Application
- 6.1.1. Online Sales
- 6.1.2. Offline Sales
- 6.2. Market Analysis, Insights and Forecast - by Types
- 6.2.1. Stainless Steel Travel Mug
- 6.2.2. Ceramic Travel Mug
- 6.2.3. Plastic Travel Mug
- 6.2.4. Other
- 6.1. Market Analysis, Insights and Forecast - by Application
- 7. North America Travel Mug Analysis, Insights and Forecast, 2021-2033
- 7.1. Market Analysis, Insights and Forecast - by Application
- 7.1.1. Online Sales
- 7.1.2. Offline Sales
- 7.2. Market Analysis, Insights and Forecast - by Types
- 7.2.1. Stainless Steel Travel Mug
- 7.2.2. Ceramic Travel Mug
- 7.2.3. Plastic Travel Mug
- 7.2.4. Other
- 7.1. Market Analysis, Insights and Forecast - by Application
- 8. South America Travel Mug Analysis, Insights and Forecast, 2021-2033
- 8.1. Market Analysis, Insights and Forecast - by Application
- 8.1.1. Online Sales
- 8.1.2. Offline Sales
- 8.2. Market Analysis, Insights and Forecast - by Types
- 8.2.1. Stainless Steel Travel Mug
- 8.2.2. Ceramic Travel Mug
- 8.2.3. Plastic Travel Mug
- 8.2.4. Other
- 8.1. Market Analysis, Insights and Forecast - by Application
- 9. Europe Travel Mug Analysis, Insights and Forecast, 2021-2033
- 9.1. Market Analysis, Insights and Forecast - by Application
- 9.1.1. Online Sales
- 9.1.2. Offline Sales
- 9.2. Market Analysis, Insights and Forecast - by Types
- 9.2.1. Stainless Steel Travel Mug
- 9.2.2. Ceramic Travel Mug
- 9.2.3. Plastic Travel Mug
- 9.2.4. Other
- 9.1. Market Analysis, Insights and Forecast - by Application
- 10. Middle East & Africa Travel Mug Analysis, Insights and Forecast, 2021-2033
- 10.1. Market Analysis, Insights and Forecast - by Application
- 10.1.1. Online Sales
- 10.1.2. Offline Sales
- 10.2. Market Analysis, Insights and Forecast - by Types
- 10.2.1. Stainless Steel Travel Mug
- 10.2.2. Ceramic Travel Mug
- 10.2.3. Plastic Travel Mug
- 10.2.4. Other
- 10.1. Market Analysis, Insights and Forecast - by Application
- 11. Asia Pacific Travel Mug Analysis, Insights and Forecast, 2021-2033
- 11.1. Market Analysis, Insights and Forecast - by Application
- 11.1.1. Online Sales
- 11.1.2. Offline Sales
- 11.2. Market Analysis, Insights and Forecast - by Types
- 11.2.1. Stainless Steel Travel Mug
- 11.2.2. Ceramic Travel Mug
- 11.2.3. Plastic Travel Mug
- 11.2.4. Other
- 11.1. Market Analysis, Insights and Forecast - by Application
- 12. Competitive Analysis
- 12.1. Company Profiles
- 12.1.1 Keurig
- 12.1.1.1. Company Overview
- 12.1.1.2. Products
- 12.1.1.3. Company Financials
- 12.1.1.4. SWOT Analysis
- 12.1.2 Ninja
- 12.1.2.1. Company Overview
- 12.1.2.2. Products
- 12.1.2.3. Company Financials
- 12.1.2.4. SWOT Analysis
- 12.1.3 DeLonghi
- 12.1.3.1. Company Overview
- 12.1.3.2. Products
- 12.1.3.3. Company Financials
- 12.1.3.4. SWOT Analysis
- 12.1.4 bobble
- 12.1.4.1. Company Overview
- 12.1.4.2. Products
- 12.1.4.3. Company Financials
- 12.1.4.4. SWOT Analysis
- 12.1.5 Bonjour
- 12.1.5.1. Company Overview
- 12.1.5.2. Products
- 12.1.5.3. Company Financials
- 12.1.5.4. SWOT Analysis
- 12.1.6 Cake Boss
- 12.1.6.1. Company Overview
- 12.1.6.2. Products
- 12.1.6.3. Company Financials
- 12.1.6.4. SWOT Analysis
- 12.1.7 Caribou Coffee
- 12.1.7.1. Company Overview
- 12.1.7.2. Products
- 12.1.7.3. Company Financials
- 12.1.7.4. SWOT Analysis
- 12.1.8 Contigo
- 12.1.8.1. Company Overview
- 12.1.8.2. Products
- 12.1.8.3. Company Financials
- 12.1.8.4. SWOT Analysis
- 12.1.9 Disney
- 12.1.9.1. Company Overview
- 12.1.9.2. Products
- 12.1.9.3. Company Financials
- 12.1.9.4. SWOT Analysis
- 12.1.10 Ignite
- 12.1.10.1. Company Overview
- 12.1.10.2. Products
- 12.1.10.3. Company Financials
- 12.1.10.4. SWOT Analysis
- 12.1.11 Primula
- 12.1.11.1. Company Overview
- 12.1.11.2. Products
- 12.1.11.3. Company Financials
- 12.1.11.4. SWOT Analysis
- 12.1.12 Zojirushi
- 12.1.12.1. Company Overview
- 12.1.12.2. Products
- 12.1.12.3. Company Financials
- 12.1.12.4. SWOT Analysis
- 12.1.1 Keurig
- 12.2. Market Entropy
- 12.2.1 Company's Key Areas Served
- 12.2.2 Recent Developments
- 12.3. Company Market Share Analysis 2025
- 12.3.1 Top 5 Companies Market Share Analysis
- 12.3.2 Top 3 Companies Market Share Analysis
- 12.4. List of Potential Customers
- 13. Research Methodology
List of Figures
- Figure 1: Global Travel Mug Revenue Breakdown (billion, %) by Region 2025 & 2033
- Figure 2: Global Travel Mug Volume Breakdown (K, %) by Region 2025 & 2033
- Figure 3: North America Travel Mug Revenue (billion), by Application 2025 & 2033
- Figure 4: North America Travel Mug Volume (K), by Application 2025 & 2033
- Figure 5: North America Travel Mug Revenue Share (%), by Application 2025 & 2033
- Figure 6: North America Travel Mug Volume Share (%), by Application 2025 & 2033
- Figure 7: North America Travel Mug Revenue (billion), by Types 2025 & 2033
- Figure 8: North America Travel Mug Volume (K), by Types 2025 & 2033
- Figure 9: North America Travel Mug Revenue Share (%), by Types 2025 & 2033
- Figure 10: North America Travel Mug Volume Share (%), by Types 2025 & 2033
- Figure 11: North America Travel Mug Revenue (billion), by Country 2025 & 2033
- Figure 12: North America Travel Mug Volume (K), by Country 2025 & 2033
- Figure 13: North America Travel Mug Revenue Share (%), by Country 2025 & 2033
- Figure 14: North America Travel Mug Volume Share (%), by Country 2025 & 2033
- Figure 15: South America Travel Mug Revenue (billion), by Application 2025 & 2033
- Figure 16: South America Travel Mug Volume (K), by Application 2025 & 2033
- Figure 17: South America Travel Mug Revenue Share (%), by Application 2025 & 2033
- Figure 18: South America Travel Mug Volume Share (%), by Application 2025 & 2033
- Figure 19: South America Travel Mug Revenue (billion), by Types 2025 & 2033
- Figure 20: South America Travel Mug Volume (K), by Types 2025 & 2033
- Figure 21: South America Travel Mug Revenue Share (%), by Types 2025 & 2033
- Figure 22: South America Travel Mug Volume Share (%), by Types 2025 & 2033
- Figure 23: South America Travel Mug Revenue (billion), by Country 2025 & 2033
- Figure 24: South America Travel Mug Volume (K), by Country 2025 & 2033
- Figure 25: South America Travel Mug Revenue Share (%), by Country 2025 & 2033
- Figure 26: South America Travel Mug Volume Share (%), by Country 2025 & 2033
- Figure 27: Europe Travel Mug Revenue (billion), by Application 2025 & 2033
- Figure 28: Europe Travel Mug Volume (K), by Application 2025 & 2033
- Figure 29: Europe Travel Mug Revenue Share (%), by Application 2025 & 2033
- Figure 30: Europe Travel Mug Volume Share (%), by Application 2025 & 2033
- Figure 31: Europe Travel Mug Revenue (billion), by Types 2025 & 2033
- Figure 32: Europe Travel Mug Volume (K), by Types 2025 & 2033
- Figure 33: Europe Travel Mug Revenue Share (%), by Types 2025 & 2033
- Figure 34: Europe Travel Mug Volume Share (%), by Types 2025 & 2033
- Figure 35: Europe Travel Mug Revenue (billion), by Country 2025 & 2033
- Figure 36: Europe Travel Mug Volume (K), by Country 2025 & 2033
- Figure 37: Europe Travel Mug Revenue Share (%), by Country 2025 & 2033
- Figure 38: Europe Travel Mug Volume Share (%), by Country 2025 & 2033
- Figure 39: Middle East & Africa Travel Mug Revenue (billion), by Application 2025 & 2033
- Figure 40: Middle East & Africa Travel Mug Volume (K), by Application 2025 & 2033
- Figure 41: Middle East & Africa Travel Mug Revenue Share (%), by Application 2025 & 2033
- Figure 42: Middle East & Africa Travel Mug Volume Share (%), by Application 2025 & 2033
- Figure 43: Middle East & Africa Travel Mug Revenue (billion), by Types 2025 & 2033
- Figure 44: Middle East & Africa Travel Mug Volume (K), by Types 2025 & 2033
- Figure 45: Middle East & Africa Travel Mug Revenue Share (%), by Types 2025 & 2033
- Figure 46: Middle East & Africa Travel Mug Volume Share (%), by Types 2025 & 2033
- Figure 47: Middle East & Africa Travel Mug Revenue (billion), by Country 2025 & 2033
- Figure 48: Middle East & Africa Travel Mug Volume (K), by Country 2025 & 2033
- Figure 49: Middle East & Africa Travel Mug Revenue Share (%), by Country 2025 & 2033
- Figure 50: Middle East & Africa Travel Mug Volume Share (%), by Country 2025 & 2033
- Figure 51: Asia Pacific Travel Mug Revenue (billion), by Application 2025 & 2033
- Figure 52: Asia Pacific Travel Mug Volume (K), by Application 2025 & 2033
- Figure 53: Asia Pacific Travel Mug Revenue Share (%), by Application 2025 & 2033
- Figure 54: Asia Pacific Travel Mug Volume Share (%), by Application 2025 & 2033
- Figure 55: Asia Pacific Travel Mug Revenue (billion), by Types 2025 & 2033
- Figure 56: Asia Pacific Travel Mug Volume (K), by Types 2025 & 2033
- Figure 57: Asia Pacific Travel Mug Revenue Share (%), by Types 2025 & 2033
- Figure 58: Asia Pacific Travel Mug Volume Share (%), by Types 2025 & 2033
- Figure 59: Asia Pacific Travel Mug Revenue (billion), by Country 2025 & 2033
- Figure 60: Asia Pacific Travel Mug Volume (K), by Country 2025 & 2033
- Figure 61: Asia Pacific Travel Mug Revenue Share (%), by Country 2025 & 2033
- Figure 62: Asia Pacific Travel Mug Volume Share (%), by Country 2025 & 2033
List of Tables
- Table 1: Global Travel Mug Revenue billion Forecast, by Application 2020 & 2033
- Table 2: Global Travel Mug Volume K Forecast, by Application 2020 & 2033
- Table 3: Global Travel Mug Revenue billion Forecast, by Types 2020 & 2033
- Table 4: Global Travel Mug Volume K Forecast, by Types 2020 & 2033
- Table 5: Global Travel Mug Revenue billion Forecast, by Region 2020 & 2033
- Table 6: Global Travel Mug Volume K Forecast, by Region 2020 & 2033
- Table 7: Global Travel Mug Revenue billion Forecast, by Application 2020 & 2033
- Table 8: Global Travel Mug Volume K Forecast, by Application 2020 & 2033
- Table 9: Global Travel Mug Revenue billion Forecast, by Types 2020 & 2033
- Table 10: Global Travel Mug Volume K Forecast, by Types 2020 & 2033
- Table 11: Global Travel Mug Revenue billion Forecast, by Country 2020 & 2033
- Table 12: Global Travel Mug Volume K Forecast, by Country 2020 & 2033
- Table 13: United States Travel Mug Revenue (billion) Forecast, by Application 2020 & 2033
- Table 14: United States Travel Mug Volume (K) Forecast, by Application 2020 & 2033
- Table 15: Canada Travel Mug Revenue (billion) Forecast, by Application 2020 & 2033
- Table 16: Canada Travel Mug Volume (K) Forecast, by Application 2020 & 2033
- Table 17: Mexico Travel Mug Revenue (billion) Forecast, by Application 2020 & 2033
- Table 18: Mexico Travel Mug Volume (K) Forecast, by Application 2020 & 2033
- Table 19: Global Travel Mug Revenue billion Forecast, by Application 2020 & 2033
- Table 20: Global Travel Mug Volume K Forecast, by Application 2020 & 2033
- Table 21: Global Travel Mug Revenue billion Forecast, by Types 2020 & 2033
- Table 22: Global Travel Mug Volume K Forecast, by Types 2020 & 2033
- Table 23: Global Travel Mug Revenue billion Forecast, by Country 2020 & 2033
- Table 24: Global Travel Mug Volume K Forecast, by Country 2020 & 2033
- Table 25: Brazil Travel Mug Revenue (billion) Forecast, by Application 2020 & 2033
- Table 26: Brazil Travel Mug Volume (K) Forecast, by Application 2020 & 2033
- Table 27: Argentina Travel Mug Revenue (billion) Forecast, by Application 2020 & 2033
- Table 28: Argentina Travel Mug Volume (K) Forecast, by Application 2020 & 2033
- Table 29: Rest of South America Travel Mug Revenue (billion) Forecast, by Application 2020 & 2033
- Table 30: Rest of South America Travel Mug Volume (K) Forecast, by Application 2020 & 2033
- Table 31: Global Travel Mug Revenue billion Forecast, by Application 2020 & 2033
- Table 32: Global Travel Mug Volume K Forecast, by Application 2020 & 2033
- Table 33: Global Travel Mug Revenue billion Forecast, by Types 2020 & 2033
- Table 34: Global Travel Mug Volume K Forecast, by Types 2020 & 2033
- Table 35: Global Travel Mug Revenue billion Forecast, by Country 2020 & 2033
- Table 36: Global Travel Mug Volume K Forecast, by Country 2020 & 2033
- Table 37: United Kingdom Travel Mug Revenue (billion) Forecast, by Application 2020 & 2033
- Table 38: United Kingdom Travel Mug Volume (K) Forecast, by Application 2020 & 2033
- Table 39: Germany Travel Mug Revenue (billion) Forecast, by Application 2020 & 2033
- Table 40: Germany Travel Mug Volume (K) Forecast, by Application 2020 & 2033
- Table 41: France Travel Mug Revenue (billion) Forecast, by Application 2020 & 2033
- Table 42: France Travel Mug Volume (K) Forecast, by Application 2020 & 2033
- Table 43: Italy Travel Mug Revenue (billion) Forecast, by Application 2020 & 2033
- Table 44: Italy Travel Mug Volume (K) Forecast, by Application 2020 & 2033
- Table 45: Spain Travel Mug Revenue (billion) Forecast, by Application 2020 & 2033
- Table 46: Spain Travel Mug Volume (K) Forecast, by Application 2020 & 2033
- Table 47: Russia Travel Mug Revenue (billion) Forecast, by Application 2020 & 2033
- Table 48: Russia Travel Mug Volume (K) Forecast, by Application 2020 & 2033
- Table 49: Benelux Travel Mug Revenue (billion) Forecast, by Application 2020 & 2033
- Table 50: Benelux Travel Mug Volume (K) Forecast, by Application 2020 & 2033
- Table 51: Nordics Travel Mug Revenue (billion) Forecast, by Application 2020 & 2033
- Table 52: Nordics Travel Mug Volume (K) Forecast, by Application 2020 & 2033
- Table 53: Rest of Europe Travel Mug Revenue (billion) Forecast, by Application 2020 & 2033
- Table 54: Rest of Europe Travel Mug Volume (K) Forecast, by Application 2020 & 2033
- Table 55: Global Travel Mug Revenue billion Forecast, by Application 2020 & 2033
- Table 56: Global Travel Mug Volume K Forecast, by Application 2020 & 2033
- Table 57: Global Travel Mug Revenue billion Forecast, by Types 2020 & 2033
- Table 58: Global Travel Mug Volume K Forecast, by Types 2020 & 2033
- Table 59: Global Travel Mug Revenue billion Forecast, by Country 2020 & 2033
- Table 60: Global Travel Mug Volume K Forecast, by Country 2020 & 2033
- Table 61: Turkey Travel Mug Revenue (billion) Forecast, by Application 2020 & 2033
- Table 62: Turkey Travel Mug Volume (K) Forecast, by Application 2020 & 2033
- Table 63: Israel Travel Mug Revenue (billion) Forecast, by Application 2020 & 2033
- Table 64: Israel Travel Mug Volume (K) Forecast, by Application 2020 & 2033
- Table 65: GCC Travel Mug Revenue (billion) Forecast, by Application 2020 & 2033
- Table 66: GCC Travel Mug Volume (K) Forecast, by Application 2020 & 2033
- Table 67: North Africa Travel Mug Revenue (billion) Forecast, by Application 2020 & 2033
- Table 68: North Africa Travel Mug Volume (K) Forecast, by Application 2020 & 2033
- Table 69: South Africa Travel Mug Revenue (billion) Forecast, by Application 2020 & 2033
- Table 70: South Africa Travel Mug Volume (K) Forecast, by Application 2020 & 2033
- Table 71: Rest of Middle East & Africa Travel Mug Revenue (billion) Forecast, by Application 2020 & 2033
- Table 72: Rest of Middle East & Africa Travel Mug Volume (K) Forecast, by Application 2020 & 2033
- Table 73: Global Travel Mug Revenue billion Forecast, by Application 2020 & 2033
- Table 74: Global Travel Mug Volume K Forecast, by Application 2020 & 2033
- Table 75: Global Travel Mug Revenue billion Forecast, by Types 2020 & 2033
- Table 76: Global Travel Mug Volume K Forecast, by Types 2020 & 2033
- Table 77: Global Travel Mug Revenue billion Forecast, by Country 2020 & 2033
- Table 78: Global Travel Mug Volume K Forecast, by Country 2020 & 2033
- Table 79: China Travel Mug Revenue (billion) Forecast, by Application 2020 & 2033
- Table 80: China Travel Mug Volume (K) Forecast, by Application 2020 & 2033
- Table 81: India Travel Mug Revenue (billion) Forecast, by Application 2020 & 2033
- Table 82: India Travel Mug Volume (K) Forecast, by Application 2020 & 2033
- Table 83: Japan Travel Mug Revenue (billion) Forecast, by Application 2020 & 2033
- Table 84: Japan Travel Mug Volume (K) Forecast, by Application 2020 & 2033
- Table 85: South Korea Travel Mug Revenue (billion) Forecast, by Application 2020 & 2033
- Table 86: South Korea Travel Mug Volume (K) Forecast, by Application 2020 & 2033
- Table 87: ASEAN Travel Mug Revenue (billion) Forecast, by Application 2020 & 2033
- Table 88: ASEAN Travel Mug Volume (K) Forecast, by Application 2020 & 2033
- Table 89: Oceania Travel Mug Revenue (billion) Forecast, by Application 2020 & 2033
- Table 90: Oceania Travel Mug Volume (K) Forecast, by Application 2020 & 2033
- Table 91: Rest of Asia Pacific Travel Mug Revenue (billion) Forecast, by Application 2020 & 2033
- Table 92: Rest of Asia Pacific Travel Mug Volume (K) Forecast, by Application 2020 & 2033
Frequently Asked Questions
1. What is the projected Compound Annual Growth Rate (CAGR) of the Travel Mug?
The projected CAGR is approximately 7.48%.
2. Which companies are prominent players in the Travel Mug?
Key companies in the market include Keurig, Ninja, DeLonghi, bobble, Bonjour, Cake Boss, Caribou Coffee, Contigo, Disney, Ignite, Primula, Zojirushi.
3. What are the main segments of the Travel Mug?
The market segments include Application, Types.
4. Can you provide details about the market size?
The market size is estimated to be USD 14.32 billion as of 2022.
5. What are some drivers contributing to market growth?
N/A
6. What are the notable trends driving market growth?
N/A
7. Are there any restraints impacting market growth?
N/A
8. Can you provide examples of recent developments in the market?
N/A
9. What pricing options are available for accessing the report?
Pricing options include single-user, multi-user, and enterprise licenses priced at USD 3350.00, USD 5025.00, and USD 6700.00 respectively.
10. Is the market size provided in terms of value or volume?
The market size is provided in terms of value, measured in billion and volume, measured in K.
11. Are there any specific market keywords associated with the report?
Yes, the market keyword associated with the report is "Travel Mug," which aids in identifying and referencing the specific market segment covered.
12. How do I determine which pricing option suits my needs best?
The pricing options vary based on user requirements and access needs. Individual users may opt for single-user licenses, while businesses requiring broader access may choose multi-user or enterprise licenses for cost-effective access to the report.
13. Are there any additional resources or data provided in the Travel Mug report?
While the report offers comprehensive insights, it's advisable to review the specific contents or supplementary materials provided to ascertain if additional resources or data are available.
14. How can I stay updated on further developments or reports in the Travel Mug?
To stay informed about further developments, trends, and reports in the Travel Mug, consider subscribing to industry newsletters, following relevant companies and organizations, or regularly checking reputable industry news sources and publications.
Methodology
Step 1 - Identification of Relevant Samples Size from Population Database


Step 2 - Approaches for Defining Global Market Size (Value, Volume* & Price*)

Note*: In applicable scenarios
Step 3 - Data Sources
Primary Research
- Web Analytics
- Survey Reports
- Research Institute
- Latest Research Reports
- Opinion Leaders
Secondary Research
- Annual Reports
- White Paper
- Latest Press Release
- Industry Association
- Paid Database
- Investor Presentations

Step 4 - Data Triangulation
Involves using different sources of information in order to increase the validity of a study
These sources are likely to be stakeholders in a program - participants, other researchers, program staff, other community members, and so on.
Then we put all data in single framework & apply various statistical tools to find out the dynamic on the market.
During the analysis stage, feedback from the stakeholder groups would be compared to determine areas of agreement as well as areas of divergence