
Key Insights
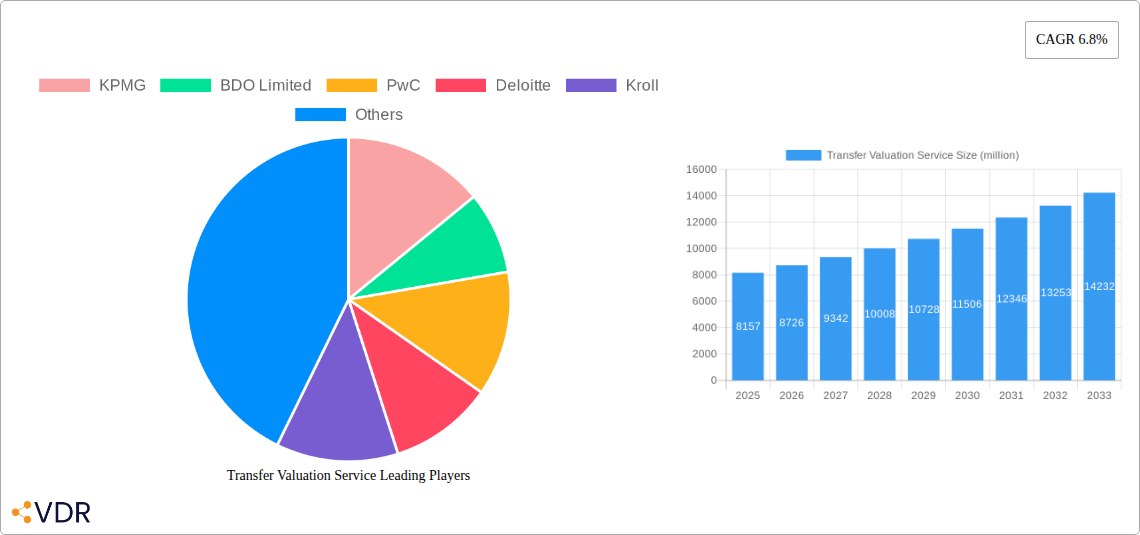
The global Transfer Pricing Valuation Services market, currently estimated at $8.157 billion (2025), is projected to experience robust growth, fueled by a compound annual growth rate (CAGR) of 6.8% from 2025 to 2033. This expansion is driven by several key factors. Increased cross-border transactions and globalization necessitate robust transfer pricing strategies to comply with international tax regulations and minimize tax liabilities for multinational corporations. Stringent regulatory scrutiny and increased enforcement by tax authorities worldwide are further propelling demand for specialized transfer pricing services. The growing complexity of international tax laws and the need for sophisticated valuation methodologies are also contributing factors. Furthermore, the rise of digitalization and automation is impacting the service delivery models within the industry, with firms adopting advanced technologies to enhance efficiency and accuracy in their valuations. This trend is likely to further shape the market landscape in the coming years.
The market is highly competitive, with prominent players including KPMG, PwC, Deloitte, and others vying for market share. These firms provide a wide range of services, from transactional advisory to ongoing compliance support. Segment-specific growth will be influenced by factors such as industry regulations and the prevalence of cross-border transactions within particular sectors. While challenges such as economic downturns and fluctuating exchange rates could potentially restrain growth, the overall market outlook remains positive, driven by the enduring need for compliant and efficient transfer pricing practices. The market's expansion is expected to continue throughout the forecast period, with significant opportunities for firms that can adapt to the evolving technological landscape and regulatory environment. Regional variations in market size will likely reflect differences in economic activity and regulatory frameworks across various geographical areas.
Transfer Valuation Service Market Report: 2019-2033
This comprehensive report provides an in-depth analysis of the global Transfer Valuation Service market, encompassing historical data (2019-2024), current estimations (2025), and future projections (2025-2033). It offers invaluable insights for industry professionals, investors, and strategic decision-makers seeking to navigate this dynamic landscape. The report leverages rigorous research methodologies and incorporates data from leading market players like KPMG, BDO Limited, PwC, Deloitte, and Kroll, among others, to deliver a holistic and actionable perspective. The parent market is the global professional services sector, while the child market is transfer pricing advisory and valuation services.
Transfer Valuation Service Market Dynamics & Structure
The global Transfer Valuation Service market exhibits a moderately concentrated structure, with a few large multinational firms commanding significant market share (KPMG, PwC, Deloitte holding approximately xx% collectively in 2025). Technological innovation, driven by AI-powered valuation tools and data analytics platforms, is steadily transforming the industry. Stringent regulatory frameworks, particularly those emanating from the OECD and individual countries' tax authorities, heavily influence market dynamics. Competition from alternative methods of valuation and smaller, specialized firms is increasing. The end-user demographic comprises multinational corporations (MNCs), SMEs engaging in cross-border transactions, and private equity firms. M&A activity within the professional services sector remains a significant factor, with xx large deals recorded in the historical period (2019-2024), impacting market consolidation.
- Market Concentration: High, with top 5 players holding xx% market share in 2025.
- Technological Innovation: Rapid adoption of AI and data analytics driving efficiency and accuracy.
- Regulatory Framework: OECD BEPS initiatives and country-specific regulations are key drivers.
- Competitive Substitutes: Simpler valuation methods, but these often lack the sophistication needed for complex transactions.
- End-User Demographics: Primarily MNCs and large corporations with international operations.
- M&A Trends: Consolidation continues, with xx major acquisitions projected by 2033.
Transfer Valuation Service Growth Trends & Insights
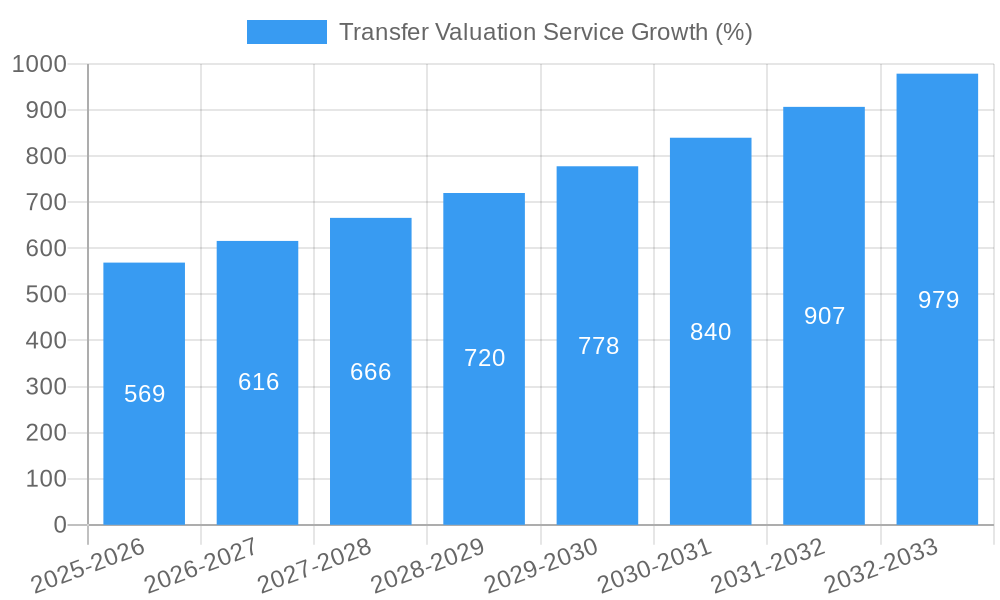
The Transfer Valuation Service market demonstrates robust growth, driven by the increasing complexity of global supply chains and heightened scrutiny from tax authorities. The market size expanded from $xx million in 2019 to an estimated $xx million in 2025, exhibiting a CAGR of xx% during the historical period. This growth trajectory is expected to continue, reaching $xx million by 2033, with a projected CAGR of xx% during the forecast period. Increased adoption of digital solutions, coupled with a growing awareness of transfer pricing risks among businesses, fuels market expansion. The rising complexity of international trade agreements and regulations further drives demand for specialized services.
(Note: This section needs data to populate the XXX placeholder values for accurate figures.)
Dominant Regions, Countries, or Segments in Transfer Valuation Service
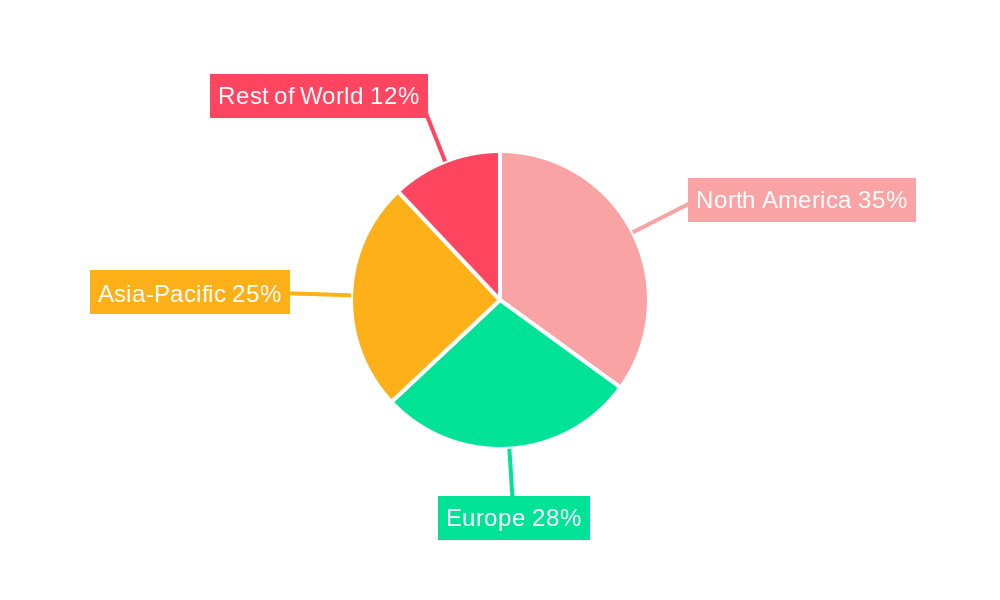
North America (especially the U.S.) and Europe currently dominate the Transfer Valuation Service market, driven by a high concentration of multinational corporations and a sophisticated regulatory environment. Asia-Pacific is a fast-growing region with significant potential due to its expanding economies and rising cross-border trade. The dominance of North America and Europe stems from a combination of factors, including a mature regulatory framework, higher awareness of transfer pricing implications, and a large pool of experienced professionals. However, the growth rate in APAC is significantly higher.
- North America: High market share, driven by stringent regulations and a large MNC presence.
- Europe: Strong presence due to established regulatory frameworks and extensive experience in transfer pricing.
- Asia-Pacific: Fastest-growing region, fueled by economic growth and increased cross-border trade.
- Other Regions: Growing, but with slower adoption compared to established markets.
Transfer Valuation Service Product Landscape
The Transfer Valuation Service market offers a range of products and services, including transaction-based valuations, ongoing compliance support, and specialized consulting services on complex transfer pricing issues. The focus is shifting towards integrated technology platforms that enhance efficiency and accuracy. Companies are increasingly emphasizing data analytics and AI-driven tools to automate routine tasks and improve the quality of valuation assessments. Unique selling propositions (USPs) often center on industry specialization, a deep understanding of regulatory complexities, and the ability to navigate cross-border challenges.
Key Drivers, Barriers & Challenges in Transfer Valuation Service
Key Drivers: Increased cross-border transactions, stricter global tax regulations (OECD BEPS initiatives), greater scrutiny from tax authorities, and the rising demand for sophisticated valuation methodologies.
Key Challenges & Restraints: High cost of services, a shortage of skilled professionals, complex regulatory landscapes, and the increasing competition from specialized boutiques. These challenges contribute to a projected xx% market penetration rate for advanced valuation services by 2033.
Emerging Opportunities in Transfer Valuation Service
Emerging opportunities lie in expanding into untapped markets (especially in developing economies), leveraging advanced technologies (AI, blockchain), and providing specialized services related to digital economy transactions and intangible assets. The growing demand for automated valuation solutions also presents significant opportunities. Businesses are increasingly seeking proactive transfer pricing solutions to mitigate potential risks and ensure tax compliance.
Growth Accelerators in the Transfer Valuation Service Industry
The long-term growth of the Transfer Valuation Service industry is being fueled by several factors, including ongoing technological advancements that enhance efficiency and accuracy, strategic partnerships between valuation firms and technology providers, and the expansion of services into new and emerging markets. The increasing complexity of global trade and the ongoing efforts by tax authorities worldwide to combat tax avoidance are significant drivers.
Key Players Shaping the Transfer Valuation Service Market
- KPMG
- BDO Limited
- PwC
- Deloitte
- Kroll
- Cherry Bekaert
- RSM
- Thomson Reuters
- Tax Consultants International BV
- Ecovis
- Grant Thornton International
- Bennett Thrasher
Notable Milestones in Transfer Valuation Service Sector
- 2020: OECD releases further guidance on BEPS, increasing demand for valuation services.
- 2022: Several major technology firms launch AI-powered valuation platforms.
- 2023: Significant M&A activity among mid-sized valuation firms.
- 2025: Increased adoption of cloud-based valuation software.
In-Depth Transfer Valuation Service Market Outlook
The Transfer Valuation Service market is poised for continued robust growth, driven by persistent regulatory changes, technological advancements, and the increasing complexity of global business operations. Strategic partnerships, expansion into emerging markets, and the development of innovative service offerings will shape the industry’s future. The market’s long-term potential remains significant, with opportunities for both established players and new entrants to capture substantial market share. The focus will remain on proactive compliance and mitigating transfer pricing risks, with technology playing a crucial role.
Transfer Valuation Service Segmentation
-
1. Application
- 1.1. Large Enterprise
- 1.2. Medium Enterprise
- 1.3. Small Companies
-
2. Types
- 2.1. Planning Transfer Pricing
- 2.2. Business Transfer Pricing
Transfer Valuation Service Segmentation By Geography
-
1. North America
- 1.1. United States
- 1.2. Canada
- 1.3. Mexico
-
2. South America
- 2.1. Brazil
- 2.2. Argentina
- 2.3. Rest of South America
-
3. Europe
- 3.1. United Kingdom
- 3.2. Germany
- 3.3. France
- 3.4. Italy
- 3.5. Spain
- 3.6. Russia
- 3.7. Benelux
- 3.8. Nordics
- 3.9. Rest of Europe
-
4. Middle East & Africa
- 4.1. Turkey
- 4.2. Israel
- 4.3. GCC
- 4.4. North Africa
- 4.5. South Africa
- 4.6. Rest of Middle East & Africa
-
5. Asia Pacific
- 5.1. China
- 5.2. India
- 5.3. Japan
- 5.4. South Korea
- 5.5. ASEAN
- 5.6. Oceania
- 5.7. Rest of Asia Pacific
Transfer Valuation Service REPORT HIGHLIGHTS
| Aspects | Details |
|---|---|
| Study Period | 2019-2033 |
| Base Year | 2024 |
| Estimated Year | 2025 |
| Forecast Period | 2025-2033 |
| Historical Period | 2019-2024 |
| Growth Rate | CAGR of 6.8% from 2019-2033 |
| Segmentation |
|
Table of Contents
- 1. Introduction
- 1.1. Research Scope
- 1.2. Market Segmentation
- 1.3. Research Methodology
- 1.4. Definitions and Assumptions
- 2. Executive Summary
- 2.1. Introduction
- 3. Market Dynamics
- 3.1. Introduction
- 3.2. Market Drivers
- 3.3. Market Restrains
- 3.4. Market Trends
- 4. Market Factor Analysis
- 4.1. Porters Five Forces
- 4.2. Supply/Value Chain
- 4.3. PESTEL analysis
- 4.4. Market Entropy
- 4.5. Patent/Trademark Analysis
- 5. Global Transfer Valuation Service Analysis, Insights and Forecast, 2019-2031
- 5.1. Market Analysis, Insights and Forecast - by Application
- 5.1.1. Large Enterprise
- 5.1.2. Medium Enterprise
- 5.1.3. Small Companies
- 5.2. Market Analysis, Insights and Forecast - by Types
- 5.2.1. Planning Transfer Pricing
- 5.2.2. Business Transfer Pricing
- 5.3. Market Analysis, Insights and Forecast - by Region
- 5.3.1. North America
- 5.3.2. South America
- 5.3.3. Europe
- 5.3.4. Middle East & Africa
- 5.3.5. Asia Pacific
- 5.1. Market Analysis, Insights and Forecast - by Application
- 6. North America Transfer Valuation Service Analysis, Insights and Forecast, 2019-2031
- 6.1. Market Analysis, Insights and Forecast - by Application
- 6.1.1. Large Enterprise
- 6.1.2. Medium Enterprise
- 6.1.3. Small Companies
- 6.2. Market Analysis, Insights and Forecast - by Types
- 6.2.1. Planning Transfer Pricing
- 6.2.2. Business Transfer Pricing
- 6.1. Market Analysis, Insights and Forecast - by Application
- 7. South America Transfer Valuation Service Analysis, Insights and Forecast, 2019-2031
- 7.1. Market Analysis, Insights and Forecast - by Application
- 7.1.1. Large Enterprise
- 7.1.2. Medium Enterprise
- 7.1.3. Small Companies
- 7.2. Market Analysis, Insights and Forecast - by Types
- 7.2.1. Planning Transfer Pricing
- 7.2.2. Business Transfer Pricing
- 7.1. Market Analysis, Insights and Forecast - by Application
- 8. Europe Transfer Valuation Service Analysis, Insights and Forecast, 2019-2031
- 8.1. Market Analysis, Insights and Forecast - by Application
- 8.1.1. Large Enterprise
- 8.1.2. Medium Enterprise
- 8.1.3. Small Companies
- 8.2. Market Analysis, Insights and Forecast - by Types
- 8.2.1. Planning Transfer Pricing
- 8.2.2. Business Transfer Pricing
- 8.1. Market Analysis, Insights and Forecast - by Application
- 9. Middle East & Africa Transfer Valuation Service Analysis, Insights and Forecast, 2019-2031
- 9.1. Market Analysis, Insights and Forecast - by Application
- 9.1.1. Large Enterprise
- 9.1.2. Medium Enterprise
- 9.1.3. Small Companies
- 9.2. Market Analysis, Insights and Forecast - by Types
- 9.2.1. Planning Transfer Pricing
- 9.2.2. Business Transfer Pricing
- 9.1. Market Analysis, Insights and Forecast - by Application
- 10. Asia Pacific Transfer Valuation Service Analysis, Insights and Forecast, 2019-2031
- 10.1. Market Analysis, Insights and Forecast - by Application
- 10.1.1. Large Enterprise
- 10.1.2. Medium Enterprise
- 10.1.3. Small Companies
- 10.2. Market Analysis, Insights and Forecast - by Types
- 10.2.1. Planning Transfer Pricing
- 10.2.2. Business Transfer Pricing
- 10.1. Market Analysis, Insights and Forecast - by Application
- 11. Competitive Analysis
- 11.1. Global Market Share Analysis 2024
- 11.2. Company Profiles
- 11.2.1 KPMG
- 11.2.1.1. Overview
- 11.2.1.2. Products
- 11.2.1.3. SWOT Analysis
- 11.2.1.4. Recent Developments
- 11.2.1.5. Financials (Based on Availability)
- 11.2.2 BDO Limited
- 11.2.2.1. Overview
- 11.2.2.2. Products
- 11.2.2.3. SWOT Analysis
- 11.2.2.4. Recent Developments
- 11.2.2.5. Financials (Based on Availability)
- 11.2.3 PwC
- 11.2.3.1. Overview
- 11.2.3.2. Products
- 11.2.3.3. SWOT Analysis
- 11.2.3.4. Recent Developments
- 11.2.3.5. Financials (Based on Availability)
- 11.2.4 Deloitte
- 11.2.4.1. Overview
- 11.2.4.2. Products
- 11.2.4.3. SWOT Analysis
- 11.2.4.4. Recent Developments
- 11.2.4.5. Financials (Based on Availability)
- 11.2.5 Kroll
- 11.2.5.1. Overview
- 11.2.5.2. Products
- 11.2.5.3. SWOT Analysis
- 11.2.5.4. Recent Developments
- 11.2.5.5. Financials (Based on Availability)
- 11.2.6 Cherry Bekaert
- 11.2.6.1. Overview
- 11.2.6.2. Products
- 11.2.6.3. SWOT Analysis
- 11.2.6.4. Recent Developments
- 11.2.6.5. Financials (Based on Availability)
- 11.2.7 RSM
- 11.2.7.1. Overview
- 11.2.7.2. Products
- 11.2.7.3. SWOT Analysis
- 11.2.7.4. Recent Developments
- 11.2.7.5. Financials (Based on Availability)
- 11.2.8 Thomson Reuters
- 11.2.8.1. Overview
- 11.2.8.2. Products
- 11.2.8.3. SWOT Analysis
- 11.2.8.4. Recent Developments
- 11.2.8.5. Financials (Based on Availability)
- 11.2.9 Tax Consultants International BV
- 11.2.9.1. Overview
- 11.2.9.2. Products
- 11.2.9.3. SWOT Analysis
- 11.2.9.4. Recent Developments
- 11.2.9.5. Financials (Based on Availability)
- 11.2.10 Ecovis
- 11.2.10.1. Overview
- 11.2.10.2. Products
- 11.2.10.3. SWOT Analysis
- 11.2.10.4. Recent Developments
- 11.2.10.5. Financials (Based on Availability)
- 11.2.11 Grant Thornton International
- 11.2.11.1. Overview
- 11.2.11.2. Products
- 11.2.11.3. SWOT Analysis
- 11.2.11.4. Recent Developments
- 11.2.11.5. Financials (Based on Availability)
- 11.2.12 Bennett Thrasher
- 11.2.12.1. Overview
- 11.2.12.2. Products
- 11.2.12.3. SWOT Analysis
- 11.2.12.4. Recent Developments
- 11.2.12.5. Financials (Based on Availability)
- 11.2.1 KPMG
List of Figures
- Figure 1: Global Transfer Valuation Service Revenue Breakdown (million, %) by Region 2024 & 2032
- Figure 2: North America Transfer Valuation Service Revenue (million), by Application 2024 & 2032
- Figure 3: North America Transfer Valuation Service Revenue Share (%), by Application 2024 & 2032
- Figure 4: North America Transfer Valuation Service Revenue (million), by Types 2024 & 2032
- Figure 5: North America Transfer Valuation Service Revenue Share (%), by Types 2024 & 2032
- Figure 6: North America Transfer Valuation Service Revenue (million), by Country 2024 & 2032
- Figure 7: North America Transfer Valuation Service Revenue Share (%), by Country 2024 & 2032
- Figure 8: South America Transfer Valuation Service Revenue (million), by Application 2024 & 2032
- Figure 9: South America Transfer Valuation Service Revenue Share (%), by Application 2024 & 2032
- Figure 10: South America Transfer Valuation Service Revenue (million), by Types 2024 & 2032
- Figure 11: South America Transfer Valuation Service Revenue Share (%), by Types 2024 & 2032
- Figure 12: South America Transfer Valuation Service Revenue (million), by Country 2024 & 2032
- Figure 13: South America Transfer Valuation Service Revenue Share (%), by Country 2024 & 2032
- Figure 14: Europe Transfer Valuation Service Revenue (million), by Application 2024 & 2032
- Figure 15: Europe Transfer Valuation Service Revenue Share (%), by Application 2024 & 2032
- Figure 16: Europe Transfer Valuation Service Revenue (million), by Types 2024 & 2032
- Figure 17: Europe Transfer Valuation Service Revenue Share (%), by Types 2024 & 2032
- Figure 18: Europe Transfer Valuation Service Revenue (million), by Country 2024 & 2032
- Figure 19: Europe Transfer Valuation Service Revenue Share (%), by Country 2024 & 2032
- Figure 20: Middle East & Africa Transfer Valuation Service Revenue (million), by Application 2024 & 2032
- Figure 21: Middle East & Africa Transfer Valuation Service Revenue Share (%), by Application 2024 & 2032
- Figure 22: Middle East & Africa Transfer Valuation Service Revenue (million), by Types 2024 & 2032
- Figure 23: Middle East & Africa Transfer Valuation Service Revenue Share (%), by Types 2024 & 2032
- Figure 24: Middle East & Africa Transfer Valuation Service Revenue (million), by Country 2024 & 2032
- Figure 25: Middle East & Africa Transfer Valuation Service Revenue Share (%), by Country 2024 & 2032
- Figure 26: Asia Pacific Transfer Valuation Service Revenue (million), by Application 2024 & 2032
- Figure 27: Asia Pacific Transfer Valuation Service Revenue Share (%), by Application 2024 & 2032
- Figure 28: Asia Pacific Transfer Valuation Service Revenue (million), by Types 2024 & 2032
- Figure 29: Asia Pacific Transfer Valuation Service Revenue Share (%), by Types 2024 & 2032
- Figure 30: Asia Pacific Transfer Valuation Service Revenue (million), by Country 2024 & 2032
- Figure 31: Asia Pacific Transfer Valuation Service Revenue Share (%), by Country 2024 & 2032
List of Tables
- Table 1: Global Transfer Valuation Service Revenue million Forecast, by Region 2019 & 2032
- Table 2: Global Transfer Valuation Service Revenue million Forecast, by Application 2019 & 2032
- Table 3: Global Transfer Valuation Service Revenue million Forecast, by Types 2019 & 2032
- Table 4: Global Transfer Valuation Service Revenue million Forecast, by Region 2019 & 2032
- Table 5: Global Transfer Valuation Service Revenue million Forecast, by Application 2019 & 2032
- Table 6: Global Transfer Valuation Service Revenue million Forecast, by Types 2019 & 2032
- Table 7: Global Transfer Valuation Service Revenue million Forecast, by Country 2019 & 2032
- Table 8: United States Transfer Valuation Service Revenue (million) Forecast, by Application 2019 & 2032
- Table 9: Canada Transfer Valuation Service Revenue (million) Forecast, by Application 2019 & 2032
- Table 10: Mexico Transfer Valuation Service Revenue (million) Forecast, by Application 2019 & 2032
- Table 11: Global Transfer Valuation Service Revenue million Forecast, by Application 2019 & 2032
- Table 12: Global Transfer Valuation Service Revenue million Forecast, by Types 2019 & 2032
- Table 13: Global Transfer Valuation Service Revenue million Forecast, by Country 2019 & 2032
- Table 14: Brazil Transfer Valuation Service Revenue (million) Forecast, by Application 2019 & 2032
- Table 15: Argentina Transfer Valuation Service Revenue (million) Forecast, by Application 2019 & 2032
- Table 16: Rest of South America Transfer Valuation Service Revenue (million) Forecast, by Application 2019 & 2032
- Table 17: Global Transfer Valuation Service Revenue million Forecast, by Application 2019 & 2032
- Table 18: Global Transfer Valuation Service Revenue million Forecast, by Types 2019 & 2032
- Table 19: Global Transfer Valuation Service Revenue million Forecast, by Country 2019 & 2032
- Table 20: United Kingdom Transfer Valuation Service Revenue (million) Forecast, by Application 2019 & 2032
- Table 21: Germany Transfer Valuation Service Revenue (million) Forecast, by Application 2019 & 2032
- Table 22: France Transfer Valuation Service Revenue (million) Forecast, by Application 2019 & 2032
- Table 23: Italy Transfer Valuation Service Revenue (million) Forecast, by Application 2019 & 2032
- Table 24: Spain Transfer Valuation Service Revenue (million) Forecast, by Application 2019 & 2032
- Table 25: Russia Transfer Valuation Service Revenue (million) Forecast, by Application 2019 & 2032
- Table 26: Benelux Transfer Valuation Service Revenue (million) Forecast, by Application 2019 & 2032
- Table 27: Nordics Transfer Valuation Service Revenue (million) Forecast, by Application 2019 & 2032
- Table 28: Rest of Europe Transfer Valuation Service Revenue (million) Forecast, by Application 2019 & 2032
- Table 29: Global Transfer Valuation Service Revenue million Forecast, by Application 2019 & 2032
- Table 30: Global Transfer Valuation Service Revenue million Forecast, by Types 2019 & 2032
- Table 31: Global Transfer Valuation Service Revenue million Forecast, by Country 2019 & 2032
- Table 32: Turkey Transfer Valuation Service Revenue (million) Forecast, by Application 2019 & 2032
- Table 33: Israel Transfer Valuation Service Revenue (million) Forecast, by Application 2019 & 2032
- Table 34: GCC Transfer Valuation Service Revenue (million) Forecast, by Application 2019 & 2032
- Table 35: North Africa Transfer Valuation Service Revenue (million) Forecast, by Application 2019 & 2032
- Table 36: South Africa Transfer Valuation Service Revenue (million) Forecast, by Application 2019 & 2032
- Table 37: Rest of Middle East & Africa Transfer Valuation Service Revenue (million) Forecast, by Application 2019 & 2032
- Table 38: Global Transfer Valuation Service Revenue million Forecast, by Application 2019 & 2032
- Table 39: Global Transfer Valuation Service Revenue million Forecast, by Types 2019 & 2032
- Table 40: Global Transfer Valuation Service Revenue million Forecast, by Country 2019 & 2032
- Table 41: China Transfer Valuation Service Revenue (million) Forecast, by Application 2019 & 2032
- Table 42: India Transfer Valuation Service Revenue (million) Forecast, by Application 2019 & 2032
- Table 43: Japan Transfer Valuation Service Revenue (million) Forecast, by Application 2019 & 2032
- Table 44: South Korea Transfer Valuation Service Revenue (million) Forecast, by Application 2019 & 2032
- Table 45: ASEAN Transfer Valuation Service Revenue (million) Forecast, by Application 2019 & 2032
- Table 46: Oceania Transfer Valuation Service Revenue (million) Forecast, by Application 2019 & 2032
- Table 47: Rest of Asia Pacific Transfer Valuation Service Revenue (million) Forecast, by Application 2019 & 2032
Frequently Asked Questions
1. What is the projected Compound Annual Growth Rate (CAGR) of the Transfer Valuation Service?
The projected CAGR is approximately 6.8%.
2. Which companies are prominent players in the Transfer Valuation Service?
Key companies in the market include KPMG, BDO Limited, PwC, Deloitte, Kroll, Cherry Bekaert, RSM, Thomson Reuters, Tax Consultants International BV, Ecovis, Grant Thornton International, Bennett Thrasher.
3. What are the main segments of the Transfer Valuation Service?
The market segments include Application, Types.
4. Can you provide details about the market size?
The market size is estimated to be USD 8157 million as of 2022.
5. What are some drivers contributing to market growth?
N/A
6. What are the notable trends driving market growth?
N/A
7. Are there any restraints impacting market growth?
N/A
8. Can you provide examples of recent developments in the market?
N/A
9. What pricing options are available for accessing the report?
Pricing options include single-user, multi-user, and enterprise licenses priced at USD 4900.00, USD 7350.00, and USD 9800.00 respectively.
10. Is the market size provided in terms of value or volume?
The market size is provided in terms of value, measured in million.
11. Are there any specific market keywords associated with the report?
Yes, the market keyword associated with the report is "Transfer Valuation Service," which aids in identifying and referencing the specific market segment covered.
12. How do I determine which pricing option suits my needs best?
The pricing options vary based on user requirements and access needs. Individual users may opt for single-user licenses, while businesses requiring broader access may choose multi-user or enterprise licenses for cost-effective access to the report.
13. Are there any additional resources or data provided in the Transfer Valuation Service report?
While the report offers comprehensive insights, it's advisable to review the specific contents or supplementary materials provided to ascertain if additional resources or data are available.
14. How can I stay updated on further developments or reports in the Transfer Valuation Service?
To stay informed about further developments, trends, and reports in the Transfer Valuation Service, consider subscribing to industry newsletters, following relevant companies and organizations, or regularly checking reputable industry news sources and publications.
Methodology
Step 1 - Identification of Relevant Samples Size from Population Database


Step 2 - Approaches for Defining Global Market Size (Value, Volume* & Price*)

Note*: In applicable scenarios
Step 3 - Data Sources
Primary Research
- Web Analytics
- Survey Reports
- Research Institute
- Latest Research Reports
- Opinion Leaders
Secondary Research
- Annual Reports
- White Paper
- Latest Press Release
- Industry Association
- Paid Database
- Investor Presentations

Step 4 - Data Triangulation
Involves using different sources of information in order to increase the validity of a study
These sources are likely to be stakeholders in a program - participants, other researchers, program staff, other community members, and so on.
Then we put all data in single framework & apply various statistical tools to find out the dynamic on the market.
During the analysis stage, feedback from the stakeholder groups would be compared to determine areas of agreement as well as areas of divergence


