

Key Insights
The thermoplastic starch (TPS) market is experiencing robust growth, driven by increasing demand for eco-friendly and biodegradable packaging solutions. The market's 7.39% CAGR from 2019-2024 indicates a significant upward trajectory, projected to continue into the forecast period (2025-2033). Several factors contribute to this expansion. The rising consumer awareness of environmental issues and the consequent push for sustainable alternatives to conventional plastics are major drivers. Government regulations promoting bio-based materials and reducing plastic waste further stimulate market growth. The versatility of TPS, enabling its use in various applications like bags, films, and 3D printing, broadens its market appeal. Extrusion and injection molding are the dominant manufacturing methods, with extrusion holding a larger market share due to its cost-effectiveness for large-scale production of films and bags. While the market faces challenges such as higher production costs compared to conventional plastics and certain limitations in terms of water resistance and durability, ongoing research and development efforts focused on improving material properties are mitigating these constraints. Geographical expansion, particularly in Asia-Pacific driven by its large and growing population and increasing industrialization, contributes substantially to overall market growth. Europe also maintains a significant market share due to the region's strong environmental regulations and focus on sustainability.
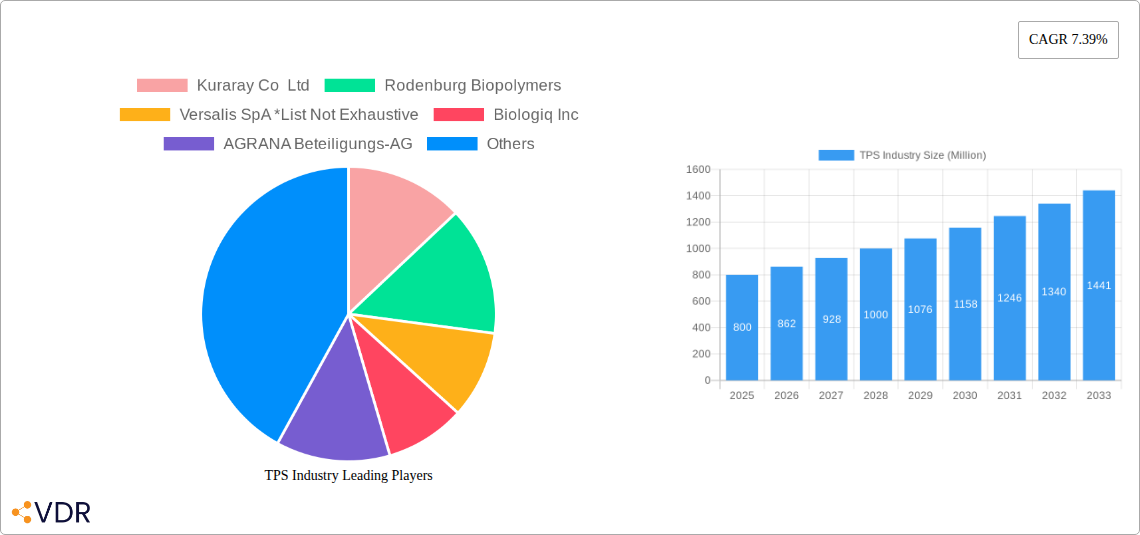
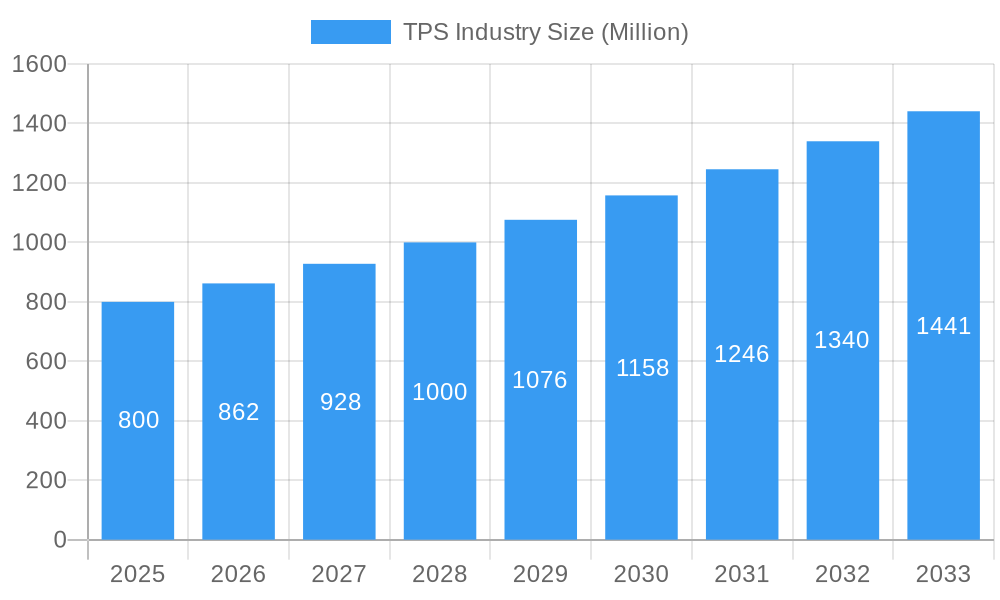
TPS Industry Market Size (In Million)
The competitive landscape is characterized by a mix of established players and emerging companies. Key market participants such as Kuraray Co Ltd, Rodenburg Biopolymers, and Versalis SpA are leveraging their technological expertise and established distribution networks to maintain their market positions. However, smaller, innovative companies are also entering the market, introducing new TPS formulations and applications. The market is expected to witness further consolidation as companies pursue strategic partnerships and acquisitions to expand their product portfolios and geographical reach. The continued growth in the coming decade will be largely influenced by technological advancements addressing the limitations of TPS, expansion into new applications, and the increasing adoption of sustainable practices across various industries. A focus on cost-reduction strategies and enhanced product performance will be crucial for sustained market success.
TPS Industry Company Market Share
TPS Industry Market Report: 2019-2033
This comprehensive report provides an in-depth analysis of the Thermoplastic Polyurethane (TPS) industry, encompassing market dynamics, growth trends, regional segmentation, product landscape, and key player strategies. The report covers the period 2019-2033, with a base year of 2025 and a forecast period of 2025-2033. The analysis incorporates data from the historical period (2019-2024) and leverages extensive research to provide actionable insights for industry professionals. This report is crucial for businesses operating within the parent market of polyurethane polymers and its child market focusing on bio-based and compostable TPS.
TPS Industry Market Dynamics & Structure
The TPS industry exhibits a moderately concentrated market structure, with a few major players holding significant market share. Market concentration is expected to remain relatively stable in the forecast period, with larger companies consolidating through M&A activity. The industry is characterized by continuous technological innovation, driven by the need for enhanced material properties, improved sustainability, and cost reduction. Stringent regulatory frameworks concerning environmental impact and product safety are shaping industry practices. The emergence of bio-based and compostable TPS alternatives poses a significant threat to traditional petroleum-based materials. Consumer demand for sustainable and eco-friendly products is a major driving force.
- Market Concentration: Top 5 players hold approximately xx% of the market share in 2025 (estimated).
- M&A Activity: An estimated xx deals were recorded in the historical period (2019-2024), representing a total deal value of xx Million.
- Technological Innovation: Ongoing research focuses on improving biodegradability, increasing strength, and expanding application possibilities.
- Regulatory Landscape: Stringent environmental regulations in various regions are driving the adoption of eco-friendly TPS materials.
- Competitive Substitutes: Bio-based polymers, elastomers, and other synthetic materials are key competitors.
- End-User Demographics: Demand is driven primarily by the automotive, healthcare, footwear, and packaging industries.
TPS Industry Growth Trends & Insights
The global TPS market witnessed significant growth during the historical period (2019-2024), driven by increasing demand across diverse applications. The market is expected to continue its growth trajectory throughout the forecast period (2025-2033), exhibiting a Compound Annual Growth Rate (CAGR) of xx% during this period. This growth is fueled by the rising adoption of TPS in diverse sectors, including automotive, construction, and healthcare. Technological advancements leading to improved material properties and sustainability are further boosting market expansion. Consumer preference for eco-friendly options contributes to the growth of bio-based TPS. Market penetration is estimated at xx% in 2025 and is projected to reach xx% by 2033.
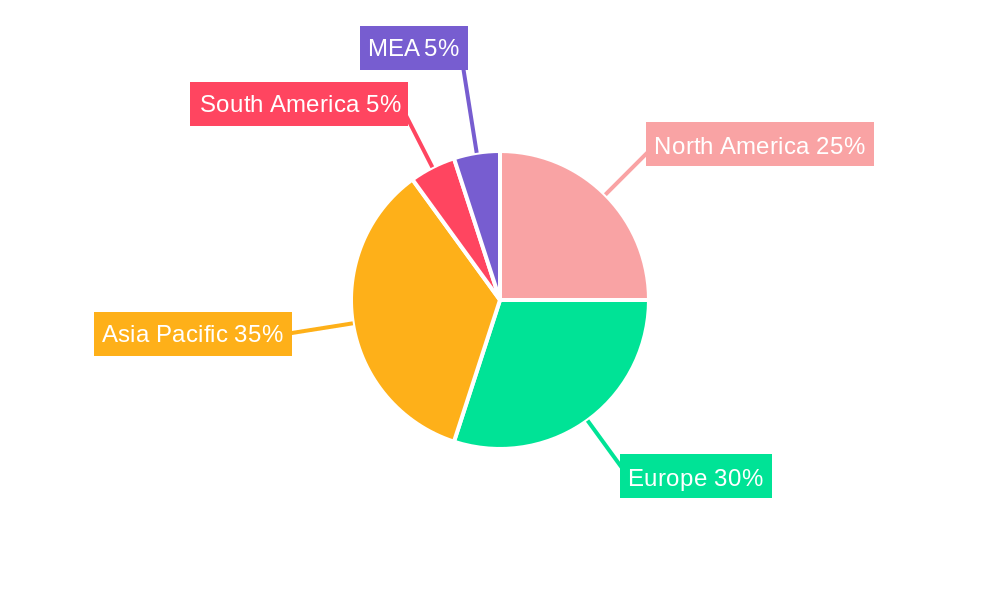
Dominant Regions, Countries, or Segments in TPS Industry
The dominant regions for TPS production and consumption are North America and Europe, collectively accounting for approximately xx% of the global market share in 2025. Within these regions, countries with well-established manufacturing infrastructure and robust automotive and packaging sectors exhibit higher growth rates. Within the manufacturing type, Extrusion Molding holds a larger market share compared to Injection Molding due to its higher production efficiency and suitability for a wider range of applications. In terms of application, Films segment dominates, followed by Bags, driven by high demand from the packaging industry. The 3D Print application shows significant growth potential.
- Key Drivers for North America: Strong automotive sector, well-developed manufacturing infrastructure, and favorable government policies supporting sustainable materials.
- Key Drivers for Europe: High demand from the automotive and packaging industries, coupled with stringent environmental regulations promoting the adoption of eco-friendly materials.
- Market Share: North America (xx%), Europe (xx%), Asia Pacific (xx%), Rest of the World (xx%) (2025 estimates).
- Growth Potential: Asia-Pacific shows the highest growth potential due to increasing industrialization and rising consumer spending.
TPS Industry Product Landscape
The TPS industry offers a wide range of products with varying properties tailored to specific applications. These products are distinguished by their flexibility, durability, and resistance to abrasion and chemicals. Recent innovations focus on enhancing biodegradability and reducing environmental impact. Product differentiation strategies include enhanced strength, improved elasticity, and customized colors. Technological advancements are driven by the use of novel additives, processing techniques, and bio-based raw materials.
Key Drivers, Barriers & Challenges in TPS Industry
Key Drivers: Growing demand from the automotive and healthcare sectors, rising consumer preference for sustainable materials, technological advancements in bio-based TPS, and supportive government policies promoting the use of renewable materials.
Key Barriers & Challenges: Fluctuations in raw material prices, stringent regulatory compliance requirements, competitive pressures from alternative materials, and the complexity and cost associated with developing and implementing bio-based TPS solutions. Supply chain disruptions during the historical period caused a xx% reduction in production output in 2022 (estimated).
Emerging Opportunities in TPS Industry
Emerging opportunities lie in untapped markets like sustainable packaging and biodegradable medical devices. The growing demand for eco-friendly materials and increasing R&D investments in bio-based TPS create significant growth prospects. The development of innovative applications in areas such as flexible electronics and 3D printing also offer promising opportunities.
Growth Accelerators in the TPS Industry Industry
Strategic partnerships between material producers and end-users will be crucial to fostering innovation and accelerating market growth. Technological breakthroughs in bio-based TPS synthesis and processing are expected to drive long-term growth. Market expansion into developing economies with growing industrialization offers significant potential.
Key Players Shaping the TPS Industry Market
- Kuraray Co Ltd
- Rodenburg Biopolymers
- Versalis SpA
- Biologiq Inc
- AGRANA Beteiligungs-AG
- Biotec Biologische Naturverpackungen GmbH & Co KG
- Cardia Bioplastics
- Grupa Azoty SA
- Biome Bioplastics Limited
- Great Wrap
Notable Milestones in TPS Industry Sector
- October 2023: Versalis' acquisition of Novamont SpA significantly strengthened its bio-based product portfolio.
- March 2023: Great Wrap launched the world's first compostable pallet wrap made from food waste, significantly expanding its production capacity.
In-Depth TPS Industry Market Outlook
The TPS industry is poised for continued growth, driven by technological innovations, increasing demand for sustainable solutions, and strategic partnerships. The long-term outlook is positive, with significant opportunities for companies focused on developing bio-based and high-performance TPS materials. The potential for market expansion into new applications and emerging economies remains substantial.
TPS Industry Segmentation
-
1. Manufacturing Type
- 1.1. Extrusion Molding
-
2. Application
- 2.1. Bags
- 2.2. Films
- 2.3. 3D Print
- 2.4. Other Applications
TPS Industry Segmentation By Geography
-
1. Asia Pacific
- 1.1. China
- 1.2. India
- 1.3. Japan
- 1.4. South Korea
- 1.5. ASEAN Countries
- 1.6. Rest of Asia Pacific
-
2. North America
- 2.1. United States
- 2.2. Canada
- 2.3. Mexico
-
3. Europe
- 3.1. Germany
- 3.2. United Kingdom
- 3.3. Italy
- 3.4. France
- 3.5. NORDIC Countries
- 3.6. Rest of Europe
-
4. Rest of the World
- 4.1. South America
- 4.2. Middle East and Africa
TPS Industry Regional Market Share
Geographic Coverage of TPS Industry
TPS Industry REPORT HIGHLIGHTS
| Aspects | Details |
|---|---|
| Study Period | 2020-2034 |
| Base Year | 2025 |
| Estimated Year | 2026 |
| Forecast Period | 2026-2034 |
| Historical Period | 2020-2025 |
| Growth Rate | CAGR of 8.3% from 2020-2034 |
| Segmentation |
|
Table of Contents
- 1. Introduction
- 1.1. Research Scope
- 1.2. Market Segmentation
- 1.3. Research Objective
- 1.4. Definitions and Assumptions
- 2. Executive Summary
- 2.1. Market Snapshot
- 3. Market Dynamics
- 3.1. Market Drivers
- 3.2. Market Restrains
- 3.3. Market Trends
- 3.4. Market Opportunities
- 4. Market Factor Analysis
- 4.1. Porters Five Forces
- 4.1.1. Bargaining Power of Suppliers
- 4.1.2. Bargaining Power of Buyers
- 4.1.3. Threat of New Entrants
- 4.1.4. Threat of Substitutes
- 4.1.5. Competitive Rivalry
- 4.2. PESTEL analysis
- 4.3. BCG Analysis
- 4.3.1. Stars (High Growth, High Market Share)
- 4.3.2. Cash Cows (Low Growth, High Market Share)
- 4.3.3. Question Mark (High Growth, Low Market Share)
- 4.3.4. Dogs (Low Growth, Low Market Share)
- 4.4. Ansoff Matrix Analysis
- 4.5. Supply Chain Analysis
- 4.6. Regulatory Landscape
- 4.7. Current Market Potential and Opportunity Assessment (TAM–SAM–SOM Framework)
- 4.8. VDR Analyst Note
- 4.1. Porters Five Forces
- 5. Market Analysis, Insights and Forecast 2021-2033
- 5.1. Market Analysis, Insights and Forecast - by Manufacturing Type
- 5.1.1. Extrusion Molding
- 5.2. Market Analysis, Insights and Forecast - by Application
- 5.2.1. Bags
- 5.2.2. Films
- 5.2.3. 3D Print
- 5.2.4. Other Applications
- 5.3. Market Analysis, Insights and Forecast - by Region
- 5.3.1. Asia Pacific
- 5.3.2. North America
- 5.3.3. Europe
- 5.3.4. Rest of the World
- 5.1. Market Analysis, Insights and Forecast - by Manufacturing Type
- 6. Global TPS Industry Analysis, Insights and Forecast, 2021-2033
- 6.1. Market Analysis, Insights and Forecast - by Manufacturing Type
- 6.1.1. Extrusion Molding
- 6.2. Market Analysis, Insights and Forecast - by Application
- 6.2.1. Bags
- 6.2.2. Films
- 6.2.3. 3D Print
- 6.2.4. Other Applications
- 6.1. Market Analysis, Insights and Forecast - by Manufacturing Type
- 7. Asia Pacific TPS Industry Analysis, Insights and Forecast, 2021-2033
- 7.1. Market Analysis, Insights and Forecast - by Manufacturing Type
- 7.1.1. Extrusion Molding
- 7.2. Market Analysis, Insights and Forecast - by Application
- 7.2.1. Bags
- 7.2.2. Films
- 7.2.3. 3D Print
- 7.2.4. Other Applications
- 7.1. Market Analysis, Insights and Forecast - by Manufacturing Type
- 8. North America TPS Industry Analysis, Insights and Forecast, 2021-2033
- 8.1. Market Analysis, Insights and Forecast - by Manufacturing Type
- 8.1.1. Extrusion Molding
- 8.2. Market Analysis, Insights and Forecast - by Application
- 8.2.1. Bags
- 8.2.2. Films
- 8.2.3. 3D Print
- 8.2.4. Other Applications
- 8.1. Market Analysis, Insights and Forecast - by Manufacturing Type
- 9. Europe TPS Industry Analysis, Insights and Forecast, 2021-2033
- 9.1. Market Analysis, Insights and Forecast - by Manufacturing Type
- 9.1.1. Extrusion Molding
- 9.2. Market Analysis, Insights and Forecast - by Application
- 9.2.1. Bags
- 9.2.2. Films
- 9.2.3. 3D Print
- 9.2.4. Other Applications
- 9.1. Market Analysis, Insights and Forecast - by Manufacturing Type
- 10. Rest of the World TPS Industry Analysis, Insights and Forecast, 2021-2033
- 10.1. Market Analysis, Insights and Forecast - by Manufacturing Type
- 10.1.1. Extrusion Molding
- 10.2. Market Analysis, Insights and Forecast - by Application
- 10.2.1. Bags
- 10.2.2. Films
- 10.2.3. 3D Print
- 10.2.4. Other Applications
- 10.1. Market Analysis, Insights and Forecast - by Manufacturing Type
- 11. Competitive Analysis
- 11.1. Company Profiles
- 11.1.1 Kuraray Co Ltd
- 11.1.1.1. Company Overview
- 11.1.1.2. Products
- 11.1.1.3. Company Financials
- 11.1.1.4. SWOT Analysis
- 11.1.2 Rodenburg Biopolymers
- 11.1.2.1. Company Overview
- 11.1.2.2. Products
- 11.1.2.3. Company Financials
- 11.1.2.4. SWOT Analysis
- 11.1.3 Versalis SpA *List Not Exhaustive
- 11.1.3.1. Company Overview
- 11.1.3.2. Products
- 11.1.3.3. Company Financials
- 11.1.3.4. SWOT Analysis
- 11.1.4 Biologiq Inc
- 11.1.4.1. Company Overview
- 11.1.4.2. Products
- 11.1.4.3. Company Financials
- 11.1.4.4. SWOT Analysis
- 11.1.5 AGRANA Beteiligungs-AG
- 11.1.5.1. Company Overview
- 11.1.5.2. Products
- 11.1.5.3. Company Financials
- 11.1.5.4. SWOT Analysis
- 11.1.6 Biotec Biologische Naturverpackungen GmbH & Co KG
- 11.1.6.1. Company Overview
- 11.1.6.2. Products
- 11.1.6.3. Company Financials
- 11.1.6.4. SWOT Analysis
- 11.1.7 Cardia Bioplastics
- 11.1.7.1. Company Overview
- 11.1.7.2. Products
- 11.1.7.3. Company Financials
- 11.1.7.4. SWOT Analysis
- 11.1.8 Grupa Azoty SA
- 11.1.8.1. Company Overview
- 11.1.8.2. Products
- 11.1.8.3. Company Financials
- 11.1.8.4. SWOT Analysis
- 11.1.9 Biome Bioplastics Limited
- 11.1.9.1. Company Overview
- 11.1.9.2. Products
- 11.1.9.3. Company Financials
- 11.1.9.4. SWOT Analysis
- 11.1.10 Great Wrap
- 11.1.10.1. Company Overview
- 11.1.10.2. Products
- 11.1.10.3. Company Financials
- 11.1.10.4. SWOT Analysis
- 11.1.1 Kuraray Co Ltd
- 11.2. Market Entropy
- 11.2.1 Company's Key Areas Served
- 11.2.2 Recent Developments
- 11.3. Company Market Share Analysis 2025
- 11.3.1 Top 5 Companies Market Share Analysis
- 11.3.2 Top 3 Companies Market Share Analysis
- 11.4. List of Potential Customers
- 12. Research Methodology
List of Figures
- Figure 1: Global TPS Industry Revenue Breakdown (million, %) by Region 2025 & 2033
- Figure 2: Global TPS Industry Volume Breakdown (kilotons, %) by Region 2025 & 2033
- Figure 3: Asia Pacific TPS Industry Revenue (million), by Manufacturing Type 2025 & 2033
- Figure 4: Asia Pacific TPS Industry Volume (kilotons), by Manufacturing Type 2025 & 2033
- Figure 5: Asia Pacific TPS Industry Revenue Share (%), by Manufacturing Type 2025 & 2033
- Figure 6: Asia Pacific TPS Industry Volume Share (%), by Manufacturing Type 2025 & 2033
- Figure 7: Asia Pacific TPS Industry Revenue (million), by Application 2025 & 2033
- Figure 8: Asia Pacific TPS Industry Volume (kilotons), by Application 2025 & 2033
- Figure 9: Asia Pacific TPS Industry Revenue Share (%), by Application 2025 & 2033
- Figure 10: Asia Pacific TPS Industry Volume Share (%), by Application 2025 & 2033
- Figure 11: Asia Pacific TPS Industry Revenue (million), by Country 2025 & 2033
- Figure 12: Asia Pacific TPS Industry Volume (kilotons), by Country 2025 & 2033
- Figure 13: Asia Pacific TPS Industry Revenue Share (%), by Country 2025 & 2033
- Figure 14: Asia Pacific TPS Industry Volume Share (%), by Country 2025 & 2033
- Figure 15: North America TPS Industry Revenue (million), by Manufacturing Type 2025 & 2033
- Figure 16: North America TPS Industry Volume (kilotons), by Manufacturing Type 2025 & 2033
- Figure 17: North America TPS Industry Revenue Share (%), by Manufacturing Type 2025 & 2033
- Figure 18: North America TPS Industry Volume Share (%), by Manufacturing Type 2025 & 2033
- Figure 19: North America TPS Industry Revenue (million), by Application 2025 & 2033
- Figure 20: North America TPS Industry Volume (kilotons), by Application 2025 & 2033
- Figure 21: North America TPS Industry Revenue Share (%), by Application 2025 & 2033
- Figure 22: North America TPS Industry Volume Share (%), by Application 2025 & 2033
- Figure 23: North America TPS Industry Revenue (million), by Country 2025 & 2033
- Figure 24: North America TPS Industry Volume (kilotons), by Country 2025 & 2033
- Figure 25: North America TPS Industry Revenue Share (%), by Country 2025 & 2033
- Figure 26: North America TPS Industry Volume Share (%), by Country 2025 & 2033
- Figure 27: Europe TPS Industry Revenue (million), by Manufacturing Type 2025 & 2033
- Figure 28: Europe TPS Industry Volume (kilotons), by Manufacturing Type 2025 & 2033
- Figure 29: Europe TPS Industry Revenue Share (%), by Manufacturing Type 2025 & 2033
- Figure 30: Europe TPS Industry Volume Share (%), by Manufacturing Type 2025 & 2033
- Figure 31: Europe TPS Industry Revenue (million), by Application 2025 & 2033
- Figure 32: Europe TPS Industry Volume (kilotons), by Application 2025 & 2033
- Figure 33: Europe TPS Industry Revenue Share (%), by Application 2025 & 2033
- Figure 34: Europe TPS Industry Volume Share (%), by Application 2025 & 2033
- Figure 35: Europe TPS Industry Revenue (million), by Country 2025 & 2033
- Figure 36: Europe TPS Industry Volume (kilotons), by Country 2025 & 2033
- Figure 37: Europe TPS Industry Revenue Share (%), by Country 2025 & 2033
- Figure 38: Europe TPS Industry Volume Share (%), by Country 2025 & 2033
- Figure 39: Rest of the World TPS Industry Revenue (million), by Manufacturing Type 2025 & 2033
- Figure 40: Rest of the World TPS Industry Volume (kilotons), by Manufacturing Type 2025 & 2033
- Figure 41: Rest of the World TPS Industry Revenue Share (%), by Manufacturing Type 2025 & 2033
- Figure 42: Rest of the World TPS Industry Volume Share (%), by Manufacturing Type 2025 & 2033
- Figure 43: Rest of the World TPS Industry Revenue (million), by Application 2025 & 2033
- Figure 44: Rest of the World TPS Industry Volume (kilotons), by Application 2025 & 2033
- Figure 45: Rest of the World TPS Industry Revenue Share (%), by Application 2025 & 2033
- Figure 46: Rest of the World TPS Industry Volume Share (%), by Application 2025 & 2033
- Figure 47: Rest of the World TPS Industry Revenue (million), by Country 2025 & 2033
- Figure 48: Rest of the World TPS Industry Volume (kilotons), by Country 2025 & 2033
- Figure 49: Rest of the World TPS Industry Revenue Share (%), by Country 2025 & 2033
- Figure 50: Rest of the World TPS Industry Volume Share (%), by Country 2025 & 2033
List of Tables
- Table 1: Global TPS Industry Revenue million Forecast, by Manufacturing Type 2020 & 2033
- Table 2: Global TPS Industry Volume kilotons Forecast, by Manufacturing Type 2020 & 2033
- Table 3: Global TPS Industry Revenue million Forecast, by Application 2020 & 2033
- Table 4: Global TPS Industry Volume kilotons Forecast, by Application 2020 & 2033
- Table 5: Global TPS Industry Revenue million Forecast, by Region 2020 & 2033
- Table 6: Global TPS Industry Volume kilotons Forecast, by Region 2020 & 2033
- Table 7: Global TPS Industry Revenue million Forecast, by Manufacturing Type 2020 & 2033
- Table 8: Global TPS Industry Volume kilotons Forecast, by Manufacturing Type 2020 & 2033
- Table 9: Global TPS Industry Revenue million Forecast, by Application 2020 & 2033
- Table 10: Global TPS Industry Volume kilotons Forecast, by Application 2020 & 2033
- Table 11: Global TPS Industry Revenue million Forecast, by Country 2020 & 2033
- Table 12: Global TPS Industry Volume kilotons Forecast, by Country 2020 & 2033
- Table 13: China TPS Industry Revenue (million) Forecast, by Application 2020 & 2033
- Table 14: China TPS Industry Volume (kilotons) Forecast, by Application 2020 & 2033
- Table 15: India TPS Industry Revenue (million) Forecast, by Application 2020 & 2033
- Table 16: India TPS Industry Volume (kilotons) Forecast, by Application 2020 & 2033
- Table 17: Japan TPS Industry Revenue (million) Forecast, by Application 2020 & 2033
- Table 18: Japan TPS Industry Volume (kilotons) Forecast, by Application 2020 & 2033
- Table 19: South Korea TPS Industry Revenue (million) Forecast, by Application 2020 & 2033
- Table 20: South Korea TPS Industry Volume (kilotons) Forecast, by Application 2020 & 2033
- Table 21: ASEAN Countries TPS Industry Revenue (million) Forecast, by Application 2020 & 2033
- Table 22: ASEAN Countries TPS Industry Volume (kilotons) Forecast, by Application 2020 & 2033
- Table 23: Rest of Asia Pacific TPS Industry Revenue (million) Forecast, by Application 2020 & 2033
- Table 24: Rest of Asia Pacific TPS Industry Volume (kilotons) Forecast, by Application 2020 & 2033
- Table 25: Global TPS Industry Revenue million Forecast, by Manufacturing Type 2020 & 2033
- Table 26: Global TPS Industry Volume kilotons Forecast, by Manufacturing Type 2020 & 2033
- Table 27: Global TPS Industry Revenue million Forecast, by Application 2020 & 2033
- Table 28: Global TPS Industry Volume kilotons Forecast, by Application 2020 & 2033
- Table 29: Global TPS Industry Revenue million Forecast, by Country 2020 & 2033
- Table 30: Global TPS Industry Volume kilotons Forecast, by Country 2020 & 2033
- Table 31: United States TPS Industry Revenue (million) Forecast, by Application 2020 & 2033
- Table 32: United States TPS Industry Volume (kilotons) Forecast, by Application 2020 & 2033
- Table 33: Canada TPS Industry Revenue (million) Forecast, by Application 2020 & 2033
- Table 34: Canada TPS Industry Volume (kilotons) Forecast, by Application 2020 & 2033
- Table 35: Mexico TPS Industry Revenue (million) Forecast, by Application 2020 & 2033
- Table 36: Mexico TPS Industry Volume (kilotons) Forecast, by Application 2020 & 2033
- Table 37: Global TPS Industry Revenue million Forecast, by Manufacturing Type 2020 & 2033
- Table 38: Global TPS Industry Volume kilotons Forecast, by Manufacturing Type 2020 & 2033
- Table 39: Global TPS Industry Revenue million Forecast, by Application 2020 & 2033
- Table 40: Global TPS Industry Volume kilotons Forecast, by Application 2020 & 2033
- Table 41: Global TPS Industry Revenue million Forecast, by Country 2020 & 2033
- Table 42: Global TPS Industry Volume kilotons Forecast, by Country 2020 & 2033
- Table 43: Germany TPS Industry Revenue (million) Forecast, by Application 2020 & 2033
- Table 44: Germany TPS Industry Volume (kilotons) Forecast, by Application 2020 & 2033
- Table 45: United Kingdom TPS Industry Revenue (million) Forecast, by Application 2020 & 2033
- Table 46: United Kingdom TPS Industry Volume (kilotons) Forecast, by Application 2020 & 2033
- Table 47: Italy TPS Industry Revenue (million) Forecast, by Application 2020 & 2033
- Table 48: Italy TPS Industry Volume (kilotons) Forecast, by Application 2020 & 2033
- Table 49: France TPS Industry Revenue (million) Forecast, by Application 2020 & 2033
- Table 50: France TPS Industry Volume (kilotons) Forecast, by Application 2020 & 2033
- Table 51: NORDIC Countries TPS Industry Revenue (million) Forecast, by Application 2020 & 2033
- Table 52: NORDIC Countries TPS Industry Volume (kilotons) Forecast, by Application 2020 & 2033
- Table 53: Rest of Europe TPS Industry Revenue (million) Forecast, by Application 2020 & 2033
- Table 54: Rest of Europe TPS Industry Volume (kilotons) Forecast, by Application 2020 & 2033
- Table 55: Global TPS Industry Revenue million Forecast, by Manufacturing Type 2020 & 2033
- Table 56: Global TPS Industry Volume kilotons Forecast, by Manufacturing Type 2020 & 2033
- Table 57: Global TPS Industry Revenue million Forecast, by Application 2020 & 2033
- Table 58: Global TPS Industry Volume kilotons Forecast, by Application 2020 & 2033
- Table 59: Global TPS Industry Revenue million Forecast, by Country 2020 & 2033
- Table 60: Global TPS Industry Volume kilotons Forecast, by Country 2020 & 2033
- Table 61: South America TPS Industry Revenue (million) Forecast, by Application 2020 & 2033
- Table 62: South America TPS Industry Volume (kilotons) Forecast, by Application 2020 & 2033
- Table 63: Middle East and Africa TPS Industry Revenue (million) Forecast, by Application 2020 & 2033
- Table 64: Middle East and Africa TPS Industry Volume (kilotons) Forecast, by Application 2020 & 2033
Frequently Asked Questions
1. What is the projected Compound Annual Growth Rate (CAGR) of the TPS Industry?
The projected CAGR is approximately 8.3%.
2. Which companies are prominent players in the TPS Industry?
Key companies in the market include Kuraray Co Ltd, Rodenburg Biopolymers, Versalis SpA *List Not Exhaustive, Biologiq Inc, AGRANA Beteiligungs-AG, Biotec Biologische Naturverpackungen GmbH & Co KG, Cardia Bioplastics, Grupa Azoty SA, Biome Bioplastics Limited, Great Wrap.
3. What are the main segments of the TPS Industry?
The market segments include Manufacturing Type, Application.
4. Can you provide details about the market size?
The market size is estimated to be USD 556.7 million as of 2022.
5. What are some drivers contributing to market growth?
Increasing Demand from the Packaging Industry; Favorable Government Policies Promoting Bio-plastics.
6. What are the notable trends driving market growth?
Films Segment to Dominate the Market.
7. Are there any restraints impacting market growth?
Multiple Technical Constrains Associated with TPS.
8. Can you provide examples of recent developments in the market?
October 2023: Versalis announced its acquisition of Novamont SpA. Through this acquisition, Versalis aimed to strengthen its bio-based product portfolio significantly.
9. What pricing options are available for accessing the report?
Pricing options include single-user, multi-user, and enterprise licenses priced at USD 4750, USD 5250, and USD 8750 respectively.
10. Is the market size provided in terms of value or volume?
The market size is provided in terms of value, measured in million and volume, measured in kilotons.
11. Are there any specific market keywords associated with the report?
Yes, the market keyword associated with the report is "TPS Industry," which aids in identifying and referencing the specific market segment covered.
12. How do I determine which pricing option suits my needs best?
The pricing options vary based on user requirements and access needs. Individual users may opt for single-user licenses, while businesses requiring broader access may choose multi-user or enterprise licenses for cost-effective access to the report.
13. Are there any additional resources or data provided in the TPS Industry report?
While the report offers comprehensive insights, it's advisable to review the specific contents or supplementary materials provided to ascertain if additional resources or data are available.
14. How can I stay updated on further developments or reports in the TPS Industry?
To stay informed about further developments, trends, and reports in the TPS Industry, consider subscribing to industry newsletters, following relevant companies and organizations, or regularly checking reputable industry news sources and publications.
Methodology
Step 1 - Identification of Relevant Samples Size from Population Database


Step 2 - Approaches for Defining Global Market Size (Value, Volume* & Price*)

Note*: In applicable scenarios
Step 3 - Data Sources
Primary Research
- Web Analytics
- Survey Reports
- Research Institute
- Latest Research Reports
- Opinion Leaders
Secondary Research
- Annual Reports
- White Paper
- Latest Press Release
- Industry Association
- Paid Database
- Investor Presentations

Step 4 - Data Triangulation
Involves using different sources of information in order to increase the validity of a study
These sources are likely to be stakeholders in a program - participants, other researchers, program staff, other community members, and so on.
Then we put all data in single framework & apply various statistical tools to find out the dynamic on the market.
During the analysis stage, feedback from the stakeholder groups would be compared to determine areas of agreement as well as areas of divergence