

Key Insights
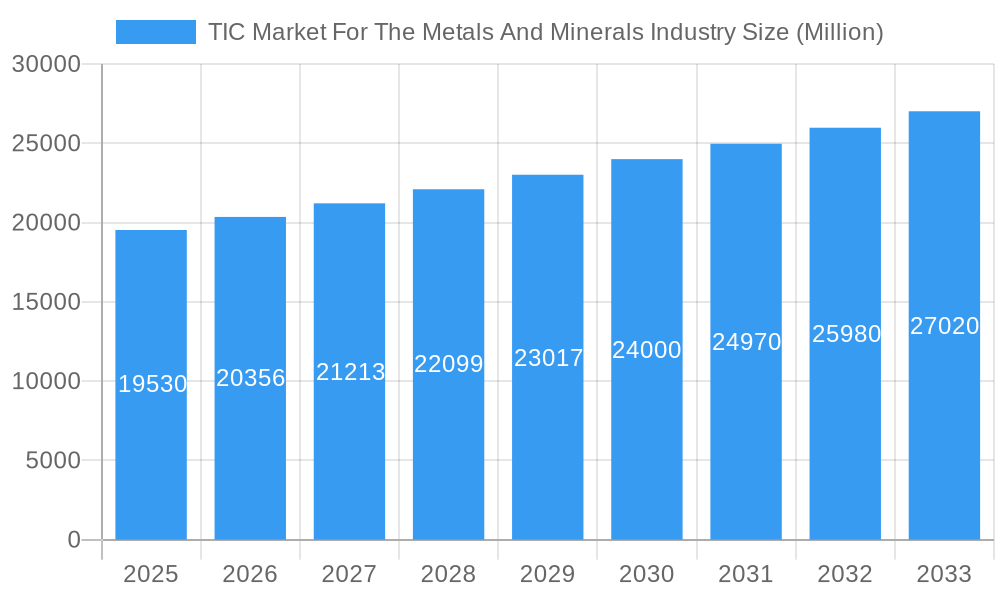
The global Third-Party Inspection (TIC) market for the metals and minerals industry is experiencing robust growth, projected to reach $19.53 billion in 2025 and maintain a Compound Annual Growth Rate (CAGR) of 4.30% from 2025 to 2033. This expansion is fueled by several key factors. Increased demand for high-quality metals and minerals in construction, automotive, and manufacturing sectors necessitates stringent quality control and assurance throughout the supply chain. Growing regulatory scrutiny and emphasis on safety and environmental compliance further drive the need for independent TIC services. The industry is witnessing a trend toward advanced analytical techniques and digitalization, improving efficiency and accuracy of inspection processes. This includes the adoption of automation, AI, and data analytics for faster, more reliable results. Furthermore, the increasing complexity of global supply chains necessitates robust risk management strategies, making TIC services crucial for mitigating potential disruptions and ensuring product integrity. Leading players such as SGS, Bureau Veritas, Intertek, and TÜV SÜD are driving innovation and expanding their service portfolios to meet evolving industry needs. However, factors like fluctuating commodity prices and economic uncertainty can present challenges to market growth.
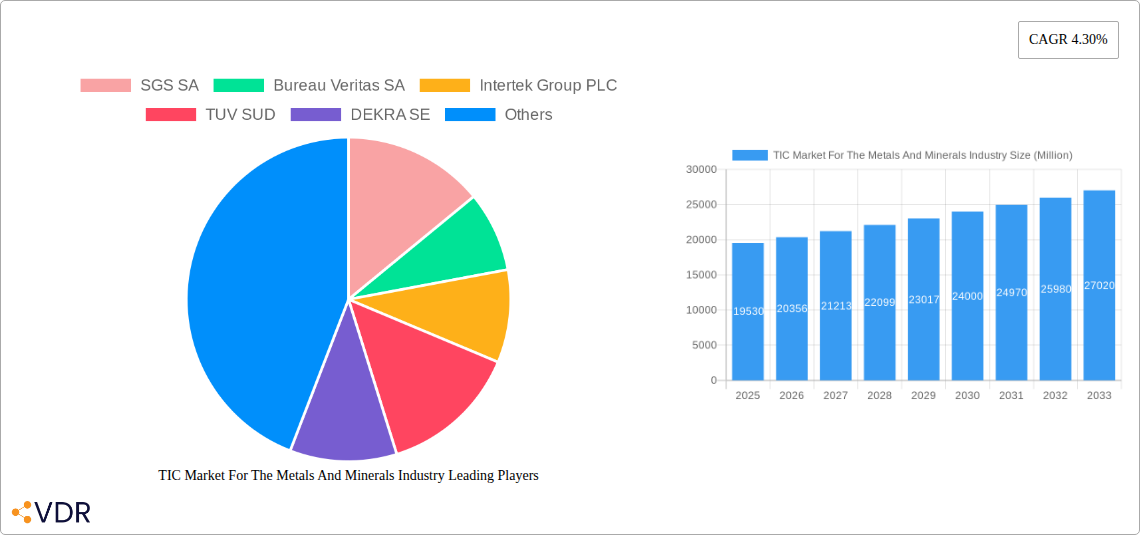
TIC Market For The Metals And Minerals Industry Market Size (In Billion)
Despite potential headwinds, the long-term outlook for the TIC market in the metals and minerals industry remains positive. Continued industrialization in developing economies and the expanding application of metals and minerals in various sectors create sustained demand. The integration of cutting-edge technologies and the emphasis on data-driven decision-making will be instrumental in shaping the future of the TIC market. Companies are investing heavily in R&D to enhance their service offerings, improve operational efficiency, and develop specialized solutions for niche segments within the industry. This competitive landscape encourages continuous innovation and ensures the delivery of high-quality, reliable TIC services that meet the evolving demands of clients across the globe. The market is expected to continue its growth trajectory, driven by the inherent need for quality assurance and risk mitigation in this critical sector.
TIC Market For The Metals And Minerals Industry Company Market Share
TIC Market For The Metals And Minerals Industry: A Comprehensive Report (2019-2033)
This comprehensive report provides an in-depth analysis of the Testing, Inspection, and Certification (TIC) market for the metals and minerals industry, covering the period from 2019 to 2033. It offers crucial insights for industry professionals, investors, and strategic decision-makers seeking to understand market dynamics, growth trends, and future opportunities within this rapidly evolving sector. The report incorporates data valued in million units.
TIC Market For The Metals And Minerals Industry Market Dynamics & Structure
The global Testing, Inspection, and Certification (TIC) market for the metals and minerals industry is characterized by a moderately concentrated structure, with a significant presence of large, established multinational corporations that command a substantial share of the market. The market's trajectory and operational dynamics are continuously shaped by a confluence of interconnected factors:
- Technological Innovation: The relentless pursuit of efficiency and the expansion of service capabilities are significantly propelled by advancements in analytical techniques, sophisticated automation, and powerful data analytics. The integration of Artificial Intelligence (AI) and Machine Learning (ML) is proving particularly transformative, enabling more predictive, precise, and comprehensive testing and inspection processes.
- Evolving Regulatory Frameworks: Increasingly stringent global and regional safety, environmental, and quality standards are a primary impetus for the demand for TIC services. Compliance with regulations concerning environmental impact, product liability, and material integrity is paramount. These regulatory landscapes are dynamic and vary considerably across different geographical regions, necessitating specialized expertise.
- Competitive Product Substitutes: While direct substitutes for comprehensive TIC services are limited, the market does experience indirect competition from the internal testing and quality control departments of larger, vertically integrated companies. The extent of this competition is often dependent on the scale of the organization and the inherent complexity and specialized nature of the required testing procedures.
- End-User Demographics: The primary demand drivers for TIC services in this sector originate from key industry participants including mining and mineral processing companies, steel manufacturers, and the broader construction industry. The growth trajectory of the TIC market is thus intrinsically linked to global infrastructure development initiatives, industrial expansion, and the overall health of the manufacturing and construction sectors.
- Mergers & Acquisitions (M&A) Trends: The metals and minerals TIC sector has been an active arena for strategic mergers and acquisitions. This trend facilitates market consolidation, allowing larger entities to broaden their service portfolios, enhance their geographical reach, and strengthen their competitive positions. During the historical period of 2019-2024, the average number of M&A deals per year was approximately xx, contributing to an estimated xx% increase in market concentration.
The primary barriers to innovation within this market are substantial, encompassing the significant capital investment required for state-of-the-art technologies and laboratory infrastructure. Furthermore, navigating complex and evolving regulatory approval processes and securing a workforce with specialized skills represent considerable hurdles. In 2025, the market share among the top 5 players is estimated at xx%, with projections indicating an increase to approximately xx% by 2033.
TIC Market For The Metals And Minerals Industry Growth Trends & Insights
The global TIC market for metals and minerals has witnessed robust growth over the historical period (2019-2024). Driven by increasing industrialization, infrastructure development, and stricter regulatory compliance, the market size expanded from xx million in 2019 to xx million in 2024, exhibiting a CAGR of xx%. This positive trend is expected to continue throughout the forecast period (2025-2033), with the market size projected to reach xx million by 2033 and a forecasted CAGR of xx%. Market penetration within the metals and minerals sector increased from xx% in 2019 to xx% in 2024, reflecting a growing adoption of TIC services across the value chain. Technological disruptions, particularly the integration of advanced analytics and automation, are accelerating efficiency gains and driving cost reductions, further boosting market growth. Changes in consumer preferences towards sustainable and ethically sourced materials are also creating opportunities within the TIC market, as companies increasingly seek to verify the sustainability credentials of their supply chains. Emerging economies, particularly in Asia-Pacific and Africa, are expected to be key drivers of future growth.
Dominant Regions, Countries, or Segments in TIC Market For The Metals And Minerals Industry
North America currently holds the largest market share, driven by robust industrial activity and stringent regulatory requirements. However, the Asia-Pacific region is expected to experience the fastest growth rate throughout the forecast period (2025-2033), fueled by rapid industrialization and infrastructure development in countries such as China, India, and Southeast Asian nations.
- Key Drivers for North America: Strong regulatory environment, established industrial base, high adoption rates for advanced testing technologies.
- Key Drivers for Asia-Pacific: Rapid industrialization, rising infrastructure investments, increasing government focus on quality and safety.
- Key Drivers for Europe: Stringent environmental regulations, focus on sustainable practices, presence of established TIC players.
While North America maintains a dominant position in terms of market size, the Asia-Pacific region's growth trajectory suggests a potential shift in market leadership in the long term. The dominance is attributable to both factors: a large manufacturing base and strong regulatory oversight, which are driving demand for testing, inspection, and certification services.
TIC Market For The Metals And Minerals Industry Product Landscape
The TIC market for the metals and minerals industry offers a wide array of services, including chemical analysis, mechanical testing, non-destructive testing (NDT), metallurgical testing, and environmental monitoring. Technological advancements have led to the development of more sophisticated and precise testing methods, resulting in improved accuracy and efficiency. Unique selling propositions often focus on specialized expertise in specific materials, rapid turnaround times, and advanced analytical capabilities. The integration of digital technologies, such as data analytics and automation, is enhancing the value proposition of TIC services.
Key Drivers, Barriers & Challenges in TIC Market For The Metals And Minerals Industry
Key Drivers:
- The escalating global demand for robust quality assurance, reliability, and unwavering regulatory compliance across the entire metals and minerals value chain.
- The increasing stringency and complexity of safety, environmental, and industry-specific standards, compelling companies to seek external expertise for verification.
- Continuous technological advancements in testing methodologies, analytical instrumentation, and digital solutions that enhance accuracy, speed, and scope of TIC services.
- The sustained growth and expansion of the construction and infrastructure sectors, both domestically and internationally, which directly translate to increased demand for material testing and certification.
Key Challenges:
- The substantial capital expenditure necessitated by the acquisition and maintenance of advanced testing equipment and laboratory facilities.
- Persistent shortages of highly skilled and specialized labor required to operate sophisticated equipment and interpret complex testing results.
- Intense and often price-sensitive competition among a growing number of established and emerging TIC providers.
- Vulnerability to supply chain disruptions, which can impact the availability of critical testing materials, reagents, and consumables. These disruptions, which were estimated to have caused a xx% reduction in testing capacity in 2023, are projected to gradually subside and resolve by 2026.
Emerging Opportunities in TIC Market For The Metals And Minerals Industry
- Growing demand for sustainable and ethical sourcing practices, leading to increased demand for related TIC services.
- Expansion of the renewable energy sector creates opportunities for testing and certification of materials used in wind turbines, solar panels, and other renewable energy technologies.
- Increasing focus on digitalization and data analytics within the industry offers opportunities for TIC providers to develop and integrate innovative data-driven solutions.
Growth Accelerators in the TIC Market For The Metals And Minerals Industry Industry
The continuous evolution of materials science and the development of novel, more sophisticated testing and inspection methodologies are foundational growth accelerators. Strategic collaborations and partnerships between TIC providers, raw material suppliers, and end-product manufacturers are fostering significant synergies. These alliances enable the creation of integrated, end-to-end solutions and expand the market reach for specialized TIC services. Furthermore, the strategic expansion of operations into burgeoning emerging economies and previously underserved markets presents substantial untapped growth potential, driven by increasing industrialization and infrastructure development in these regions.
Key Players Shaping the TIC Market For The Metals And Minerals Industry Market
- SGS SA
- Bureau Veritas SA
- Intertek Group PLC
- TUV SUD
- DEKRA SE
- ALS Limited
- Applus+
- Eurofins Scientific SE
- DNV Group AS
- Element Materials Technology Group Limited
- Mistras Group Inc
- Kiwa NV
- UL Solutions Inc
- Rina SPA
- Qima
- Westmoreland Mechanical Testing and Research Inc
- Laboratory Testing Inc
- NSL Analytical Services Inc
- IMR Test Labs (Curtiss Wright Corporation)
- Applied Technical Services LLC *List Not Exhaustive
Notable Milestones in TIC Market For The Metals And Minerals Industry Sector
- August 2024: Element Materials Technology made a significant investment of USD 13 million to establish two new state-of-the-art laboratories in Canada. This expansion specifically enhances their capabilities in advanced metals testing and materials characterization, responding to the heightened demand for sophisticated testing services, particularly from the pharmaceutical and biotechnology sectors.
- June 2024: UL Solutions Inc. announced ambitious plans for the development of a new Advanced Automotive and Battery Testing Center located in Korea. This strategic initiative aims to bolster their capacity to serve the rapidly expanding electric vehicle (EV) market and solidify their leadership position within this critical sector.
- March 2024: Applus+ played a pivotal role in providing comprehensive technical supervision for a major transmission line project in Peru. This engagement exemplifies the critical demand for TIC services in supporting large-scale infrastructure ventures and highlights Applus+'s proven expertise in this domain.
In-Depth TIC Market For The Metals And Minerals Industry Market Outlook
The TIC market for the metals and minerals industry is firmly positioned for sustained and robust growth. This upward trajectory is primarily fueled by the unabating demand for rigorous quality assurance, the imperative to adhere to increasingly stringent regulatory compliance mandates, and the continuous advancements in testing technologies. Strategic acquisitions and mergers, coupled with the proactive expansion into dynamic emerging markets and the relentless development of innovative, customer-centric testing solutions, will be pivotal in shaping the future market landscape. The growing global emphasis on sustainability, ethical sourcing, and circular economy principles is expected to further amplify demand for specialized TIC services, creating lucrative opportunities for providers adept at addressing these critical areas. The future potential for growth and innovation within this sector remains exceptionally significant, presenting a compelling outlook for industry stakeholders.
TIC Market For The Metals And Minerals Industry Segmentation
-
1. Operation Type
- 1.1. In-house
- 1.2. Outsourced
-
2. Service Type
- 2.1. Testing And Inspection
- 2.2. Certification
-
3. Material Type
- 3.1. Metals/Metal Powders
- 3.2. Composites
-
4. End-user Industry
- 4.1. Automotive
- 4.2. Aerospace and Defense
- 4.3. Energy and Power
- 4.4. Manufacturing
- 4.5. Construction
- 4.6. Oil and Gas
- 4.7. Other End-user Industries
TIC Market For The Metals And Minerals Industry Segmentation By Geography
-
1. North America
- 1.1. United States
- 1.2. Canada
-
2. Europe
- 2.1. United Kingdom
- 2.2. Germany
- 2.3. France
-
3. Asia
- 3.1. China
- 3.2. Japan
- 3.3. South Korea
- 3.4. South East Asia
- 3.5. India
- 4. Australia and New Zealand
- 5. Latin America
- 6. Middle East and Africa
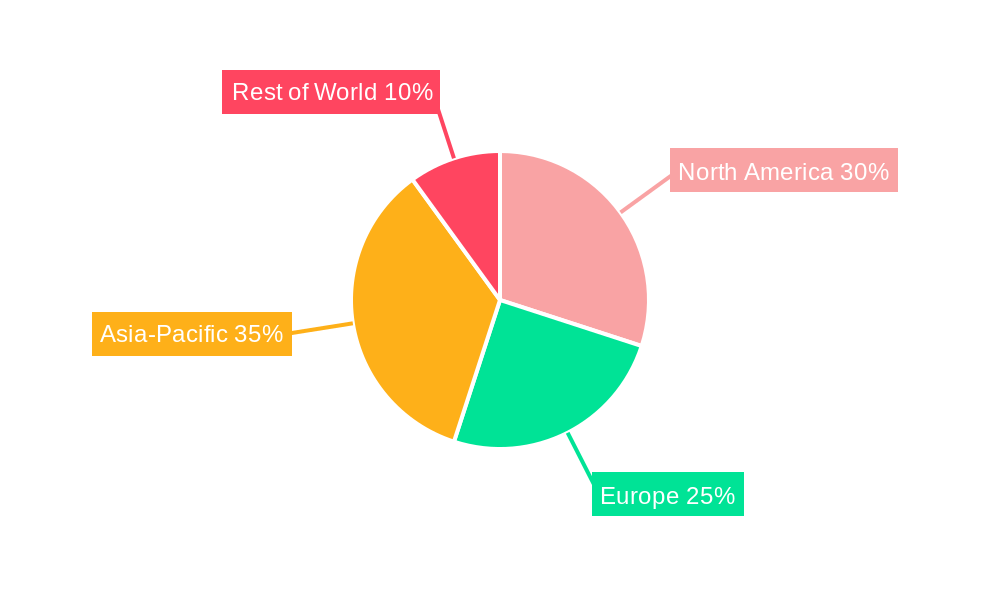
TIC Market For The Metals And Minerals Industry Regional Market Share
Geographic Coverage of TIC Market For The Metals And Minerals Industry
TIC Market For The Metals And Minerals Industry REPORT HIGHLIGHTS
| Aspects | Details |
|---|---|
| Study Period | 2020-2034 |
| Base Year | 2025 |
| Estimated Year | 2026 |
| Forecast Period | 2026-2034 |
| Historical Period | 2020-2025 |
| Growth Rate | CAGR of 4.30% from 2020-2034 |
| Segmentation |
|
Table of Contents
- 1. Introduction
- 1.1. Research Scope
- 1.2. Market Segmentation
- 1.3. Research Objective
- 1.4. Definitions and Assumptions
- 2. Executive Summary
- 2.1. Market Snapshot
- 3. Market Dynamics
- 3.1. Market Drivers
- 3.2. Market Restrains
- 3.3. Market Trends
- 3.4. Market Opportunities
- 4. Market Factor Analysis
- 4.1. Porters Five Forces
- 4.1.1. Bargaining Power of Suppliers
- 4.1.2. Bargaining Power of Buyers
- 4.1.3. Threat of New Entrants
- 4.1.4. Threat of Substitutes
- 4.1.5. Competitive Rivalry
- 4.2. PESTEL analysis
- 4.3. BCG Analysis
- 4.3.1. Stars (High Growth, High Market Share)
- 4.3.2. Cash Cows (Low Growth, High Market Share)
- 4.3.3. Question Mark (High Growth, Low Market Share)
- 4.3.4. Dogs (Low Growth, Low Market Share)
- 4.4. Ansoff Matrix Analysis
- 4.5. Supply Chain Analysis
- 4.6. Regulatory Landscape
- 4.7. Current Market Potential and Opportunity Assessment (TAM–SAM–SOM Framework)
- 4.8. VDR Analyst Note
- 4.1. Porters Five Forces
- 5. Market Analysis, Insights and Forecast 2021-2033
- 5.1. Market Analysis, Insights and Forecast - by Operation Type
- 5.1.1. In-house
- 5.1.2. Outsourced
- 5.2. Market Analysis, Insights and Forecast - by Service Type
- 5.2.1. Testing And Inspection
- 5.2.2. Certification
- 5.3. Market Analysis, Insights and Forecast - by Material Type
- 5.3.1. Metals/Metal Powders
- 5.3.2. Composites
- 5.4. Market Analysis, Insights and Forecast - by End-user Industry
- 5.4.1. Automotive
- 5.4.2. Aerospace and Defense
- 5.4.3. Energy and Power
- 5.4.4. Manufacturing
- 5.4.5. Construction
- 5.4.6. Oil and Gas
- 5.4.7. Other End-user Industries
- 5.5. Market Analysis, Insights and Forecast - by Region
- 5.5.1. North America
- 5.5.2. Europe
- 5.5.3. Asia
- 5.5.4. Australia and New Zealand
- 5.5.5. Latin America
- 5.5.6. Middle East and Africa
- 5.1. Market Analysis, Insights and Forecast - by Operation Type
- 6. Global TIC Market For The Metals And Minerals Industry Analysis, Insights and Forecast, 2021-2033
- 6.1. Market Analysis, Insights and Forecast - by Operation Type
- 6.1.1. In-house
- 6.1.2. Outsourced
- 6.2. Market Analysis, Insights and Forecast - by Service Type
- 6.2.1. Testing And Inspection
- 6.2.2. Certification
- 6.3. Market Analysis, Insights and Forecast - by Material Type
- 6.3.1. Metals/Metal Powders
- 6.3.2. Composites
- 6.4. Market Analysis, Insights and Forecast - by End-user Industry
- 6.4.1. Automotive
- 6.4.2. Aerospace and Defense
- 6.4.3. Energy and Power
- 6.4.4. Manufacturing
- 6.4.5. Construction
- 6.4.6. Oil and Gas
- 6.4.7. Other End-user Industries
- 6.1. Market Analysis, Insights and Forecast - by Operation Type
- 7. North America TIC Market For The Metals And Minerals Industry Analysis, Insights and Forecast, 2021-2033
- 7.1. Market Analysis, Insights and Forecast - by Operation Type
- 7.1.1. In-house
- 7.1.2. Outsourced
- 7.2. Market Analysis, Insights and Forecast - by Service Type
- 7.2.1. Testing And Inspection
- 7.2.2. Certification
- 7.3. Market Analysis, Insights and Forecast - by Material Type
- 7.3.1. Metals/Metal Powders
- 7.3.2. Composites
- 7.4. Market Analysis, Insights and Forecast - by End-user Industry
- 7.4.1. Automotive
- 7.4.2. Aerospace and Defense
- 7.4.3. Energy and Power
- 7.4.4. Manufacturing
- 7.4.5. Construction
- 7.4.6. Oil and Gas
- 7.4.7. Other End-user Industries
- 7.1. Market Analysis, Insights and Forecast - by Operation Type
- 8. Europe TIC Market For The Metals And Minerals Industry Analysis, Insights and Forecast, 2021-2033
- 8.1. Market Analysis, Insights and Forecast - by Operation Type
- 8.1.1. In-house
- 8.1.2. Outsourced
- 8.2. Market Analysis, Insights and Forecast - by Service Type
- 8.2.1. Testing And Inspection
- 8.2.2. Certification
- 8.3. Market Analysis, Insights and Forecast - by Material Type
- 8.3.1. Metals/Metal Powders
- 8.3.2. Composites
- 8.4. Market Analysis, Insights and Forecast - by End-user Industry
- 8.4.1. Automotive
- 8.4.2. Aerospace and Defense
- 8.4.3. Energy and Power
- 8.4.4. Manufacturing
- 8.4.5. Construction
- 8.4.6. Oil and Gas
- 8.4.7. Other End-user Industries
- 8.1. Market Analysis, Insights and Forecast - by Operation Type
- 9. Asia TIC Market For The Metals And Minerals Industry Analysis, Insights and Forecast, 2021-2033
- 9.1. Market Analysis, Insights and Forecast - by Operation Type
- 9.1.1. In-house
- 9.1.2. Outsourced
- 9.2. Market Analysis, Insights and Forecast - by Service Type
- 9.2.1. Testing And Inspection
- 9.2.2. Certification
- 9.3. Market Analysis, Insights and Forecast - by Material Type
- 9.3.1. Metals/Metal Powders
- 9.3.2. Composites
- 9.4. Market Analysis, Insights and Forecast - by End-user Industry
- 9.4.1. Automotive
- 9.4.2. Aerospace and Defense
- 9.4.3. Energy and Power
- 9.4.4. Manufacturing
- 9.4.5. Construction
- 9.4.6. Oil and Gas
- 9.4.7. Other End-user Industries
- 9.1. Market Analysis, Insights and Forecast - by Operation Type
- 10. Australia and New Zealand TIC Market For The Metals And Minerals Industry Analysis, Insights and Forecast, 2021-2033
- 10.1. Market Analysis, Insights and Forecast - by Operation Type
- 10.1.1. In-house
- 10.1.2. Outsourced
- 10.2. Market Analysis, Insights and Forecast - by Service Type
- 10.2.1. Testing And Inspection
- 10.2.2. Certification
- 10.3. Market Analysis, Insights and Forecast - by Material Type
- 10.3.1. Metals/Metal Powders
- 10.3.2. Composites
- 10.4. Market Analysis, Insights and Forecast - by End-user Industry
- 10.4.1. Automotive
- 10.4.2. Aerospace and Defense
- 10.4.3. Energy and Power
- 10.4.4. Manufacturing
- 10.4.5. Construction
- 10.4.6. Oil and Gas
- 10.4.7. Other End-user Industries
- 10.1. Market Analysis, Insights and Forecast - by Operation Type
- 11. Latin America TIC Market For The Metals And Minerals Industry Analysis, Insights and Forecast, 2021-2033
- 11.1. Market Analysis, Insights and Forecast - by Operation Type
- 11.1.1. In-house
- 11.1.2. Outsourced
- 11.2. Market Analysis, Insights and Forecast - by Service Type
- 11.2.1. Testing And Inspection
- 11.2.2. Certification
- 11.3. Market Analysis, Insights and Forecast - by Material Type
- 11.3.1. Metals/Metal Powders
- 11.3.2. Composites
- 11.4. Market Analysis, Insights and Forecast - by End-user Industry
- 11.4.1. Automotive
- 11.4.2. Aerospace and Defense
- 11.4.3. Energy and Power
- 11.4.4. Manufacturing
- 11.4.5. Construction
- 11.4.6. Oil and Gas
- 11.4.7. Other End-user Industries
- 11.1. Market Analysis, Insights and Forecast - by Operation Type
- 12. Middle East and Africa TIC Market For The Metals And Minerals Industry Analysis, Insights and Forecast, 2021-2033
- 12.1. Market Analysis, Insights and Forecast - by Operation Type
- 12.1.1. In-house
- 12.1.2. Outsourced
- 12.2. Market Analysis, Insights and Forecast - by Service Type
- 12.2.1. Testing And Inspection
- 12.2.2. Certification
- 12.3. Market Analysis, Insights and Forecast - by Material Type
- 12.3.1. Metals/Metal Powders
- 12.3.2. Composites
- 12.4. Market Analysis, Insights and Forecast - by End-user Industry
- 12.4.1. Automotive
- 12.4.2. Aerospace and Defense
- 12.4.3. Energy and Power
- 12.4.4. Manufacturing
- 12.4.5. Construction
- 12.4.6. Oil and Gas
- 12.4.7. Other End-user Industries
- 12.1. Market Analysis, Insights and Forecast - by Operation Type
- 13. Competitive Analysis
- 13.1. Company Profiles
- 13.1.1 SGS SA
- 13.1.1.1. Company Overview
- 13.1.1.2. Products
- 13.1.1.3. Company Financials
- 13.1.1.4. SWOT Analysis
- 13.1.2 Bureau Veritas SA
- 13.1.2.1. Company Overview
- 13.1.2.2. Products
- 13.1.2.3. Company Financials
- 13.1.2.4. SWOT Analysis
- 13.1.3 Intertek Group PLC
- 13.1.3.1. Company Overview
- 13.1.3.2. Products
- 13.1.3.3. Company Financials
- 13.1.3.4. SWOT Analysis
- 13.1.4 TUV SUD
- 13.1.4.1. Company Overview
- 13.1.4.2. Products
- 13.1.4.3. Company Financials
- 13.1.4.4. SWOT Analysis
- 13.1.5 DEKRA SE
- 13.1.5.1. Company Overview
- 13.1.5.2. Products
- 13.1.5.3. Company Financials
- 13.1.5.4. SWOT Analysis
- 13.1.6 ALS Limited
- 13.1.6.1. Company Overview
- 13.1.6.2. Products
- 13.1.6.3. Company Financials
- 13.1.6.4. SWOT Analysis
- 13.1.7 Applus+
- 13.1.7.1. Company Overview
- 13.1.7.2. Products
- 13.1.7.3. Company Financials
- 13.1.7.4. SWOT Analysis
- 13.1.8 Eurofins Scientific SE
- 13.1.8.1. Company Overview
- 13.1.8.2. Products
- 13.1.8.3. Company Financials
- 13.1.8.4. SWOT Analysis
- 13.1.9 DNV Group AS
- 13.1.9.1. Company Overview
- 13.1.9.2. Products
- 13.1.9.3. Company Financials
- 13.1.9.4. SWOT Analysis
- 13.1.10 Element Materials Technology Group Limited
- 13.1.10.1. Company Overview
- 13.1.10.2. Products
- 13.1.10.3. Company Financials
- 13.1.10.4. SWOT Analysis
- 13.1.11 Mistras Group Inc
- 13.1.11.1. Company Overview
- 13.1.11.2. Products
- 13.1.11.3. Company Financials
- 13.1.11.4. SWOT Analysis
- 13.1.12 Kiwa NV
- 13.1.12.1. Company Overview
- 13.1.12.2. Products
- 13.1.12.3. Company Financials
- 13.1.12.4. SWOT Analysis
- 13.1.13 UL Solutions Inc
- 13.1.13.1. Company Overview
- 13.1.13.2. Products
- 13.1.13.3. Company Financials
- 13.1.13.4. SWOT Analysis
- 13.1.14 Rina SPA
- 13.1.14.1. Company Overview
- 13.1.14.2. Products
- 13.1.14.3. Company Financials
- 13.1.14.4. SWOT Analysis
- 13.1.15 Qima
- 13.1.15.1. Company Overview
- 13.1.15.2. Products
- 13.1.15.3. Company Financials
- 13.1.15.4. SWOT Analysis
- 13.1.16 Westmoreland Mechanical Testing and Research Inc
- 13.1.16.1. Company Overview
- 13.1.16.2. Products
- 13.1.16.3. Company Financials
- 13.1.16.4. SWOT Analysis
- 13.1.17 Laboratory Testing Inc
- 13.1.17.1. Company Overview
- 13.1.17.2. Products
- 13.1.17.3. Company Financials
- 13.1.17.4. SWOT Analysis
- 13.1.18 NSL Analytical Services Inc
- 13.1.18.1. Company Overview
- 13.1.18.2. Products
- 13.1.18.3. Company Financials
- 13.1.18.4. SWOT Analysis
- 13.1.19 IMR Test Labs (Curtiss Wright Corporation)
- 13.1.19.1. Company Overview
- 13.1.19.2. Products
- 13.1.19.3. Company Financials
- 13.1.19.4. SWOT Analysis
- 13.1.20 Applied Technical Services LLC*List Not Exhaustive
- 13.1.20.1. Company Overview
- 13.1.20.2. Products
- 13.1.20.3. Company Financials
- 13.1.20.4. SWOT Analysis
- 13.1.1 SGS SA
- 13.2. Market Entropy
- 13.2.1 Company's Key Areas Served
- 13.2.2 Recent Developments
- 13.3. Company Market Share Analysis 2025
- 13.3.1 Top 5 Companies Market Share Analysis
- 13.3.2 Top 3 Companies Market Share Analysis
- 13.4. List of Potential Customers
- 14. Research Methodology
List of Figures
- Figure 1: Global TIC Market For The Metals And Minerals Industry Revenue Breakdown (Million, %) by Region 2025 & 2033
- Figure 2: Global TIC Market For The Metals And Minerals Industry Volume Breakdown (Billion, %) by Region 2025 & 2033
- Figure 3: North America TIC Market For The Metals And Minerals Industry Revenue (Million), by Operation Type 2025 & 2033
- Figure 4: North America TIC Market For The Metals And Minerals Industry Volume (Billion), by Operation Type 2025 & 2033
- Figure 5: North America TIC Market For The Metals And Minerals Industry Revenue Share (%), by Operation Type 2025 & 2033
- Figure 6: North America TIC Market For The Metals And Minerals Industry Volume Share (%), by Operation Type 2025 & 2033
- Figure 7: North America TIC Market For The Metals And Minerals Industry Revenue (Million), by Service Type 2025 & 2033
- Figure 8: North America TIC Market For The Metals And Minerals Industry Volume (Billion), by Service Type 2025 & 2033
- Figure 9: North America TIC Market For The Metals And Minerals Industry Revenue Share (%), by Service Type 2025 & 2033
- Figure 10: North America TIC Market For The Metals And Minerals Industry Volume Share (%), by Service Type 2025 & 2033
- Figure 11: North America TIC Market For The Metals And Minerals Industry Revenue (Million), by Material Type 2025 & 2033
- Figure 12: North America TIC Market For The Metals And Minerals Industry Volume (Billion), by Material Type 2025 & 2033
- Figure 13: North America TIC Market For The Metals And Minerals Industry Revenue Share (%), by Material Type 2025 & 2033
- Figure 14: North America TIC Market For The Metals And Minerals Industry Volume Share (%), by Material Type 2025 & 2033
- Figure 15: North America TIC Market For The Metals And Minerals Industry Revenue (Million), by End-user Industry 2025 & 2033
- Figure 16: North America TIC Market For The Metals And Minerals Industry Volume (Billion), by End-user Industry 2025 & 2033
- Figure 17: North America TIC Market For The Metals And Minerals Industry Revenue Share (%), by End-user Industry 2025 & 2033
- Figure 18: North America TIC Market For The Metals And Minerals Industry Volume Share (%), by End-user Industry 2025 & 2033
- Figure 19: North America TIC Market For The Metals And Minerals Industry Revenue (Million), by Country 2025 & 2033
- Figure 20: North America TIC Market For The Metals And Minerals Industry Volume (Billion), by Country 2025 & 2033
- Figure 21: North America TIC Market For The Metals And Minerals Industry Revenue Share (%), by Country 2025 & 2033
- Figure 22: North America TIC Market For The Metals And Minerals Industry Volume Share (%), by Country 2025 & 2033
- Figure 23: Europe TIC Market For The Metals And Minerals Industry Revenue (Million), by Operation Type 2025 & 2033
- Figure 24: Europe TIC Market For The Metals And Minerals Industry Volume (Billion), by Operation Type 2025 & 2033
- Figure 25: Europe TIC Market For The Metals And Minerals Industry Revenue Share (%), by Operation Type 2025 & 2033
- Figure 26: Europe TIC Market For The Metals And Minerals Industry Volume Share (%), by Operation Type 2025 & 2033
- Figure 27: Europe TIC Market For The Metals And Minerals Industry Revenue (Million), by Service Type 2025 & 2033
- Figure 28: Europe TIC Market For The Metals And Minerals Industry Volume (Billion), by Service Type 2025 & 2033
- Figure 29: Europe TIC Market For The Metals And Minerals Industry Revenue Share (%), by Service Type 2025 & 2033
- Figure 30: Europe TIC Market For The Metals And Minerals Industry Volume Share (%), by Service Type 2025 & 2033
- Figure 31: Europe TIC Market For The Metals And Minerals Industry Revenue (Million), by Material Type 2025 & 2033
- Figure 32: Europe TIC Market For The Metals And Minerals Industry Volume (Billion), by Material Type 2025 & 2033
- Figure 33: Europe TIC Market For The Metals And Minerals Industry Revenue Share (%), by Material Type 2025 & 2033
- Figure 34: Europe TIC Market For The Metals And Minerals Industry Volume Share (%), by Material Type 2025 & 2033
- Figure 35: Europe TIC Market For The Metals And Minerals Industry Revenue (Million), by End-user Industry 2025 & 2033
- Figure 36: Europe TIC Market For The Metals And Minerals Industry Volume (Billion), by End-user Industry 2025 & 2033
- Figure 37: Europe TIC Market For The Metals And Minerals Industry Revenue Share (%), by End-user Industry 2025 & 2033
- Figure 38: Europe TIC Market For The Metals And Minerals Industry Volume Share (%), by End-user Industry 2025 & 2033
- Figure 39: Europe TIC Market For The Metals And Minerals Industry Revenue (Million), by Country 2025 & 2033
- Figure 40: Europe TIC Market For The Metals And Minerals Industry Volume (Billion), by Country 2025 & 2033
- Figure 41: Europe TIC Market For The Metals And Minerals Industry Revenue Share (%), by Country 2025 & 2033
- Figure 42: Europe TIC Market For The Metals And Minerals Industry Volume Share (%), by Country 2025 & 2033
- Figure 43: Asia TIC Market For The Metals And Minerals Industry Revenue (Million), by Operation Type 2025 & 2033
- Figure 44: Asia TIC Market For The Metals And Minerals Industry Volume (Billion), by Operation Type 2025 & 2033
- Figure 45: Asia TIC Market For The Metals And Minerals Industry Revenue Share (%), by Operation Type 2025 & 2033
- Figure 46: Asia TIC Market For The Metals And Minerals Industry Volume Share (%), by Operation Type 2025 & 2033
- Figure 47: Asia TIC Market For The Metals And Minerals Industry Revenue (Million), by Service Type 2025 & 2033
- Figure 48: Asia TIC Market For The Metals And Minerals Industry Volume (Billion), by Service Type 2025 & 2033
- Figure 49: Asia TIC Market For The Metals And Minerals Industry Revenue Share (%), by Service Type 2025 & 2033
- Figure 50: Asia TIC Market For The Metals And Minerals Industry Volume Share (%), by Service Type 2025 & 2033
- Figure 51: Asia TIC Market For The Metals And Minerals Industry Revenue (Million), by Material Type 2025 & 2033
- Figure 52: Asia TIC Market For The Metals And Minerals Industry Volume (Billion), by Material Type 2025 & 2033
- Figure 53: Asia TIC Market For The Metals And Minerals Industry Revenue Share (%), by Material Type 2025 & 2033
- Figure 54: Asia TIC Market For The Metals And Minerals Industry Volume Share (%), by Material Type 2025 & 2033
- Figure 55: Asia TIC Market For The Metals And Minerals Industry Revenue (Million), by End-user Industry 2025 & 2033
- Figure 56: Asia TIC Market For The Metals And Minerals Industry Volume (Billion), by End-user Industry 2025 & 2033
- Figure 57: Asia TIC Market For The Metals And Minerals Industry Revenue Share (%), by End-user Industry 2025 & 2033
- Figure 58: Asia TIC Market For The Metals And Minerals Industry Volume Share (%), by End-user Industry 2025 & 2033
- Figure 59: Asia TIC Market For The Metals And Minerals Industry Revenue (Million), by Country 2025 & 2033
- Figure 60: Asia TIC Market For The Metals And Minerals Industry Volume (Billion), by Country 2025 & 2033
- Figure 61: Asia TIC Market For The Metals And Minerals Industry Revenue Share (%), by Country 2025 & 2033
- Figure 62: Asia TIC Market For The Metals And Minerals Industry Volume Share (%), by Country 2025 & 2033
- Figure 63: Australia and New Zealand TIC Market For The Metals And Minerals Industry Revenue (Million), by Operation Type 2025 & 2033
- Figure 64: Australia and New Zealand TIC Market For The Metals And Minerals Industry Volume (Billion), by Operation Type 2025 & 2033
- Figure 65: Australia and New Zealand TIC Market For The Metals And Minerals Industry Revenue Share (%), by Operation Type 2025 & 2033
- Figure 66: Australia and New Zealand TIC Market For The Metals And Minerals Industry Volume Share (%), by Operation Type 2025 & 2033
- Figure 67: Australia and New Zealand TIC Market For The Metals And Minerals Industry Revenue (Million), by Service Type 2025 & 2033
- Figure 68: Australia and New Zealand TIC Market For The Metals And Minerals Industry Volume (Billion), by Service Type 2025 & 2033
- Figure 69: Australia and New Zealand TIC Market For The Metals And Minerals Industry Revenue Share (%), by Service Type 2025 & 2033
- Figure 70: Australia and New Zealand TIC Market For The Metals And Minerals Industry Volume Share (%), by Service Type 2025 & 2033
- Figure 71: Australia and New Zealand TIC Market For The Metals And Minerals Industry Revenue (Million), by Material Type 2025 & 2033
- Figure 72: Australia and New Zealand TIC Market For The Metals And Minerals Industry Volume (Billion), by Material Type 2025 & 2033
- Figure 73: Australia and New Zealand TIC Market For The Metals And Minerals Industry Revenue Share (%), by Material Type 2025 & 2033
- Figure 74: Australia and New Zealand TIC Market For The Metals And Minerals Industry Volume Share (%), by Material Type 2025 & 2033
- Figure 75: Australia and New Zealand TIC Market For The Metals And Minerals Industry Revenue (Million), by End-user Industry 2025 & 2033
- Figure 76: Australia and New Zealand TIC Market For The Metals And Minerals Industry Volume (Billion), by End-user Industry 2025 & 2033
- Figure 77: Australia and New Zealand TIC Market For The Metals And Minerals Industry Revenue Share (%), by End-user Industry 2025 & 2033
- Figure 78: Australia and New Zealand TIC Market For The Metals And Minerals Industry Volume Share (%), by End-user Industry 2025 & 2033
- Figure 79: Australia and New Zealand TIC Market For The Metals And Minerals Industry Revenue (Million), by Country 2025 & 2033
- Figure 80: Australia and New Zealand TIC Market For The Metals And Minerals Industry Volume (Billion), by Country 2025 & 2033
- Figure 81: Australia and New Zealand TIC Market For The Metals And Minerals Industry Revenue Share (%), by Country 2025 & 2033
- Figure 82: Australia and New Zealand TIC Market For The Metals And Minerals Industry Volume Share (%), by Country 2025 & 2033
- Figure 83: Latin America TIC Market For The Metals And Minerals Industry Revenue (Million), by Operation Type 2025 & 2033
- Figure 84: Latin America TIC Market For The Metals And Minerals Industry Volume (Billion), by Operation Type 2025 & 2033
- Figure 85: Latin America TIC Market For The Metals And Minerals Industry Revenue Share (%), by Operation Type 2025 & 2033
- Figure 86: Latin America TIC Market For The Metals And Minerals Industry Volume Share (%), by Operation Type 2025 & 2033
- Figure 87: Latin America TIC Market For The Metals And Minerals Industry Revenue (Million), by Service Type 2025 & 2033
- Figure 88: Latin America TIC Market For The Metals And Minerals Industry Volume (Billion), by Service Type 2025 & 2033
- Figure 89: Latin America TIC Market For The Metals And Minerals Industry Revenue Share (%), by Service Type 2025 & 2033
- Figure 90: Latin America TIC Market For The Metals And Minerals Industry Volume Share (%), by Service Type 2025 & 2033
- Figure 91: Latin America TIC Market For The Metals And Minerals Industry Revenue (Million), by Material Type 2025 & 2033
- Figure 92: Latin America TIC Market For The Metals And Minerals Industry Volume (Billion), by Material Type 2025 & 2033
- Figure 93: Latin America TIC Market For The Metals And Minerals Industry Revenue Share (%), by Material Type 2025 & 2033
- Figure 94: Latin America TIC Market For The Metals And Minerals Industry Volume Share (%), by Material Type 2025 & 2033
- Figure 95: Latin America TIC Market For The Metals And Minerals Industry Revenue (Million), by End-user Industry 2025 & 2033
- Figure 96: Latin America TIC Market For The Metals And Minerals Industry Volume (Billion), by End-user Industry 2025 & 2033
- Figure 97: Latin America TIC Market For The Metals And Minerals Industry Revenue Share (%), by End-user Industry 2025 & 2033
- Figure 98: Latin America TIC Market For The Metals And Minerals Industry Volume Share (%), by End-user Industry 2025 & 2033
- Figure 99: Latin America TIC Market For The Metals And Minerals Industry Revenue (Million), by Country 2025 & 2033
- Figure 100: Latin America TIC Market For The Metals And Minerals Industry Volume (Billion), by Country 2025 & 2033
- Figure 101: Latin America TIC Market For The Metals And Minerals Industry Revenue Share (%), by Country 2025 & 2033
- Figure 102: Latin America TIC Market For The Metals And Minerals Industry Volume Share (%), by Country 2025 & 2033
- Figure 103: Middle East and Africa TIC Market For The Metals And Minerals Industry Revenue (Million), by Operation Type 2025 & 2033
- Figure 104: Middle East and Africa TIC Market For The Metals And Minerals Industry Volume (Billion), by Operation Type 2025 & 2033
- Figure 105: Middle East and Africa TIC Market For The Metals And Minerals Industry Revenue Share (%), by Operation Type 2025 & 2033
- Figure 106: Middle East and Africa TIC Market For The Metals And Minerals Industry Volume Share (%), by Operation Type 2025 & 2033
- Figure 107: Middle East and Africa TIC Market For The Metals And Minerals Industry Revenue (Million), by Service Type 2025 & 2033
- Figure 108: Middle East and Africa TIC Market For The Metals And Minerals Industry Volume (Billion), by Service Type 2025 & 2033
- Figure 109: Middle East and Africa TIC Market For The Metals And Minerals Industry Revenue Share (%), by Service Type 2025 & 2033
- Figure 110: Middle East and Africa TIC Market For The Metals And Minerals Industry Volume Share (%), by Service Type 2025 & 2033
- Figure 111: Middle East and Africa TIC Market For The Metals And Minerals Industry Revenue (Million), by Material Type 2025 & 2033
- Figure 112: Middle East and Africa TIC Market For The Metals And Minerals Industry Volume (Billion), by Material Type 2025 & 2033
- Figure 113: Middle East and Africa TIC Market For The Metals And Minerals Industry Revenue Share (%), by Material Type 2025 & 2033
- Figure 114: Middle East and Africa TIC Market For The Metals And Minerals Industry Volume Share (%), by Material Type 2025 & 2033
- Figure 115: Middle East and Africa TIC Market For The Metals And Minerals Industry Revenue (Million), by End-user Industry 2025 & 2033
- Figure 116: Middle East and Africa TIC Market For The Metals And Minerals Industry Volume (Billion), by End-user Industry 2025 & 2033
- Figure 117: Middle East and Africa TIC Market For The Metals And Minerals Industry Revenue Share (%), by End-user Industry 2025 & 2033
- Figure 118: Middle East and Africa TIC Market For The Metals And Minerals Industry Volume Share (%), by End-user Industry 2025 & 2033
- Figure 119: Middle East and Africa TIC Market For The Metals And Minerals Industry Revenue (Million), by Country 2025 & 2033
- Figure 120: Middle East and Africa TIC Market For The Metals And Minerals Industry Volume (Billion), by Country 2025 & 2033
- Figure 121: Middle East and Africa TIC Market For The Metals And Minerals Industry Revenue Share (%), by Country 2025 & 2033
- Figure 122: Middle East and Africa TIC Market For The Metals And Minerals Industry Volume Share (%), by Country 2025 & 2033
List of Tables
- Table 1: Global TIC Market For The Metals And Minerals Industry Revenue Million Forecast, by Operation Type 2020 & 2033
- Table 2: Global TIC Market For The Metals And Minerals Industry Volume Billion Forecast, by Operation Type 2020 & 2033
- Table 3: Global TIC Market For The Metals And Minerals Industry Revenue Million Forecast, by Service Type 2020 & 2033
- Table 4: Global TIC Market For The Metals And Minerals Industry Volume Billion Forecast, by Service Type 2020 & 2033
- Table 5: Global TIC Market For The Metals And Minerals Industry Revenue Million Forecast, by Material Type 2020 & 2033
- Table 6: Global TIC Market For The Metals And Minerals Industry Volume Billion Forecast, by Material Type 2020 & 2033
- Table 7: Global TIC Market For The Metals And Minerals Industry Revenue Million Forecast, by End-user Industry 2020 & 2033
- Table 8: Global TIC Market For The Metals And Minerals Industry Volume Billion Forecast, by End-user Industry 2020 & 2033
- Table 9: Global TIC Market For The Metals And Minerals Industry Revenue Million Forecast, by Region 2020 & 2033
- Table 10: Global TIC Market For The Metals And Minerals Industry Volume Billion Forecast, by Region 2020 & 2033
- Table 11: Global TIC Market For The Metals And Minerals Industry Revenue Million Forecast, by Operation Type 2020 & 2033
- Table 12: Global TIC Market For The Metals And Minerals Industry Volume Billion Forecast, by Operation Type 2020 & 2033
- Table 13: Global TIC Market For The Metals And Minerals Industry Revenue Million Forecast, by Service Type 2020 & 2033
- Table 14: Global TIC Market For The Metals And Minerals Industry Volume Billion Forecast, by Service Type 2020 & 2033
- Table 15: Global TIC Market For The Metals And Minerals Industry Revenue Million Forecast, by Material Type 2020 & 2033
- Table 16: Global TIC Market For The Metals And Minerals Industry Volume Billion Forecast, by Material Type 2020 & 2033
- Table 17: Global TIC Market For The Metals And Minerals Industry Revenue Million Forecast, by End-user Industry 2020 & 2033
- Table 18: Global TIC Market For The Metals And Minerals Industry Volume Billion Forecast, by End-user Industry 2020 & 2033
- Table 19: Global TIC Market For The Metals And Minerals Industry Revenue Million Forecast, by Country 2020 & 2033
- Table 20: Global TIC Market For The Metals And Minerals Industry Volume Billion Forecast, by Country 2020 & 2033
- Table 21: United States TIC Market For The Metals And Minerals Industry Revenue (Million) Forecast, by Application 2020 & 2033
- Table 22: United States TIC Market For The Metals And Minerals Industry Volume (Billion) Forecast, by Application 2020 & 2033
- Table 23: Canada TIC Market For The Metals And Minerals Industry Revenue (Million) Forecast, by Application 2020 & 2033
- Table 24: Canada TIC Market For The Metals And Minerals Industry Volume (Billion) Forecast, by Application 2020 & 2033
- Table 25: Global TIC Market For The Metals And Minerals Industry Revenue Million Forecast, by Operation Type 2020 & 2033
- Table 26: Global TIC Market For The Metals And Minerals Industry Volume Billion Forecast, by Operation Type 2020 & 2033
- Table 27: Global TIC Market For The Metals And Minerals Industry Revenue Million Forecast, by Service Type 2020 & 2033
- Table 28: Global TIC Market For The Metals And Minerals Industry Volume Billion Forecast, by Service Type 2020 & 2033
- Table 29: Global TIC Market For The Metals And Minerals Industry Revenue Million Forecast, by Material Type 2020 & 2033
- Table 30: Global TIC Market For The Metals And Minerals Industry Volume Billion Forecast, by Material Type 2020 & 2033
- Table 31: Global TIC Market For The Metals And Minerals Industry Revenue Million Forecast, by End-user Industry 2020 & 2033
- Table 32: Global TIC Market For The Metals And Minerals Industry Volume Billion Forecast, by End-user Industry 2020 & 2033
- Table 33: Global TIC Market For The Metals And Minerals Industry Revenue Million Forecast, by Country 2020 & 2033
- Table 34: Global TIC Market For The Metals And Minerals Industry Volume Billion Forecast, by Country 2020 & 2033
- Table 35: United Kingdom TIC Market For The Metals And Minerals Industry Revenue (Million) Forecast, by Application 2020 & 2033
- Table 36: United Kingdom TIC Market For The Metals And Minerals Industry Volume (Billion) Forecast, by Application 2020 & 2033
- Table 37: Germany TIC Market For The Metals And Minerals Industry Revenue (Million) Forecast, by Application 2020 & 2033
- Table 38: Germany TIC Market For The Metals And Minerals Industry Volume (Billion) Forecast, by Application 2020 & 2033
- Table 39: France TIC Market For The Metals And Minerals Industry Revenue (Million) Forecast, by Application 2020 & 2033
- Table 40: France TIC Market For The Metals And Minerals Industry Volume (Billion) Forecast, by Application 2020 & 2033
- Table 41: Global TIC Market For The Metals And Minerals Industry Revenue Million Forecast, by Operation Type 2020 & 2033
- Table 42: Global TIC Market For The Metals And Minerals Industry Volume Billion Forecast, by Operation Type 2020 & 2033
- Table 43: Global TIC Market For The Metals And Minerals Industry Revenue Million Forecast, by Service Type 2020 & 2033
- Table 44: Global TIC Market For The Metals And Minerals Industry Volume Billion Forecast, by Service Type 2020 & 2033
- Table 45: Global TIC Market For The Metals And Minerals Industry Revenue Million Forecast, by Material Type 2020 & 2033
- Table 46: Global TIC Market For The Metals And Minerals Industry Volume Billion Forecast, by Material Type 2020 & 2033
- Table 47: Global TIC Market For The Metals And Minerals Industry Revenue Million Forecast, by End-user Industry 2020 & 2033
- Table 48: Global TIC Market For The Metals And Minerals Industry Volume Billion Forecast, by End-user Industry 2020 & 2033
- Table 49: Global TIC Market For The Metals And Minerals Industry Revenue Million Forecast, by Country 2020 & 2033
- Table 50: Global TIC Market For The Metals And Minerals Industry Volume Billion Forecast, by Country 2020 & 2033
- Table 51: China TIC Market For The Metals And Minerals Industry Revenue (Million) Forecast, by Application 2020 & 2033
- Table 52: China TIC Market For The Metals And Minerals Industry Volume (Billion) Forecast, by Application 2020 & 2033
- Table 53: Japan TIC Market For The Metals And Minerals Industry Revenue (Million) Forecast, by Application 2020 & 2033
- Table 54: Japan TIC Market For The Metals And Minerals Industry Volume (Billion) Forecast, by Application 2020 & 2033
- Table 55: South Korea TIC Market For The Metals And Minerals Industry Revenue (Million) Forecast, by Application 2020 & 2033
- Table 56: South Korea TIC Market For The Metals And Minerals Industry Volume (Billion) Forecast, by Application 2020 & 2033
- Table 57: South East Asia TIC Market For The Metals And Minerals Industry Revenue (Million) Forecast, by Application 2020 & 2033
- Table 58: South East Asia TIC Market For The Metals And Minerals Industry Volume (Billion) Forecast, by Application 2020 & 2033
- Table 59: India TIC Market For The Metals And Minerals Industry Revenue (Million) Forecast, by Application 2020 & 2033
- Table 60: India TIC Market For The Metals And Minerals Industry Volume (Billion) Forecast, by Application 2020 & 2033
- Table 61: Global TIC Market For The Metals And Minerals Industry Revenue Million Forecast, by Operation Type 2020 & 2033
- Table 62: Global TIC Market For The Metals And Minerals Industry Volume Billion Forecast, by Operation Type 2020 & 2033
- Table 63: Global TIC Market For The Metals And Minerals Industry Revenue Million Forecast, by Service Type 2020 & 2033
- Table 64: Global TIC Market For The Metals And Minerals Industry Volume Billion Forecast, by Service Type 2020 & 2033
- Table 65: Global TIC Market For The Metals And Minerals Industry Revenue Million Forecast, by Material Type 2020 & 2033
- Table 66: Global TIC Market For The Metals And Minerals Industry Volume Billion Forecast, by Material Type 2020 & 2033
- Table 67: Global TIC Market For The Metals And Minerals Industry Revenue Million Forecast, by End-user Industry 2020 & 2033
- Table 68: Global TIC Market For The Metals And Minerals Industry Volume Billion Forecast, by End-user Industry 2020 & 2033
- Table 69: Global TIC Market For The Metals And Minerals Industry Revenue Million Forecast, by Country 2020 & 2033
- Table 70: Global TIC Market For The Metals And Minerals Industry Volume Billion Forecast, by Country 2020 & 2033
- Table 71: Global TIC Market For The Metals And Minerals Industry Revenue Million Forecast, by Operation Type 2020 & 2033
- Table 72: Global TIC Market For The Metals And Minerals Industry Volume Billion Forecast, by Operation Type 2020 & 2033
- Table 73: Global TIC Market For The Metals And Minerals Industry Revenue Million Forecast, by Service Type 2020 & 2033
- Table 74: Global TIC Market For The Metals And Minerals Industry Volume Billion Forecast, by Service Type 2020 & 2033
- Table 75: Global TIC Market For The Metals And Minerals Industry Revenue Million Forecast, by Material Type 2020 & 2033
- Table 76: Global TIC Market For The Metals And Minerals Industry Volume Billion Forecast, by Material Type 2020 & 2033
- Table 77: Global TIC Market For The Metals And Minerals Industry Revenue Million Forecast, by End-user Industry 2020 & 2033
- Table 78: Global TIC Market For The Metals And Minerals Industry Volume Billion Forecast, by End-user Industry 2020 & 2033
- Table 79: Global TIC Market For The Metals And Minerals Industry Revenue Million Forecast, by Country 2020 & 2033
- Table 80: Global TIC Market For The Metals And Minerals Industry Volume Billion Forecast, by Country 2020 & 2033
- Table 81: Global TIC Market For The Metals And Minerals Industry Revenue Million Forecast, by Operation Type 2020 & 2033
- Table 82: Global TIC Market For The Metals And Minerals Industry Volume Billion Forecast, by Operation Type 2020 & 2033
- Table 83: Global TIC Market For The Metals And Minerals Industry Revenue Million Forecast, by Service Type 2020 & 2033
- Table 84: Global TIC Market For The Metals And Minerals Industry Volume Billion Forecast, by Service Type 2020 & 2033
- Table 85: Global TIC Market For The Metals And Minerals Industry Revenue Million Forecast, by Material Type 2020 & 2033
- Table 86: Global TIC Market For The Metals And Minerals Industry Volume Billion Forecast, by Material Type 2020 & 2033
- Table 87: Global TIC Market For The Metals And Minerals Industry Revenue Million Forecast, by End-user Industry 2020 & 2033
- Table 88: Global TIC Market For The Metals And Minerals Industry Volume Billion Forecast, by End-user Industry 2020 & 2033
- Table 89: Global TIC Market For The Metals And Minerals Industry Revenue Million Forecast, by Country 2020 & 2033
- Table 90: Global TIC Market For The Metals And Minerals Industry Volume Billion Forecast, by Country 2020 & 2033
Frequently Asked Questions
1. What is the projected Compound Annual Growth Rate (CAGR) of the TIC Market For The Metals And Minerals Industry?
The projected CAGR is approximately 4.30%.
2. Which companies are prominent players in the TIC Market For The Metals And Minerals Industry?
Key companies in the market include SGS SA, Bureau Veritas SA, Intertek Group PLC, TUV SUD, DEKRA SE, ALS Limited, Applus+, Eurofins Scientific SE, DNV Group AS, Element Materials Technology Group Limited, Mistras Group Inc, Kiwa NV, UL Solutions Inc, Rina SPA, Qima, Westmoreland Mechanical Testing and Research Inc, Laboratory Testing Inc, NSL Analytical Services Inc, IMR Test Labs (Curtiss Wright Corporation), Applied Technical Services LLC*List Not Exhaustive.
3. What are the main segments of the TIC Market For The Metals And Minerals Industry?
The market segments include Operation Type, Service Type, Material Type, End-user Industry.
4. Can you provide details about the market size?
The market size is estimated to be USD 19.53 Million as of 2022.
5. What are some drivers contributing to market growth?
Rising Demand For Critical Minerals; Government Regulations and Mandates to Ensure Product Safety and Environmental Protection.
6. What are the notable trends driving market growth?
Construction Industry to be the Largest End User.
7. Are there any restraints impacting market growth?
Rising Demand For Critical Minerals; Government Regulations and Mandates to Ensure Product Safety and Environmental Protection.
8. Can you provide examples of recent developments in the market?
August 2024: Element Materials Technology has invested USD 13 million to bolster its Canadian operations. This investment will launch of two new laboratories in Toronto, Ontario. One of these is an advanced life sciences laboratory focusing on pharmaceutical testing. The upgraded facility boasts enhancements across various departments, such as metals testing and materials characterization, positioning Element to better cater to the surging demands of the pharmaceutical and biotechnology sectors.June 2024: UL Solutions Inc. announced plans to build a new facility called the Advanced Automotive and Battery Testing Center in Pyeongtaek, Gyeonggi-do, Korea. This initiative aims to enhance the existing battery testing capacity of UL Solutions in the region while also incorporating EV charger testing and various other capabilities. It is projected to commence operations in the latter part of 2025. The primary goals of this venture include bolstering Korea's EV industry, addressing the growing demand from both new and current clients, and streamlining the process of safety and performance testing as well as other related services.March 2024: Applus+ played a prominent role in the technical supervision of the project for the construction of the 220 kV Transmission Line Derivation L-2264 between the Ishcayucro and Raurapata substations. This project's scope encompassed the construction of a single-circuit 220 kV transmission line and a new GIS 220/33/22.9 kV substation in Raurapata. The line, with a length of 28.3 km, uses ACSR 591mm2 conductor and lattice steel structures.
9. What pricing options are available for accessing the report?
Pricing options include single-user, multi-user, and enterprise licenses priced at USD 4750, USD 5250, and USD 8750 respectively.
10. Is the market size provided in terms of value or volume?
The market size is provided in terms of value, measured in Million and volume, measured in Billion.
11. Are there any specific market keywords associated with the report?
Yes, the market keyword associated with the report is "TIC Market For The Metals And Minerals Industry," which aids in identifying and referencing the specific market segment covered.
12. How do I determine which pricing option suits my needs best?
The pricing options vary based on user requirements and access needs. Individual users may opt for single-user licenses, while businesses requiring broader access may choose multi-user or enterprise licenses for cost-effective access to the report.
13. Are there any additional resources or data provided in the TIC Market For The Metals And Minerals Industry report?
While the report offers comprehensive insights, it's advisable to review the specific contents or supplementary materials provided to ascertain if additional resources or data are available.
14. How can I stay updated on further developments or reports in the TIC Market For The Metals And Minerals Industry?
To stay informed about further developments, trends, and reports in the TIC Market For The Metals And Minerals Industry, consider subscribing to industry newsletters, following relevant companies and organizations, or regularly checking reputable industry news sources and publications.
Methodology
Step 1 - Identification of Relevant Samples Size from Population Database


Step 2 - Approaches for Defining Global Market Size (Value, Volume* & Price*)

Note*: In applicable scenarios
Step 3 - Data Sources
Primary Research
- Web Analytics
- Survey Reports
- Research Institute
- Latest Research Reports
- Opinion Leaders
Secondary Research
- Annual Reports
- White Paper
- Latest Press Release
- Industry Association
- Paid Database
- Investor Presentations

Step 4 - Data Triangulation
Involves using different sources of information in order to increase the validity of a study
These sources are likely to be stakeholders in a program - participants, other researchers, program staff, other community members, and so on.
Then we put all data in single framework & apply various statistical tools to find out the dynamic on the market.
During the analysis stage, feedback from the stakeholder groups would be compared to determine areas of agreement as well as areas of divergence