

Key Insights
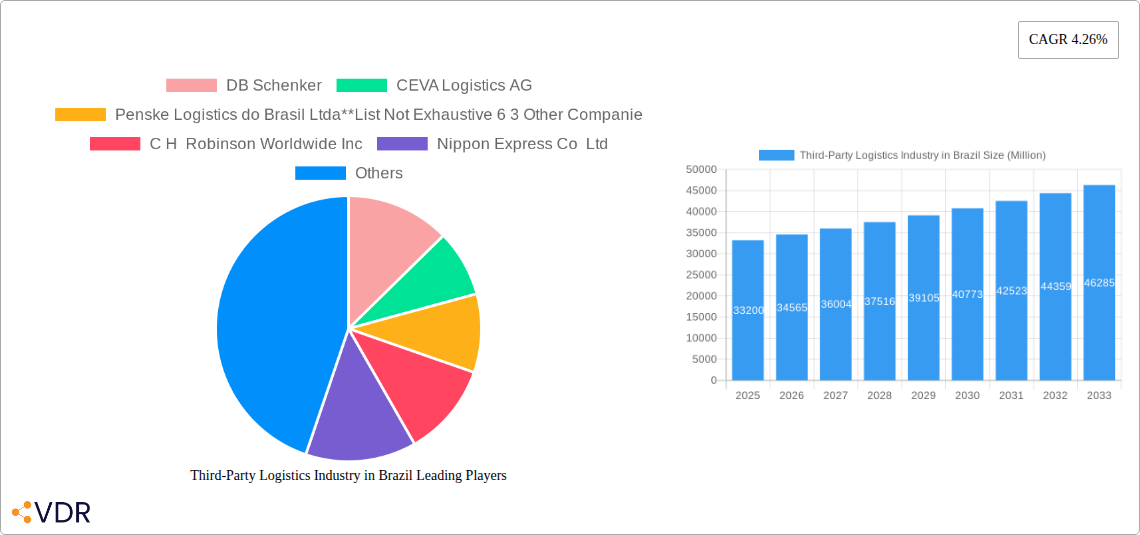
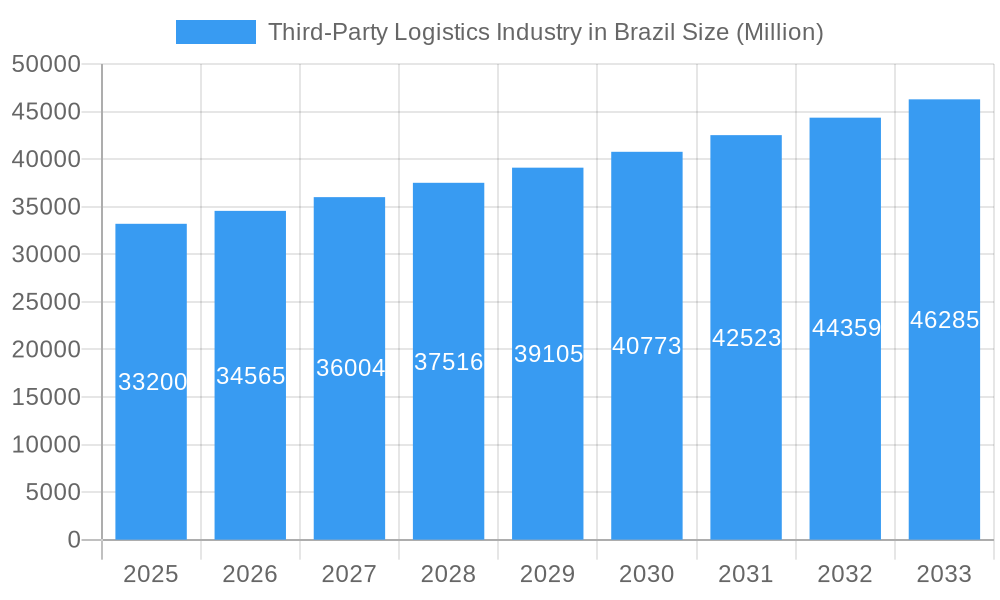
The Brazilian third-party logistics (3PL) market, valued at $33.20 billion in 2025, is experiencing robust growth, projected to expand at a compound annual growth rate (CAGR) of 4.26% from 2025 to 2033. This expansion is fueled by several key drivers. The burgeoning e-commerce sector in Brazil is significantly increasing demand for efficient and reliable logistics solutions, driving the need for 3PL providers to manage the complexities of last-mile delivery and warehousing. Furthermore, the growth of manufacturing and industrial sectors, particularly in automotive, chemicals, and consumer goods, necessitates sophisticated supply chain management, bolstering the 3PL market. Increased focus on supply chain optimization and cost reduction among businesses, coupled with the rising adoption of advanced technologies such as automation and data analytics within logistics operations, are further contributing to market expansion. The market is segmented by service type (domestic transportation, international transportation, value-added warehousing and distribution) and end-user industry (automobile, chemicals, consumer & retail, energy, engineering & manufacturing, life sciences & healthcare, and others). Leading players include DB Schenker, CEVA Logistics, Penske Logistics, C.H. Robinson, Nippon Express, Kuehne + Nagel, FedEx, BBM Logística, DSV, Deutsche Post, and Gafor, showcasing a competitive landscape with both global and regional players vying for market share.
Third-Party Logistics Industry in Brazil Market Size (In Billion)
The market's growth trajectory, however, faces certain challenges. Infrastructure limitations, including underdeveloped transportation networks in certain regions, pose a significant constraint. Fluctuations in the Brazilian economy and currency exchange rates also create uncertainty for businesses investing in logistics solutions. Regulatory hurdles and bureaucratic processes can add complexity and cost to operations. Despite these challenges, the long-term outlook for the Brazilian 3PL market remains positive, driven by sustained economic growth, evolving consumer behavior, and the ongoing adoption of advanced technologies within the logistics sector. The increasing focus on sustainable and environmentally friendly logistics practices is also expected to shape market dynamics in the coming years, creating opportunities for 3PL providers that prioritize green initiatives. The competitive landscape will likely continue to evolve, with mergers and acquisitions, and strategic partnerships potentially shaping the market structure.
Third-Party Logistics Industry in Brazil Company Market Share
Third-Party Logistics (3PL) Industry in Brazil: Market Report 2019-2033
This comprehensive report provides an in-depth analysis of the Brazilian 3PL market, encompassing market dynamics, growth trends, key players, and future outlook. The study period covers 2019-2033, with a base year of 2025 and a forecast period of 2025-2033. This report is crucial for logistics providers, investors, and businesses operating in or considering entry into the dynamic Brazilian market. The report incorporates data on key segments including Domestic Transportation Management, International Transportation Management, and Value-added Warehousing & Distribution; and end-users like Automobile, Chemicals, Consumer & Retail, and more.
Third-Party Logistics Industry in Brazil Market Dynamics & Structure
The Brazilian Third-Party Logistics (3PL) market is a dynamic landscape characterized by a moderate level of concentration. It features a blend of established large multinational corporations and prominent domestic players actively competing with a substantial number of agile smaller firms. The market size is projected to reach approximately **[Insert Market Size in Million for 2025] Million** in 2025, having demonstrated a Compound Annual Growth Rate (CAGR) of **[Insert CAGR % for 2019-2024]**% during the historical period from 2019 to 2024. The sustained growth trajectory is primarily fueled by the accelerating penetration of e-commerce, the expansion of industrial activities across various sectors, and ongoing investments in infrastructure development. However, navigating the complexities of regulatory frameworks and managing economic volatility remain significant challenges for market participants.
- Market Concentration: In 2025, the top 10 key players are expected to collectively hold approximately **[Insert Market Share % for Top 10 Players in 2025]**% of the total market share.
- Technological Innovation: There is a discernible, albeit gradual, increase in the adoption of advanced technologies such as Artificial Intelligence (AI), the Internet of Things (IoT), and blockchain solutions. However, widespread implementation is often hindered by substantial initial investment costs and a persistent shortage of skilled professionals capable of managing these sophisticated systems.
- Regulatory Framework: Government regulations pertaining to logistics, taxation, and customs procedures exert a considerable influence on market dynamics. Ongoing efforts are focused on simplifying and harmonizing these regulations to foster a more conducive business environment.
- Competitive Substitutes: A notable competitive pressure arises from the increasing trend of select companies opting to internalize their logistics functions, thereby reducing their reliance on external 3PL providers.
- End-User Demographics: The primary growth impetus is derived from the robust expansion of the consumer and retail, automotive, and manufacturing sectors, all of which are increasingly leveraging 3PL services to optimize their supply chains.
- M&A Trends: Consolidation within the industry is anticipated, with **[Insert Number of M&A Deals]** mergers and acquisition deals recorded between 2019 and 2024, representing a cumulative value of **[Insert Total M&A Value in Million] Million**.
Third-Party Logistics Industry in Brazil Growth Trends & Insights
The Brazilian 3PL market has consistently showcased a strong growth performance, largely propelled by a thriving e-commerce ecosystem, the growing trend of businesses outsourcing logistics functions to enhance operational efficiency, and strategic government initiatives aimed at upgrading infrastructure. The market size experienced significant expansion, growing from **[Insert Market Size in Million for 2019] Million** in 2019 to **[Insert Market Size in Million for 2024] Million** in 2024, reflecting a compelling CAGR of **[Insert CAGR % for 2019-2024]**%. This upward growth trajectory is forecast to persist throughout the projected period (2025-2033), driven by a confluence of factors including the steady growth of the middle class, an uptick in cross-border trade activities, and continuous advancements in logistics technology. The adoption rate of 3PL services, particularly within the value-added warehousing segment, indicates substantial untapped potential. Furthermore, evolving consumer behaviors, especially the pronounced shift towards online purchasing, are acting as a significant catalyst for increased demand.
Dominant Regions, Countries, or Segments in Third-Party Logistics Industry in Brazil
The Southeastern region of Brazil, a vital economic hub encompassing major metropolitan centers such as São Paulo and Rio de Janeiro, stands as the dominant force in the 3PL market. This dominance is attributed to its high concentration of industrial operations and a substantial consumer base. Within the service offerings, Value-added Warehousing and Distribution has emerged as a leading segment. This growth is largely propelled by the burgeoning e-commerce sector, which demands sophisticated inventory management and efficient fulfillment solutions. Among the various end-user industries, the Consumer and Retail sector exhibits exceptional growth potential, driven by increasing e-commerce penetration and the evolving preferences of consumers.
- Key Drivers in Southeastern Region: The region benefits from well-developed infrastructure, a high population density, and the presence of established industrial clusters, all contributing to its logistical prominence.
- Key Drivers in Value-added Warehousing and Distribution: The exponential growth of e-commerce, coupled with the increasing demand for streamlined order fulfillment processes and the widespread adoption of advanced warehousing technologies, are key drivers for this segment.
- Key Drivers in Consumer & Retail: Rising disposable incomes, the escalating trend of online shopping, and a greater diversification of product offerings are fueling the growth within the consumer and retail end-user segment.
Third-Party Logistics Industry in Brazil Product Landscape
The Brazilian 3PL market offers a comprehensive and diversified portfolio of services designed to meet the complex needs of modern supply chains. This includes robust domestic and international transportation management solutions, sophisticated warehousing capabilities, and a suite of value-added services. These value-added offerings encompass critical functions such as precise inventory management, efficient order fulfillment, and adept reverse logistics. Recent innovations are primarily centered on enhancing supply chain visibility through real-time tracking systems, boosting operational efficiency via automation technologies, and optimizing overall supply chain performance through the application of advanced analytics. Increasingly, the unique selling propositions of 3PL providers are being defined by their ability to deliver customized solutions meticulously tailored to the specific requirements of individual clients, leveraging technology to ensure enhanced transparency and robust control throughout the logistics process.
Key Drivers, Barriers & Challenges in Third-Party Logistics Industry in Brazil
Key Drivers: The expansion of the e-commerce sector, a growing propensity for businesses to outsource logistics operations, strategic investments in infrastructure development by the government, and the continuous evolution of logistics technology are collectively acting as significant drivers for market growth.
Key Challenges: The industry faces considerable obstacles in the form of high infrastructure costs, complex bureaucratic processes, an often inconsistent regulatory landscape, and a notable shortage of skilled labor. Furthermore, security concerns, particularly related to cargo theft, represent a substantial challenge, leading to increased operational costs and potentially impeding the growth of certain market segments. For instance, the estimated annual cost attributable to cargo theft in Brazil amounts to **[Insert Estimated Annual Cost of Cargo Theft in Million] Million**, significantly impacting market profitability.
Emerging Opportunities in Third-Party Logistics Industry in Brazil
Untapped potential exists in expanding 3PL services to smaller businesses and in less-developed regions. The integration of cutting-edge technologies like AI and blockchain holds significant opportunities for enhanced efficiency, transparency, and security. Furthermore, growth in niche sectors like cold chain logistics and specialized transportation presents unique market entry points for 3PL providers.
Growth Accelerators in the Third-Party Logistics Industry in Brazil Industry
Strategic partnerships, particularly between 3PL providers and technology companies specializing in logistics solutions, represent a significant growth accelerator. Further investment in infrastructure, particularly in less-developed regions, will unlock untapped market potential. Finally, focusing on sustainable and environmentally friendly logistics solutions is gaining momentum and presents a key opportunity for differentiation and growth.
Key Players Shaping the Third-Party Logistics Industry in Brazil Market
- DB Schenker
- CEVA Logistics AG
- Penske Logistics do Brasil Ltda
- 6 3 Other Companies
- C.H. Robinson Worldwide Inc
- Nippon Express Co Ltd
- Kuehne + Nagel International AG
- FedEx
- BBM Logística SA
- DSV AS
- Deutsche Post AG
- Gafor SA
Notable Milestones in Third-Party Logistics Industry in Brazil Sector
- 2021 Q3: Implementation of new customs regulations streamlining import/export procedures.
- 2022 Q1: Launch of a major e-commerce platform, driving increased demand for 3PL services.
- 2023 Q2: Successful completion of a significant M&A deal involving two major 3PL providers. (Further details in the full report)
In-Depth Third-Party Logistics Industry in Brazil Market Outlook
The Brazilian 3PL market is poised for continued strong growth over the forecast period (2025-2033), driven by robust economic expansion, sustained growth in e-commerce, and increasing adoption of advanced logistics technologies. Strategic partnerships, investments in infrastructure, and a focus on sustainability will be key to unlocking the full market potential and shaping the competitive landscape. The market is expected to reach xx Million by 2033, representing significant opportunities for both established players and new entrants.
Third-Party Logistics Industry in Brazil Segmentation
-
1. Services
- 1.1. Domestic Transportation Management
- 1.2. International Transportation Management
- 1.3. Value-added Warehousing and Distribution
-
2. End User
- 2.1. Automobile
- 2.2. Chemicals
- 2.3. Consumer and Retail
- 2.4. Energy
- 2.5. Engineering and Manufacturing
- 2.6. Life Science and Healthcare
- 2.7. Other End User
Third-Party Logistics Industry in Brazil Segmentation By Geography
-
1. North America
- 1.1. United States
- 1.2. Canada
- 1.3. Mexico
-
2. South America
- 2.1. Brazil
- 2.2. Argentina
- 2.3. Rest of South America
-
3. Europe
- 3.1. United Kingdom
- 3.2. Germany
- 3.3. France
- 3.4. Italy
- 3.5. Spain
- 3.6. Russia
- 3.7. Benelux
- 3.8. Nordics
- 3.9. Rest of Europe
-
4. Middle East & Africa
- 4.1. Turkey
- 4.2. Israel
- 4.3. GCC
- 4.4. North Africa
- 4.5. South Africa
- 4.6. Rest of Middle East & Africa
-
5. Asia Pacific
- 5.1. China
- 5.2. India
- 5.3. Japan
- 5.4. South Korea
- 5.5. ASEAN
- 5.6. Oceania
- 5.7. Rest of Asia Pacific
Third-Party Logistics Industry in Brazil Regional Market Share
Geographic Coverage of Third-Party Logistics Industry in Brazil
Third-Party Logistics Industry in Brazil REPORT HIGHLIGHTS
| Aspects | Details |
|---|---|
| Study Period | 2020-2034 |
| Base Year | 2025 |
| Estimated Year | 2026 |
| Forecast Period | 2026-2034 |
| Historical Period | 2020-2025 |
| Growth Rate | CAGR of 4.26% from 2020-2034 |
| Segmentation |
|
Table of Contents
- 1. Introduction
- 1.1. Research Scope
- 1.2. Market Segmentation
- 1.3. Research Objective
- 1.4. Definitions and Assumptions
- 2. Executive Summary
- 2.1. Market Snapshot
- 3. Market Dynamics
- 3.1. Market Drivers
- 3.2. Market Restrains
- 3.3. Market Trends
- 3.4. Market Opportunities
- 4. Market Factor Analysis
- 4.1. Porters Five Forces
- 4.1.1. Bargaining Power of Suppliers
- 4.1.2. Bargaining Power of Buyers
- 4.1.3. Threat of New Entrants
- 4.1.4. Threat of Substitutes
- 4.1.5. Competitive Rivalry
- 4.2. PESTEL analysis
- 4.3. BCG Analysis
- 4.3.1. Stars (High Growth, High Market Share)
- 4.3.2. Cash Cows (Low Growth, High Market Share)
- 4.3.3. Question Mark (High Growth, Low Market Share)
- 4.3.4. Dogs (Low Growth, Low Market Share)
- 4.4. Ansoff Matrix Analysis
- 4.5. Supply Chain Analysis
- 4.6. Regulatory Landscape
- 4.7. Current Market Potential and Opportunity Assessment (TAM–SAM–SOM Framework)
- 4.8. VDR Analyst Note
- 4.1. Porters Five Forces
- 5. Market Analysis, Insights and Forecast 2021-2033
- 5.1. Market Analysis, Insights and Forecast - by Services
- 5.1.1. Domestic Transportation Management
- 5.1.2. International Transportation Management
- 5.1.3. Value-added Warehousing and Distribution
- 5.2. Market Analysis, Insights and Forecast - by End User
- 5.2.1. Automobile
- 5.2.2. Chemicals
- 5.2.3. Consumer and Retail
- 5.2.4. Energy
- 5.2.5. Engineering and Manufacturing
- 5.2.6. Life Science and Healthcare
- 5.2.7. Other End User
- 5.3. Market Analysis, Insights and Forecast - by Region
- 5.3.1. North America
- 5.3.2. South America
- 5.3.3. Europe
- 5.3.4. Middle East & Africa
- 5.3.5. Asia Pacific
- 5.1. Market Analysis, Insights and Forecast - by Services
- 6. Global Third-Party Logistics Industry in Brazil Analysis, Insights and Forecast, 2021-2033
- 6.1. Market Analysis, Insights and Forecast - by Services
- 6.1.1. Domestic Transportation Management
- 6.1.2. International Transportation Management
- 6.1.3. Value-added Warehousing and Distribution
- 6.2. Market Analysis, Insights and Forecast - by End User
- 6.2.1. Automobile
- 6.2.2. Chemicals
- 6.2.3. Consumer and Retail
- 6.2.4. Energy
- 6.2.5. Engineering and Manufacturing
- 6.2.6. Life Science and Healthcare
- 6.2.7. Other End User
- 6.1. Market Analysis, Insights and Forecast - by Services
- 7. North America Third-Party Logistics Industry in Brazil Analysis, Insights and Forecast, 2021-2033
- 7.1. Market Analysis, Insights and Forecast - by Services
- 7.1.1. Domestic Transportation Management
- 7.1.2. International Transportation Management
- 7.1.3. Value-added Warehousing and Distribution
- 7.2. Market Analysis, Insights and Forecast - by End User
- 7.2.1. Automobile
- 7.2.2. Chemicals
- 7.2.3. Consumer and Retail
- 7.2.4. Energy
- 7.2.5. Engineering and Manufacturing
- 7.2.6. Life Science and Healthcare
- 7.2.7. Other End User
- 7.1. Market Analysis, Insights and Forecast - by Services
- 8. South America Third-Party Logistics Industry in Brazil Analysis, Insights and Forecast, 2021-2033
- 8.1. Market Analysis, Insights and Forecast - by Services
- 8.1.1. Domestic Transportation Management
- 8.1.2. International Transportation Management
- 8.1.3. Value-added Warehousing and Distribution
- 8.2. Market Analysis, Insights and Forecast - by End User
- 8.2.1. Automobile
- 8.2.2. Chemicals
- 8.2.3. Consumer and Retail
- 8.2.4. Energy
- 8.2.5. Engineering and Manufacturing
- 8.2.6. Life Science and Healthcare
- 8.2.7. Other End User
- 8.1. Market Analysis, Insights and Forecast - by Services
- 9. Europe Third-Party Logistics Industry in Brazil Analysis, Insights and Forecast, 2021-2033
- 9.1. Market Analysis, Insights and Forecast - by Services
- 9.1.1. Domestic Transportation Management
- 9.1.2. International Transportation Management
- 9.1.3. Value-added Warehousing and Distribution
- 9.2. Market Analysis, Insights and Forecast - by End User
- 9.2.1. Automobile
- 9.2.2. Chemicals
- 9.2.3. Consumer and Retail
- 9.2.4. Energy
- 9.2.5. Engineering and Manufacturing
- 9.2.6. Life Science and Healthcare
- 9.2.7. Other End User
- 9.1. Market Analysis, Insights and Forecast - by Services
- 10. Middle East & Africa Third-Party Logistics Industry in Brazil Analysis, Insights and Forecast, 2021-2033
- 10.1. Market Analysis, Insights and Forecast - by Services
- 10.1.1. Domestic Transportation Management
- 10.1.2. International Transportation Management
- 10.1.3. Value-added Warehousing and Distribution
- 10.2. Market Analysis, Insights and Forecast - by End User
- 10.2.1. Automobile
- 10.2.2. Chemicals
- 10.2.3. Consumer and Retail
- 10.2.4. Energy
- 10.2.5. Engineering and Manufacturing
- 10.2.6. Life Science and Healthcare
- 10.2.7. Other End User
- 10.1. Market Analysis, Insights and Forecast - by Services
- 11. Asia Pacific Third-Party Logistics Industry in Brazil Analysis, Insights and Forecast, 2021-2033
- 11.1. Market Analysis, Insights and Forecast - by Services
- 11.1.1. Domestic Transportation Management
- 11.1.2. International Transportation Management
- 11.1.3. Value-added Warehousing and Distribution
- 11.2. Market Analysis, Insights and Forecast - by End User
- 11.2.1. Automobile
- 11.2.2. Chemicals
- 11.2.3. Consumer and Retail
- 11.2.4. Energy
- 11.2.5. Engineering and Manufacturing
- 11.2.6. Life Science and Healthcare
- 11.2.7. Other End User
- 11.1. Market Analysis, Insights and Forecast - by Services
- 12. Competitive Analysis
- 12.1. Company Profiles
- 12.1.1 DB Schenker
- 12.1.1.1. Company Overview
- 12.1.1.2. Products
- 12.1.1.3. Company Financials
- 12.1.1.4. SWOT Analysis
- 12.1.2 CEVA Logistics AG
- 12.1.2.1. Company Overview
- 12.1.2.2. Products
- 12.1.2.3. Company Financials
- 12.1.2.4. SWOT Analysis
- 12.1.3 Penske Logistics do Brasil Ltda**List Not Exhaustive 6 3 Other Companie
- 12.1.3.1. Company Overview
- 12.1.3.2. Products
- 12.1.3.3. Company Financials
- 12.1.3.4. SWOT Analysis
- 12.1.4 C H Robinson Worldwide Inc
- 12.1.4.1. Company Overview
- 12.1.4.2. Products
- 12.1.4.3. Company Financials
- 12.1.4.4. SWOT Analysis
- 12.1.5 Nippon Express Co Ltd
- 12.1.5.1. Company Overview
- 12.1.5.2. Products
- 12.1.5.3. Company Financials
- 12.1.5.4. SWOT Analysis
- 12.1.6 Kuehne + Nagel International AG
- 12.1.6.1. Company Overview
- 12.1.6.2. Products
- 12.1.6.3. Company Financials
- 12.1.6.4. SWOT Analysis
- 12.1.7 FedEx
- 12.1.7.1. Company Overview
- 12.1.7.2. Products
- 12.1.7.3. Company Financials
- 12.1.7.4. SWOT Analysis
- 12.1.8 BBM Logística SA
- 12.1.8.1. Company Overview
- 12.1.8.2. Products
- 12.1.8.3. Company Financials
- 12.1.8.4. SWOT Analysis
- 12.1.9 DSV AS
- 12.1.9.1. Company Overview
- 12.1.9.2. Products
- 12.1.9.3. Company Financials
- 12.1.9.4. SWOT Analysis
- 12.1.10 Deutsche Post AG
- 12.1.10.1. Company Overview
- 12.1.10.2. Products
- 12.1.10.3. Company Financials
- 12.1.10.4. SWOT Analysis
- 12.1.11 Gafor SA
- 12.1.11.1. Company Overview
- 12.1.11.2. Products
- 12.1.11.3. Company Financials
- 12.1.11.4. SWOT Analysis
- 12.1.1 DB Schenker
- 12.2. Market Entropy
- 12.2.1 Company's Key Areas Served
- 12.2.2 Recent Developments
- 12.3. Company Market Share Analysis 2025
- 12.3.1 Top 5 Companies Market Share Analysis
- 12.3.2 Top 3 Companies Market Share Analysis
- 12.4. List of Potential Customers
- 13. Research Methodology
List of Figures
- Figure 1: Global Third-Party Logistics Industry in Brazil Revenue Breakdown (Million, %) by Region 2025 & 2033
- Figure 2: North America Third-Party Logistics Industry in Brazil Revenue (Million), by Services 2025 & 2033
- Figure 3: North America Third-Party Logistics Industry in Brazil Revenue Share (%), by Services 2025 & 2033
- Figure 4: North America Third-Party Logistics Industry in Brazil Revenue (Million), by End User 2025 & 2033
- Figure 5: North America Third-Party Logistics Industry in Brazil Revenue Share (%), by End User 2025 & 2033
- Figure 6: North America Third-Party Logistics Industry in Brazil Revenue (Million), by Country 2025 & 2033
- Figure 7: North America Third-Party Logistics Industry in Brazil Revenue Share (%), by Country 2025 & 2033
- Figure 8: South America Third-Party Logistics Industry in Brazil Revenue (Million), by Services 2025 & 2033
- Figure 9: South America Third-Party Logistics Industry in Brazil Revenue Share (%), by Services 2025 & 2033
- Figure 10: South America Third-Party Logistics Industry in Brazil Revenue (Million), by End User 2025 & 2033
- Figure 11: South America Third-Party Logistics Industry in Brazil Revenue Share (%), by End User 2025 & 2033
- Figure 12: South America Third-Party Logistics Industry in Brazil Revenue (Million), by Country 2025 & 2033
- Figure 13: South America Third-Party Logistics Industry in Brazil Revenue Share (%), by Country 2025 & 2033
- Figure 14: Europe Third-Party Logistics Industry in Brazil Revenue (Million), by Services 2025 & 2033
- Figure 15: Europe Third-Party Logistics Industry in Brazil Revenue Share (%), by Services 2025 & 2033
- Figure 16: Europe Third-Party Logistics Industry in Brazil Revenue (Million), by End User 2025 & 2033
- Figure 17: Europe Third-Party Logistics Industry in Brazil Revenue Share (%), by End User 2025 & 2033
- Figure 18: Europe Third-Party Logistics Industry in Brazil Revenue (Million), by Country 2025 & 2033
- Figure 19: Europe Third-Party Logistics Industry in Brazil Revenue Share (%), by Country 2025 & 2033
- Figure 20: Middle East & Africa Third-Party Logistics Industry in Brazil Revenue (Million), by Services 2025 & 2033
- Figure 21: Middle East & Africa Third-Party Logistics Industry in Brazil Revenue Share (%), by Services 2025 & 2033
- Figure 22: Middle East & Africa Third-Party Logistics Industry in Brazil Revenue (Million), by End User 2025 & 2033
- Figure 23: Middle East & Africa Third-Party Logistics Industry in Brazil Revenue Share (%), by End User 2025 & 2033
- Figure 24: Middle East & Africa Third-Party Logistics Industry in Brazil Revenue (Million), by Country 2025 & 2033
- Figure 25: Middle East & Africa Third-Party Logistics Industry in Brazil Revenue Share (%), by Country 2025 & 2033
- Figure 26: Asia Pacific Third-Party Logistics Industry in Brazil Revenue (Million), by Services 2025 & 2033
- Figure 27: Asia Pacific Third-Party Logistics Industry in Brazil Revenue Share (%), by Services 2025 & 2033
- Figure 28: Asia Pacific Third-Party Logistics Industry in Brazil Revenue (Million), by End User 2025 & 2033
- Figure 29: Asia Pacific Third-Party Logistics Industry in Brazil Revenue Share (%), by End User 2025 & 2033
- Figure 30: Asia Pacific Third-Party Logistics Industry in Brazil Revenue (Million), by Country 2025 & 2033
- Figure 31: Asia Pacific Third-Party Logistics Industry in Brazil Revenue Share (%), by Country 2025 & 2033
List of Tables
- Table 1: Global Third-Party Logistics Industry in Brazil Revenue Million Forecast, by Services 2020 & 2033
- Table 2: Global Third-Party Logistics Industry in Brazil Revenue Million Forecast, by End User 2020 & 2033
- Table 3: Global Third-Party Logistics Industry in Brazil Revenue Million Forecast, by Region 2020 & 2033
- Table 4: Global Third-Party Logistics Industry in Brazil Revenue Million Forecast, by Services 2020 & 2033
- Table 5: Global Third-Party Logistics Industry in Brazil Revenue Million Forecast, by End User 2020 & 2033
- Table 6: Global Third-Party Logistics Industry in Brazil Revenue Million Forecast, by Country 2020 & 2033
- Table 7: United States Third-Party Logistics Industry in Brazil Revenue (Million) Forecast, by Application 2020 & 2033
- Table 8: Canada Third-Party Logistics Industry in Brazil Revenue (Million) Forecast, by Application 2020 & 2033
- Table 9: Mexico Third-Party Logistics Industry in Brazil Revenue (Million) Forecast, by Application 2020 & 2033
- Table 10: Global Third-Party Logistics Industry in Brazil Revenue Million Forecast, by Services 2020 & 2033
- Table 11: Global Third-Party Logistics Industry in Brazil Revenue Million Forecast, by End User 2020 & 2033
- Table 12: Global Third-Party Logistics Industry in Brazil Revenue Million Forecast, by Country 2020 & 2033
- Table 13: Brazil Third-Party Logistics Industry in Brazil Revenue (Million) Forecast, by Application 2020 & 2033
- Table 14: Argentina Third-Party Logistics Industry in Brazil Revenue (Million) Forecast, by Application 2020 & 2033
- Table 15: Rest of South America Third-Party Logistics Industry in Brazil Revenue (Million) Forecast, by Application 2020 & 2033
- Table 16: Global Third-Party Logistics Industry in Brazil Revenue Million Forecast, by Services 2020 & 2033
- Table 17: Global Third-Party Logistics Industry in Brazil Revenue Million Forecast, by End User 2020 & 2033
- Table 18: Global Third-Party Logistics Industry in Brazil Revenue Million Forecast, by Country 2020 & 2033
- Table 19: United Kingdom Third-Party Logistics Industry in Brazil Revenue (Million) Forecast, by Application 2020 & 2033
- Table 20: Germany Third-Party Logistics Industry in Brazil Revenue (Million) Forecast, by Application 2020 & 2033
- Table 21: France Third-Party Logistics Industry in Brazil Revenue (Million) Forecast, by Application 2020 & 2033
- Table 22: Italy Third-Party Logistics Industry in Brazil Revenue (Million) Forecast, by Application 2020 & 2033
- Table 23: Spain Third-Party Logistics Industry in Brazil Revenue (Million) Forecast, by Application 2020 & 2033
- Table 24: Russia Third-Party Logistics Industry in Brazil Revenue (Million) Forecast, by Application 2020 & 2033
- Table 25: Benelux Third-Party Logistics Industry in Brazil Revenue (Million) Forecast, by Application 2020 & 2033
- Table 26: Nordics Third-Party Logistics Industry in Brazil Revenue (Million) Forecast, by Application 2020 & 2033
- Table 27: Rest of Europe Third-Party Logistics Industry in Brazil Revenue (Million) Forecast, by Application 2020 & 2033
- Table 28: Global Third-Party Logistics Industry in Brazil Revenue Million Forecast, by Services 2020 & 2033
- Table 29: Global Third-Party Logistics Industry in Brazil Revenue Million Forecast, by End User 2020 & 2033
- Table 30: Global Third-Party Logistics Industry in Brazil Revenue Million Forecast, by Country 2020 & 2033
- Table 31: Turkey Third-Party Logistics Industry in Brazil Revenue (Million) Forecast, by Application 2020 & 2033
- Table 32: Israel Third-Party Logistics Industry in Brazil Revenue (Million) Forecast, by Application 2020 & 2033
- Table 33: GCC Third-Party Logistics Industry in Brazil Revenue (Million) Forecast, by Application 2020 & 2033
- Table 34: North Africa Third-Party Logistics Industry in Brazil Revenue (Million) Forecast, by Application 2020 & 2033
- Table 35: South Africa Third-Party Logistics Industry in Brazil Revenue (Million) Forecast, by Application 2020 & 2033
- Table 36: Rest of Middle East & Africa Third-Party Logistics Industry in Brazil Revenue (Million) Forecast, by Application 2020 & 2033
- Table 37: Global Third-Party Logistics Industry in Brazil Revenue Million Forecast, by Services 2020 & 2033
- Table 38: Global Third-Party Logistics Industry in Brazil Revenue Million Forecast, by End User 2020 & 2033
- Table 39: Global Third-Party Logistics Industry in Brazil Revenue Million Forecast, by Country 2020 & 2033
- Table 40: China Third-Party Logistics Industry in Brazil Revenue (Million) Forecast, by Application 2020 & 2033
- Table 41: India Third-Party Logistics Industry in Brazil Revenue (Million) Forecast, by Application 2020 & 2033
- Table 42: Japan Third-Party Logistics Industry in Brazil Revenue (Million) Forecast, by Application 2020 & 2033
- Table 43: South Korea Third-Party Logistics Industry in Brazil Revenue (Million) Forecast, by Application 2020 & 2033
- Table 44: ASEAN Third-Party Logistics Industry in Brazil Revenue (Million) Forecast, by Application 2020 & 2033
- Table 45: Oceania Third-Party Logistics Industry in Brazil Revenue (Million) Forecast, by Application 2020 & 2033
- Table 46: Rest of Asia Pacific Third-Party Logistics Industry in Brazil Revenue (Million) Forecast, by Application 2020 & 2033
Frequently Asked Questions
1. What is the projected Compound Annual Growth Rate (CAGR) of the Third-Party Logistics Industry in Brazil?
The projected CAGR is approximately 4.26%.
2. Which companies are prominent players in the Third-Party Logistics Industry in Brazil?
Key companies in the market include DB Schenker, CEVA Logistics AG, Penske Logistics do Brasil Ltda**List Not Exhaustive 6 3 Other Companie, C H Robinson Worldwide Inc, Nippon Express Co Ltd, Kuehne + Nagel International AG, FedEx, BBM Logística SA, DSV AS, Deutsche Post AG, Gafor SA.
3. What are the main segments of the Third-Party Logistics Industry in Brazil?
The market segments include Services, End User.
4. Can you provide details about the market size?
The market size is estimated to be USD 33.20 Million as of 2022.
5. What are some drivers contributing to market growth?
E-commerce Fueling the Growth of 3PL Market.
6. What are the notable trends driving market growth?
Increasing Freight Trucking is Driving Market Growth.
7. Are there any restraints impacting market growth?
Slow Infrastructure Development.
8. Can you provide examples of recent developments in the market?
N/A
9. What pricing options are available for accessing the report?
Pricing options include single-user, multi-user, and enterprise licenses priced at USD 3800, USD 4500, and USD 5800 respectively.
10. Is the market size provided in terms of value or volume?
The market size is provided in terms of value, measured in Million.
11. Are there any specific market keywords associated with the report?
Yes, the market keyword associated with the report is "Third-Party Logistics Industry in Brazil," which aids in identifying and referencing the specific market segment covered.
12. How do I determine which pricing option suits my needs best?
The pricing options vary based on user requirements and access needs. Individual users may opt for single-user licenses, while businesses requiring broader access may choose multi-user or enterprise licenses for cost-effective access to the report.
13. Are there any additional resources or data provided in the Third-Party Logistics Industry in Brazil report?
While the report offers comprehensive insights, it's advisable to review the specific contents or supplementary materials provided to ascertain if additional resources or data are available.
14. How can I stay updated on further developments or reports in the Third-Party Logistics Industry in Brazil?
To stay informed about further developments, trends, and reports in the Third-Party Logistics Industry in Brazil, consider subscribing to industry newsletters, following relevant companies and organizations, or regularly checking reputable industry news sources and publications.
Methodology
Step 1 - Identification of Relevant Samples Size from Population Database


Step 2 - Approaches for Defining Global Market Size (Value, Volume* & Price*)

Note*: In applicable scenarios
Step 3 - Data Sources
Primary Research
- Web Analytics
- Survey Reports
- Research Institute
- Latest Research Reports
- Opinion Leaders
Secondary Research
- Annual Reports
- White Paper
- Latest Press Release
- Industry Association
- Paid Database
- Investor Presentations

Step 4 - Data Triangulation
Involves using different sources of information in order to increase the validity of a study
These sources are likely to be stakeholders in a program - participants, other researchers, program staff, other community members, and so on.
Then we put all data in single framework & apply various statistical tools to find out the dynamic on the market.
During the analysis stage, feedback from the stakeholder groups would be compared to determine areas of agreement as well as areas of divergence