

Key Insights
The thermoplastic composites market, projected to reach $34 billion by 2025, is set for substantial expansion with a projected compound annual growth rate (CAGR) of 8.4% from 2025 to 2033. Key drivers for this growth include the escalating demand for lightweight, high-strength materials in sectors like automotive and aerospace. Automotive manufacturers are increasingly integrating thermoplastic composites to enhance fuel efficiency and meet sustainability targets, while the aerospace industry utilizes their superior performance in critical applications. Innovations in material science and manufacturing are continuously improving the properties and cost-effectiveness of these composites, broadening their use in electronics, construction, and medical devices. The cost-efficient and easily processed nature of short fiber thermoplastic (SFT) composites further accelerates market penetration.
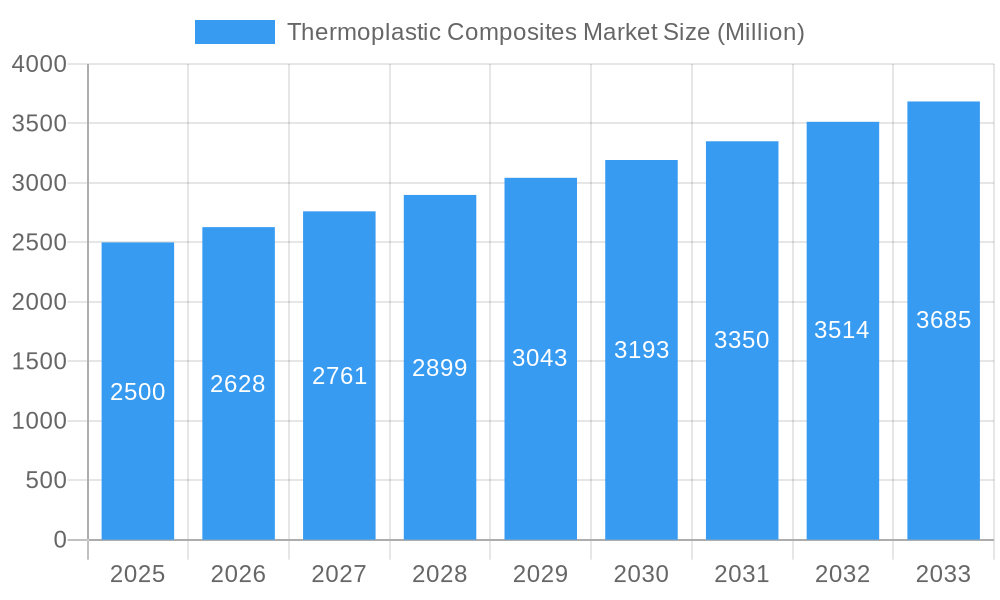
Thermoplastic Composites Market Market Size (In Billion)
However, the market is not without its challenges. The higher cost of premium thermoplastic composites, such as those with carbon fiber or PEEK resin, may limit adoption in cost-sensitive industries. Furthermore, concerns surrounding the recycling and waste management of composite materials necessitate further research into sustainable alternatives. Despite these hurdles, ongoing advancements in recyclability and the development of bio-based thermoplastic composites are expected to address these issues. The market’s segmentation by resin, fiber, product form (SFT, LFT, CFT, GMT), and end-user industry highlights its diverse applications and tailored material solutions. Regional leadership is anticipated from North America and Asia Pacific due to their robust industrial and manufacturing bases.
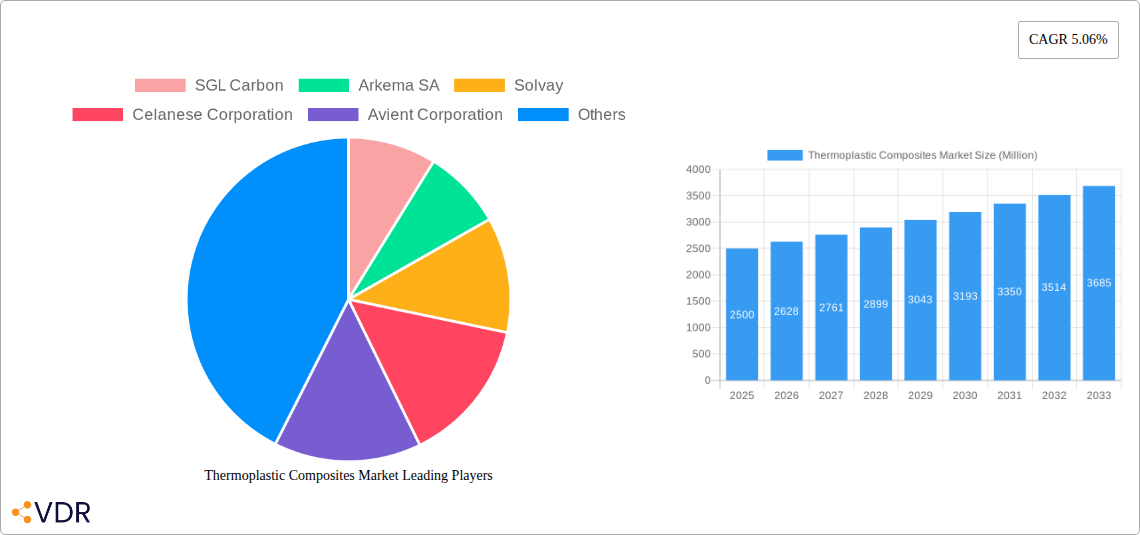
Thermoplastic Composites Market Company Market Share
Thermoplastic Composites Market: A Comprehensive Report (2019-2033)
This in-depth report provides a comprehensive analysis of the Thermoplastic Composites market, covering market dynamics, growth trends, regional segmentation, product landscape, key players, and future outlook. The study period spans from 2019 to 2033, with 2025 as the base and estimated year. The report is essential for industry professionals, investors, and strategic decision-makers seeking a thorough understanding of this rapidly evolving market. The market size is projected to reach xx Million by 2033.
Parent Market: Advanced Materials Market Child Markets: Automotive Composites, Aerospace Composites, Construction Composites
Thermoplastic Composites Market Dynamics & Structure
The thermoplastic composites market exhibits a moderately concentrated structure, with key players like SGL Carbon, Arkema SA, and Solvay holding significant market share. Technological innovation, driven by the need for lightweight, high-performance materials, is a major growth driver. Stringent regulatory frameworks concerning environmental impact and safety standards influence material selection and manufacturing processes. Competition from traditional thermoset composites necessitates continuous product improvement and cost optimization. The end-user demographics are diverse, with automotive, aerospace, and electronics sectors representing substantial market segments. Mergers and acquisitions (M&A) activity has been moderate, reflecting strategic consolidation within the industry.
- Market Concentration: Moderately concentrated, with top 5 players holding approximately xx% market share in 2024.
- Technological Innovation Drivers: Lightweighting requirements, improved mechanical properties, and enhanced recyclability.
- Regulatory Frameworks: Focus on sustainability, emissions reduction, and safety regulations impacting material selection and production methods.
- Competitive Product Substitutes: Thermoset composites and other high-performance materials pose competition.
- End-User Demographics: Automotive, aerospace, and electronics sectors are key consumers.
- M&A Trends: Moderate activity, with strategic acquisitions driving consolidation and expansion. xx M&A deals recorded between 2019 and 2024.
Thermoplastic Composites Market Growth Trends & Insights
The thermoplastic composites market has witnessed significant growth over the historical period (2019-2024), driven by increasing demand from diverse end-use sectors. The market size experienced a CAGR of xx% during this period, reaching xx Million in 2024. This positive trajectory is projected to continue through the forecast period (2025-2033), with a projected CAGR of xx%, primarily fueled by technological advancements, rising adoption rates in lightweighting applications, and shifting consumer preferences toward sustainable materials. Market penetration in key industries such as automotive and aerospace is steadily increasing. Technological disruptions, such as the introduction of novel fiber types and resin systems, further enhance market growth. Consumer behavior shifts towards environmentally friendly and cost-effective solutions also contribute to the market's expansion.
Dominant Regions, Countries, or Segments in Thermoplastic Composites Market
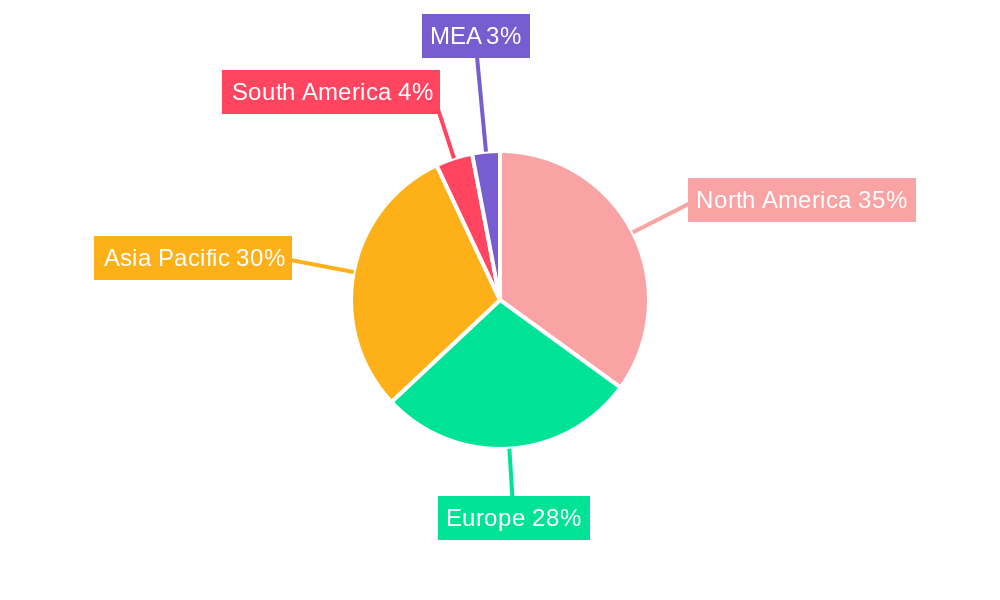
The North American region currently holds the dominant position in the thermoplastic composites market, driven by robust automotive and aerospace industries. Europe follows closely, exhibiting strong growth potential due to favorable government policies and increasing investments in infrastructure. Asia Pacific is expected to witness the fastest growth rate over the forecast period, fueled by rapid industrialization and substantial investments in renewable energy.
Dominant Segments:
- Resin Type: Polypropylene (PP) holds the largest market share, followed by Polyamide (PA). The PEEK segment shows the highest growth potential.
- Fiber Type: Glass Fiber dominates due to its cost-effectiveness, with Carbon Fiber showing substantial growth in high-performance applications.
- Product Type: Long Fiber Thermoplastic (LFT) and Short Fiber Thermoplastic (SFT) are currently the dominant product types, with Continuous Fiber Thermoplastic (CFT) showing significant growth potential.
- End-user Industry: The automotive industry leads the market, followed by aerospace and defense. Growth in the electrical and electronics sectors is also expected.
Key Drivers:
- Strong growth in the automotive and aerospace industries.
- Increasing demand for lightweight materials.
- Favorable government policies and initiatives.
- Technological advancements in material properties and manufacturing processes.
Thermoplastic Composites Market Product Landscape
The thermoplastic composites market features a diverse product landscape, encompassing various resin and fiber types tailored to specific applications. Recent innovations focus on enhancing mechanical strength, thermal resistance, and chemical stability. Products are designed with unique selling propositions, such as recyclability and improved processing efficiency, targeting specific end-user needs. Technological advancements in fiber reinforcement, resin matrix design, and manufacturing techniques are driving the creation of novel composite materials with superior performance characteristics.
Key Drivers, Barriers & Challenges in Thermoplastic Composites Market
Key Drivers:
- Growing demand for lightweight and high-strength materials across various industries.
- Increasing focus on sustainability and recyclability.
- Advancements in manufacturing technologies, such as automated fiber placement.
Key Challenges:
- High initial investment costs for manufacturing equipment.
- Competition from established thermoset composites.
- Potential supply chain disruptions related to raw material availability.
Emerging Opportunities in Thermoplastic Composites Market
Emerging opportunities lie in the expansion into untapped markets, such as renewable energy and consumer goods. Innovative applications, including 3D printing and additive manufacturing of thermoplastic composites, are opening new avenues for market growth. Evolving consumer preferences toward sustainable and recyclable products are driving demand for environmentally friendly thermoplastic composites.
Growth Accelerators in the Thermoplastic Composites Market Industry
Long-term growth in the thermoplastic composites market is driven by technological advancements, particularly in fiber and resin technologies, leading to improved material properties and reduced manufacturing costs. Strategic partnerships and collaborations between material suppliers and end-users are accelerating the adoption of thermoplastic composites in high-volume applications. Market expansion into emerging economies, particularly in Asia Pacific, further contributes to sustained market growth.
Key Players Shaping the Thermoplastic Composites Market Market
- SGL Carbon
- Arkema SA
- Solvay
- Celanese Corporation
- Avient Corporation
- LANXESS
- BASF SE
- SABIC
- DSM
- Daicel Corporation
- Toray Industries Inc
- Mitsubishi Chemical Group Corporation
- Hexcel Corporation
- AVANCO Group
- TechnoCompound GmbH
- LyondellBasell Industries Holdings BV
Notable Milestones in Thermoplastic Composites Market Sector
- April 2023: LANXESS and Advent International launched a joint venture focused on engineering materials, combining DSM's Engineering Materials segment and LANXESS's former High-Performance Materials business.
- April 2023: Solvay and GKN Aerospace extended their partnership to develop a thermoplastic composites roadmap for aircraft structures.
In-Depth Thermoplastic Composites Market Market Outlook
The thermoplastic composites market is poised for substantial growth, fueled by ongoing technological advancements and increasing demand from key industries. Strategic partnerships, focused innovation, and expansion into new application areas will drive long-term market expansion. The potential for sustainable and high-performance materials positions thermoplastic composites as a key player in the future of advanced materials.
Thermoplastic Composites Market Segmentation
-
1. Resin Type
- 1.1. Polypropylene (PP)
- 1.2. Polyamide (PA)
- 1.3. Polyetheretherketone (PEEK)
- 1.4. Other Resin Types
-
2. Fiber Type
- 2.1. Glass Fiber
- 2.2. Carbon Fiber
- 2.3. Other Fiber Types
-
3. Product Type
- 3.1. Short Fiber Thermoplastic (SFT)
- 3.2. Long Fiber Thermoplastic (LFT)
- 3.3. Continuous Fiber Thermoplastic (CFT)
- 3.4. Glass Mat Thermoplastic (GMT)
-
4. End-user Industry
- 4.1. Automotive
- 4.2. Construction
- 4.3. Medical
- 4.4. Other End-user Industries
Thermoplastic Composites Market Segmentation By Geography
-
1. Asia Pacific
- 1.1. China
- 1.2. India
- 1.3. Japan
- 1.4. South Korea
- 1.5. ASEAN Countries
- 1.6. Rest of Asia Pacific
-
2. North America
- 2.1. United States
- 2.2. Canada
- 2.3. Mexico
-
3. Europe
- 3.1. Germany
- 3.2. United Kingdom
- 3.3. France
- 3.4. Italy
- 3.5. Rest of Europe
-
4. South America
- 4.1. Brazil
- 4.2. Argentina
- 4.3. Rest of South America
-
5. Middle East and Africa
- 5.1. Saudi Arabia
- 5.2. South Africa
- 5.3. Rest of Middle East and Africa
Thermoplastic Composites Market Regional Market Share
Geographic Coverage of Thermoplastic Composites Market
Thermoplastic Composites Market REPORT HIGHLIGHTS
| Aspects | Details |
|---|---|
| Study Period | 2020-2034 |
| Base Year | 2025 |
| Estimated Year | 2026 |
| Forecast Period | 2026-2034 |
| Historical Period | 2020-2025 |
| Growth Rate | CAGR of 8.4% from 2020-2034 |
| Segmentation |
|
Table of Contents
- 1. Introduction
- 1.1. Research Scope
- 1.2. Market Segmentation
- 1.3. Research Objective
- 1.4. Definitions and Assumptions
- 2. Executive Summary
- 2.1. Market Snapshot
- 3. Market Dynamics
- 3.1. Market Drivers
- 3.2. Market Restrains
- 3.3. Market Trends
- 3.4. Market Opportunities
- 4. Market Factor Analysis
- 4.1. Porters Five Forces
- 4.1.1. Bargaining Power of Suppliers
- 4.1.2. Bargaining Power of Buyers
- 4.1.3. Threat of New Entrants
- 4.1.4. Threat of Substitutes
- 4.1.5. Competitive Rivalry
- 4.2. PESTEL analysis
- 4.3. BCG Analysis
- 4.3.1. Stars (High Growth, High Market Share)
- 4.3.2. Cash Cows (Low Growth, High Market Share)
- 4.3.3. Question Mark (High Growth, Low Market Share)
- 4.3.4. Dogs (Low Growth, Low Market Share)
- 4.4. Ansoff Matrix Analysis
- 4.5. Supply Chain Analysis
- 4.6. Regulatory Landscape
- 4.7. Current Market Potential and Opportunity Assessment (TAM–SAM–SOM Framework)
- 4.8. VDR Analyst Note
- 4.1. Porters Five Forces
- 5. Market Analysis, Insights and Forecast 2021-2033
- 5.1. Market Analysis, Insights and Forecast - by Resin Type
- 5.1.1. Polypropylene (PP)
- 5.1.2. Polyamide (PA)
- 5.1.3. Polyetheretherketone (PEEK)
- 5.1.4. Other Resin Types
- 5.2. Market Analysis, Insights and Forecast - by Fiber Type
- 5.2.1. Glass Fiber
- 5.2.2. Carbon Fiber
- 5.2.3. Other Fiber Types
- 5.3. Market Analysis, Insights and Forecast - by Product Type
- 5.3.1. Short Fiber Thermoplastic (SFT)
- 5.3.2. Long Fiber Thermoplastic (LFT)
- 5.3.3. Continuous Fiber Thermoplastic (CFT)
- 5.3.4. Glass Mat Thermoplastic (GMT)
- 5.4. Market Analysis, Insights and Forecast - by End-user Industry
- 5.4.1. Automotive
- 5.4.2. Construction
- 5.4.3. Medical
- 5.4.4. Other End-user Industries
- 5.5. Market Analysis, Insights and Forecast - by Region
- 5.5.1. Asia Pacific
- 5.5.2. North America
- 5.5.3. Europe
- 5.5.4. South America
- 5.5.5. Middle East and Africa
- 5.1. Market Analysis, Insights and Forecast - by Resin Type
- 6. Global Thermoplastic Composites Market Analysis, Insights and Forecast, 2021-2033
- 6.1. Market Analysis, Insights and Forecast - by Resin Type
- 6.1.1. Polypropylene (PP)
- 6.1.2. Polyamide (PA)
- 6.1.3. Polyetheretherketone (PEEK)
- 6.1.4. Other Resin Types
- 6.2. Market Analysis, Insights and Forecast - by Fiber Type
- 6.2.1. Glass Fiber
- 6.2.2. Carbon Fiber
- 6.2.3. Other Fiber Types
- 6.3. Market Analysis, Insights and Forecast - by Product Type
- 6.3.1. Short Fiber Thermoplastic (SFT)
- 6.3.2. Long Fiber Thermoplastic (LFT)
- 6.3.3. Continuous Fiber Thermoplastic (CFT)
- 6.3.4. Glass Mat Thermoplastic (GMT)
- 6.4. Market Analysis, Insights and Forecast - by End-user Industry
- 6.4.1. Automotive
- 6.4.2. Construction
- 6.4.3. Medical
- 6.4.4. Other End-user Industries
- 6.1. Market Analysis, Insights and Forecast - by Resin Type
- 7. Asia Pacific Thermoplastic Composites Market Analysis, Insights and Forecast, 2021-2033
- 7.1. Market Analysis, Insights and Forecast - by Resin Type
- 7.1.1. Polypropylene (PP)
- 7.1.2. Polyamide (PA)
- 7.1.3. Polyetheretherketone (PEEK)
- 7.1.4. Other Resin Types
- 7.2. Market Analysis, Insights and Forecast - by Fiber Type
- 7.2.1. Glass Fiber
- 7.2.2. Carbon Fiber
- 7.2.3. Other Fiber Types
- 7.3. Market Analysis, Insights and Forecast - by Product Type
- 7.3.1. Short Fiber Thermoplastic (SFT)
- 7.3.2. Long Fiber Thermoplastic (LFT)
- 7.3.3. Continuous Fiber Thermoplastic (CFT)
- 7.3.4. Glass Mat Thermoplastic (GMT)
- 7.4. Market Analysis, Insights and Forecast - by End-user Industry
- 7.4.1. Automotive
- 7.4.2. Construction
- 7.4.3. Medical
- 7.4.4. Other End-user Industries
- 7.1. Market Analysis, Insights and Forecast - by Resin Type
- 8. North America Thermoplastic Composites Market Analysis, Insights and Forecast, 2021-2033
- 8.1. Market Analysis, Insights and Forecast - by Resin Type
- 8.1.1. Polypropylene (PP)
- 8.1.2. Polyamide (PA)
- 8.1.3. Polyetheretherketone (PEEK)
- 8.1.4. Other Resin Types
- 8.2. Market Analysis, Insights and Forecast - by Fiber Type
- 8.2.1. Glass Fiber
- 8.2.2. Carbon Fiber
- 8.2.3. Other Fiber Types
- 8.3. Market Analysis, Insights and Forecast - by Product Type
- 8.3.1. Short Fiber Thermoplastic (SFT)
- 8.3.2. Long Fiber Thermoplastic (LFT)
- 8.3.3. Continuous Fiber Thermoplastic (CFT)
- 8.3.4. Glass Mat Thermoplastic (GMT)
- 8.4. Market Analysis, Insights and Forecast - by End-user Industry
- 8.4.1. Automotive
- 8.4.2. Construction
- 8.4.3. Medical
- 8.4.4. Other End-user Industries
- 8.1. Market Analysis, Insights and Forecast - by Resin Type
- 9. Europe Thermoplastic Composites Market Analysis, Insights and Forecast, 2021-2033
- 9.1. Market Analysis, Insights and Forecast - by Resin Type
- 9.1.1. Polypropylene (PP)
- 9.1.2. Polyamide (PA)
- 9.1.3. Polyetheretherketone (PEEK)
- 9.1.4. Other Resin Types
- 9.2. Market Analysis, Insights and Forecast - by Fiber Type
- 9.2.1. Glass Fiber
- 9.2.2. Carbon Fiber
- 9.2.3. Other Fiber Types
- 9.3. Market Analysis, Insights and Forecast - by Product Type
- 9.3.1. Short Fiber Thermoplastic (SFT)
- 9.3.2. Long Fiber Thermoplastic (LFT)
- 9.3.3. Continuous Fiber Thermoplastic (CFT)
- 9.3.4. Glass Mat Thermoplastic (GMT)
- 9.4. Market Analysis, Insights and Forecast - by End-user Industry
- 9.4.1. Automotive
- 9.4.2. Construction
- 9.4.3. Medical
- 9.4.4. Other End-user Industries
- 9.1. Market Analysis, Insights and Forecast - by Resin Type
- 10. South America Thermoplastic Composites Market Analysis, Insights and Forecast, 2021-2033
- 10.1. Market Analysis, Insights and Forecast - by Resin Type
- 10.1.1. Polypropylene (PP)
- 10.1.2. Polyamide (PA)
- 10.1.3. Polyetheretherketone (PEEK)
- 10.1.4. Other Resin Types
- 10.2. Market Analysis, Insights and Forecast - by Fiber Type
- 10.2.1. Glass Fiber
- 10.2.2. Carbon Fiber
- 10.2.3. Other Fiber Types
- 10.3. Market Analysis, Insights and Forecast - by Product Type
- 10.3.1. Short Fiber Thermoplastic (SFT)
- 10.3.2. Long Fiber Thermoplastic (LFT)
- 10.3.3. Continuous Fiber Thermoplastic (CFT)
- 10.3.4. Glass Mat Thermoplastic (GMT)
- 10.4. Market Analysis, Insights and Forecast - by End-user Industry
- 10.4.1. Automotive
- 10.4.2. Construction
- 10.4.3. Medical
- 10.4.4. Other End-user Industries
- 10.1. Market Analysis, Insights and Forecast - by Resin Type
- 11. Middle East and Africa Thermoplastic Composites Market Analysis, Insights and Forecast, 2021-2033
- 11.1. Market Analysis, Insights and Forecast - by Resin Type
- 11.1.1. Polypropylene (PP)
- 11.1.2. Polyamide (PA)
- 11.1.3. Polyetheretherketone (PEEK)
- 11.1.4. Other Resin Types
- 11.2. Market Analysis, Insights and Forecast - by Fiber Type
- 11.2.1. Glass Fiber
- 11.2.2. Carbon Fiber
- 11.2.3. Other Fiber Types
- 11.3. Market Analysis, Insights and Forecast - by Product Type
- 11.3.1. Short Fiber Thermoplastic (SFT)
- 11.3.2. Long Fiber Thermoplastic (LFT)
- 11.3.3. Continuous Fiber Thermoplastic (CFT)
- 11.3.4. Glass Mat Thermoplastic (GMT)
- 11.4. Market Analysis, Insights and Forecast - by End-user Industry
- 11.4.1. Automotive
- 11.4.2. Construction
- 11.4.3. Medical
- 11.4.4. Other End-user Industries
- 11.1. Market Analysis, Insights and Forecast - by Resin Type
- 12. Competitive Analysis
- 12.1. Company Profiles
- 12.1.1 SGL Carbon
- 12.1.1.1. Company Overview
- 12.1.1.2. Products
- 12.1.1.3. Company Financials
- 12.1.1.4. SWOT Analysis
- 12.1.2 Arkema SA
- 12.1.2.1. Company Overview
- 12.1.2.2. Products
- 12.1.2.3. Company Financials
- 12.1.2.4. SWOT Analysis
- 12.1.3 Solvay
- 12.1.3.1. Company Overview
- 12.1.3.2. Products
- 12.1.3.3. Company Financials
- 12.1.3.4. SWOT Analysis
- 12.1.4 Celanese Corporation
- 12.1.4.1. Company Overview
- 12.1.4.2. Products
- 12.1.4.3. Company Financials
- 12.1.4.4. SWOT Analysis
- 12.1.5 Avient Corporation
- 12.1.5.1. Company Overview
- 12.1.5.2. Products
- 12.1.5.3. Company Financials
- 12.1.5.4. SWOT Analysis
- 12.1.6 LANXESS
- 12.1.6.1. Company Overview
- 12.1.6.2. Products
- 12.1.6.3. Company Financials
- 12.1.6.4. SWOT Analysis
- 12.1.7 BASF SE
- 12.1.7.1. Company Overview
- 12.1.7.2. Products
- 12.1.7.3. Company Financials
- 12.1.7.4. SWOT Analysis
- 12.1.8 SABIC
- 12.1.8.1. Company Overview
- 12.1.8.2. Products
- 12.1.8.3. Company Financials
- 12.1.8.4. SWOT Analysis
- 12.1.9 DSM
- 12.1.9.1. Company Overview
- 12.1.9.2. Products
- 12.1.9.3. Company Financials
- 12.1.9.4. SWOT Analysis
- 12.1.10 Daicel Corporation
- 12.1.10.1. Company Overview
- 12.1.10.2. Products
- 12.1.10.3. Company Financials
- 12.1.10.4. SWOT Analysis
- 12.1.11 Toray Industries Inc
- 12.1.11.1. Company Overview
- 12.1.11.2. Products
- 12.1.11.3. Company Financials
- 12.1.11.4. SWOT Analysis
- 12.1.12 Mitsubishi Chemical Group Corporation
- 12.1.12.1. Company Overview
- 12.1.12.2. Products
- 12.1.12.3. Company Financials
- 12.1.12.4. SWOT Analysis
- 12.1.13 Hexcel Corporation
- 12.1.13.1. Company Overview
- 12.1.13.2. Products
- 12.1.13.3. Company Financials
- 12.1.13.4. SWOT Analysis
- 12.1.14 AVANCO Group
- 12.1.14.1. Company Overview
- 12.1.14.2. Products
- 12.1.14.3. Company Financials
- 12.1.14.4. SWOT Analysis
- 12.1.15 TechnoCompound GmbH
- 12.1.15.1. Company Overview
- 12.1.15.2. Products
- 12.1.15.3. Company Financials
- 12.1.15.4. SWOT Analysis
- 12.1.16 LyondellBasell Industries Holdings BV
- 12.1.16.1. Company Overview
- 12.1.16.2. Products
- 12.1.16.3. Company Financials
- 12.1.16.4. SWOT Analysis
- 12.1.1 SGL Carbon
- 12.2. Market Entropy
- 12.2.1 Company's Key Areas Served
- 12.2.2 Recent Developments
- 12.3. Company Market Share Analysis 2025
- 12.3.1 Top 5 Companies Market Share Analysis
- 12.3.2 Top 3 Companies Market Share Analysis
- 12.4. List of Potential Customers
- 13. Research Methodology
List of Figures
- Figure 1: Global Thermoplastic Composites Market Revenue Breakdown (billion, %) by Region 2025 & 2033
- Figure 2: Global Thermoplastic Composites Market Volume Breakdown (K Tons, %) by Region 2025 & 2033
- Figure 3: Asia Pacific Thermoplastic Composites Market Revenue (billion), by Resin Type 2025 & 2033
- Figure 4: Asia Pacific Thermoplastic Composites Market Volume (K Tons), by Resin Type 2025 & 2033
- Figure 5: Asia Pacific Thermoplastic Composites Market Revenue Share (%), by Resin Type 2025 & 2033
- Figure 6: Asia Pacific Thermoplastic Composites Market Volume Share (%), by Resin Type 2025 & 2033
- Figure 7: Asia Pacific Thermoplastic Composites Market Revenue (billion), by Fiber Type 2025 & 2033
- Figure 8: Asia Pacific Thermoplastic Composites Market Volume (K Tons), by Fiber Type 2025 & 2033
- Figure 9: Asia Pacific Thermoplastic Composites Market Revenue Share (%), by Fiber Type 2025 & 2033
- Figure 10: Asia Pacific Thermoplastic Composites Market Volume Share (%), by Fiber Type 2025 & 2033
- Figure 11: Asia Pacific Thermoplastic Composites Market Revenue (billion), by Product Type 2025 & 2033
- Figure 12: Asia Pacific Thermoplastic Composites Market Volume (K Tons), by Product Type 2025 & 2033
- Figure 13: Asia Pacific Thermoplastic Composites Market Revenue Share (%), by Product Type 2025 & 2033
- Figure 14: Asia Pacific Thermoplastic Composites Market Volume Share (%), by Product Type 2025 & 2033
- Figure 15: Asia Pacific Thermoplastic Composites Market Revenue (billion), by End-user Industry 2025 & 2033
- Figure 16: Asia Pacific Thermoplastic Composites Market Volume (K Tons), by End-user Industry 2025 & 2033
- Figure 17: Asia Pacific Thermoplastic Composites Market Revenue Share (%), by End-user Industry 2025 & 2033
- Figure 18: Asia Pacific Thermoplastic Composites Market Volume Share (%), by End-user Industry 2025 & 2033
- Figure 19: Asia Pacific Thermoplastic Composites Market Revenue (billion), by Country 2025 & 2033
- Figure 20: Asia Pacific Thermoplastic Composites Market Volume (K Tons), by Country 2025 & 2033
- Figure 21: Asia Pacific Thermoplastic Composites Market Revenue Share (%), by Country 2025 & 2033
- Figure 22: Asia Pacific Thermoplastic Composites Market Volume Share (%), by Country 2025 & 2033
- Figure 23: North America Thermoplastic Composites Market Revenue (billion), by Resin Type 2025 & 2033
- Figure 24: North America Thermoplastic Composites Market Volume (K Tons), by Resin Type 2025 & 2033
- Figure 25: North America Thermoplastic Composites Market Revenue Share (%), by Resin Type 2025 & 2033
- Figure 26: North America Thermoplastic Composites Market Volume Share (%), by Resin Type 2025 & 2033
- Figure 27: North America Thermoplastic Composites Market Revenue (billion), by Fiber Type 2025 & 2033
- Figure 28: North America Thermoplastic Composites Market Volume (K Tons), by Fiber Type 2025 & 2033
- Figure 29: North America Thermoplastic Composites Market Revenue Share (%), by Fiber Type 2025 & 2033
- Figure 30: North America Thermoplastic Composites Market Volume Share (%), by Fiber Type 2025 & 2033
- Figure 31: North America Thermoplastic Composites Market Revenue (billion), by Product Type 2025 & 2033
- Figure 32: North America Thermoplastic Composites Market Volume (K Tons), by Product Type 2025 & 2033
- Figure 33: North America Thermoplastic Composites Market Revenue Share (%), by Product Type 2025 & 2033
- Figure 34: North America Thermoplastic Composites Market Volume Share (%), by Product Type 2025 & 2033
- Figure 35: North America Thermoplastic Composites Market Revenue (billion), by End-user Industry 2025 & 2033
- Figure 36: North America Thermoplastic Composites Market Volume (K Tons), by End-user Industry 2025 & 2033
- Figure 37: North America Thermoplastic Composites Market Revenue Share (%), by End-user Industry 2025 & 2033
- Figure 38: North America Thermoplastic Composites Market Volume Share (%), by End-user Industry 2025 & 2033
- Figure 39: North America Thermoplastic Composites Market Revenue (billion), by Country 2025 & 2033
- Figure 40: North America Thermoplastic Composites Market Volume (K Tons), by Country 2025 & 2033
- Figure 41: North America Thermoplastic Composites Market Revenue Share (%), by Country 2025 & 2033
- Figure 42: North America Thermoplastic Composites Market Volume Share (%), by Country 2025 & 2033
- Figure 43: Europe Thermoplastic Composites Market Revenue (billion), by Resin Type 2025 & 2033
- Figure 44: Europe Thermoplastic Composites Market Volume (K Tons), by Resin Type 2025 & 2033
- Figure 45: Europe Thermoplastic Composites Market Revenue Share (%), by Resin Type 2025 & 2033
- Figure 46: Europe Thermoplastic Composites Market Volume Share (%), by Resin Type 2025 & 2033
- Figure 47: Europe Thermoplastic Composites Market Revenue (billion), by Fiber Type 2025 & 2033
- Figure 48: Europe Thermoplastic Composites Market Volume (K Tons), by Fiber Type 2025 & 2033
- Figure 49: Europe Thermoplastic Composites Market Revenue Share (%), by Fiber Type 2025 & 2033
- Figure 50: Europe Thermoplastic Composites Market Volume Share (%), by Fiber Type 2025 & 2033
- Figure 51: Europe Thermoplastic Composites Market Revenue (billion), by Product Type 2025 & 2033
- Figure 52: Europe Thermoplastic Composites Market Volume (K Tons), by Product Type 2025 & 2033
- Figure 53: Europe Thermoplastic Composites Market Revenue Share (%), by Product Type 2025 & 2033
- Figure 54: Europe Thermoplastic Composites Market Volume Share (%), by Product Type 2025 & 2033
- Figure 55: Europe Thermoplastic Composites Market Revenue (billion), by End-user Industry 2025 & 2033
- Figure 56: Europe Thermoplastic Composites Market Volume (K Tons), by End-user Industry 2025 & 2033
- Figure 57: Europe Thermoplastic Composites Market Revenue Share (%), by End-user Industry 2025 & 2033
- Figure 58: Europe Thermoplastic Composites Market Volume Share (%), by End-user Industry 2025 & 2033
- Figure 59: Europe Thermoplastic Composites Market Revenue (billion), by Country 2025 & 2033
- Figure 60: Europe Thermoplastic Composites Market Volume (K Tons), by Country 2025 & 2033
- Figure 61: Europe Thermoplastic Composites Market Revenue Share (%), by Country 2025 & 2033
- Figure 62: Europe Thermoplastic Composites Market Volume Share (%), by Country 2025 & 2033
- Figure 63: South America Thermoplastic Composites Market Revenue (billion), by Resin Type 2025 & 2033
- Figure 64: South America Thermoplastic Composites Market Volume (K Tons), by Resin Type 2025 & 2033
- Figure 65: South America Thermoplastic Composites Market Revenue Share (%), by Resin Type 2025 & 2033
- Figure 66: South America Thermoplastic Composites Market Volume Share (%), by Resin Type 2025 & 2033
- Figure 67: South America Thermoplastic Composites Market Revenue (billion), by Fiber Type 2025 & 2033
- Figure 68: South America Thermoplastic Composites Market Volume (K Tons), by Fiber Type 2025 & 2033
- Figure 69: South America Thermoplastic Composites Market Revenue Share (%), by Fiber Type 2025 & 2033
- Figure 70: South America Thermoplastic Composites Market Volume Share (%), by Fiber Type 2025 & 2033
- Figure 71: South America Thermoplastic Composites Market Revenue (billion), by Product Type 2025 & 2033
- Figure 72: South America Thermoplastic Composites Market Volume (K Tons), by Product Type 2025 & 2033
- Figure 73: South America Thermoplastic Composites Market Revenue Share (%), by Product Type 2025 & 2033
- Figure 74: South America Thermoplastic Composites Market Volume Share (%), by Product Type 2025 & 2033
- Figure 75: South America Thermoplastic Composites Market Revenue (billion), by End-user Industry 2025 & 2033
- Figure 76: South America Thermoplastic Composites Market Volume (K Tons), by End-user Industry 2025 & 2033
- Figure 77: South America Thermoplastic Composites Market Revenue Share (%), by End-user Industry 2025 & 2033
- Figure 78: South America Thermoplastic Composites Market Volume Share (%), by End-user Industry 2025 & 2033
- Figure 79: South America Thermoplastic Composites Market Revenue (billion), by Country 2025 & 2033
- Figure 80: South America Thermoplastic Composites Market Volume (K Tons), by Country 2025 & 2033
- Figure 81: South America Thermoplastic Composites Market Revenue Share (%), by Country 2025 & 2033
- Figure 82: South America Thermoplastic Composites Market Volume Share (%), by Country 2025 & 2033
- Figure 83: Middle East and Africa Thermoplastic Composites Market Revenue (billion), by Resin Type 2025 & 2033
- Figure 84: Middle East and Africa Thermoplastic Composites Market Volume (K Tons), by Resin Type 2025 & 2033
- Figure 85: Middle East and Africa Thermoplastic Composites Market Revenue Share (%), by Resin Type 2025 & 2033
- Figure 86: Middle East and Africa Thermoplastic Composites Market Volume Share (%), by Resin Type 2025 & 2033
- Figure 87: Middle East and Africa Thermoplastic Composites Market Revenue (billion), by Fiber Type 2025 & 2033
- Figure 88: Middle East and Africa Thermoplastic Composites Market Volume (K Tons), by Fiber Type 2025 & 2033
- Figure 89: Middle East and Africa Thermoplastic Composites Market Revenue Share (%), by Fiber Type 2025 & 2033
- Figure 90: Middle East and Africa Thermoplastic Composites Market Volume Share (%), by Fiber Type 2025 & 2033
- Figure 91: Middle East and Africa Thermoplastic Composites Market Revenue (billion), by Product Type 2025 & 2033
- Figure 92: Middle East and Africa Thermoplastic Composites Market Volume (K Tons), by Product Type 2025 & 2033
- Figure 93: Middle East and Africa Thermoplastic Composites Market Revenue Share (%), by Product Type 2025 & 2033
- Figure 94: Middle East and Africa Thermoplastic Composites Market Volume Share (%), by Product Type 2025 & 2033
- Figure 95: Middle East and Africa Thermoplastic Composites Market Revenue (billion), by End-user Industry 2025 & 2033
- Figure 96: Middle East and Africa Thermoplastic Composites Market Volume (K Tons), by End-user Industry 2025 & 2033
- Figure 97: Middle East and Africa Thermoplastic Composites Market Revenue Share (%), by End-user Industry 2025 & 2033
- Figure 98: Middle East and Africa Thermoplastic Composites Market Volume Share (%), by End-user Industry 2025 & 2033
- Figure 99: Middle East and Africa Thermoplastic Composites Market Revenue (billion), by Country 2025 & 2033
- Figure 100: Middle East and Africa Thermoplastic Composites Market Volume (K Tons), by Country 2025 & 2033
- Figure 101: Middle East and Africa Thermoplastic Composites Market Revenue Share (%), by Country 2025 & 2033
- Figure 102: Middle East and Africa Thermoplastic Composites Market Volume Share (%), by Country 2025 & 2033
List of Tables
- Table 1: Global Thermoplastic Composites Market Revenue billion Forecast, by Resin Type 2020 & 2033
- Table 2: Global Thermoplastic Composites Market Volume K Tons Forecast, by Resin Type 2020 & 2033
- Table 3: Global Thermoplastic Composites Market Revenue billion Forecast, by Fiber Type 2020 & 2033
- Table 4: Global Thermoplastic Composites Market Volume K Tons Forecast, by Fiber Type 2020 & 2033
- Table 5: Global Thermoplastic Composites Market Revenue billion Forecast, by Product Type 2020 & 2033
- Table 6: Global Thermoplastic Composites Market Volume K Tons Forecast, by Product Type 2020 & 2033
- Table 7: Global Thermoplastic Composites Market Revenue billion Forecast, by End-user Industry 2020 & 2033
- Table 8: Global Thermoplastic Composites Market Volume K Tons Forecast, by End-user Industry 2020 & 2033
- Table 9: Global Thermoplastic Composites Market Revenue billion Forecast, by Region 2020 & 2033
- Table 10: Global Thermoplastic Composites Market Volume K Tons Forecast, by Region 2020 & 2033
- Table 11: Global Thermoplastic Composites Market Revenue billion Forecast, by Resin Type 2020 & 2033
- Table 12: Global Thermoplastic Composites Market Volume K Tons Forecast, by Resin Type 2020 & 2033
- Table 13: Global Thermoplastic Composites Market Revenue billion Forecast, by Fiber Type 2020 & 2033
- Table 14: Global Thermoplastic Composites Market Volume K Tons Forecast, by Fiber Type 2020 & 2033
- Table 15: Global Thermoplastic Composites Market Revenue billion Forecast, by Product Type 2020 & 2033
- Table 16: Global Thermoplastic Composites Market Volume K Tons Forecast, by Product Type 2020 & 2033
- Table 17: Global Thermoplastic Composites Market Revenue billion Forecast, by End-user Industry 2020 & 2033
- Table 18: Global Thermoplastic Composites Market Volume K Tons Forecast, by End-user Industry 2020 & 2033
- Table 19: Global Thermoplastic Composites Market Revenue billion Forecast, by Country 2020 & 2033
- Table 20: Global Thermoplastic Composites Market Volume K Tons Forecast, by Country 2020 & 2033
- Table 21: China Thermoplastic Composites Market Revenue (billion) Forecast, by Application 2020 & 2033
- Table 22: China Thermoplastic Composites Market Volume (K Tons) Forecast, by Application 2020 & 2033
- Table 23: India Thermoplastic Composites Market Revenue (billion) Forecast, by Application 2020 & 2033
- Table 24: India Thermoplastic Composites Market Volume (K Tons) Forecast, by Application 2020 & 2033
- Table 25: Japan Thermoplastic Composites Market Revenue (billion) Forecast, by Application 2020 & 2033
- Table 26: Japan Thermoplastic Composites Market Volume (K Tons) Forecast, by Application 2020 & 2033
- Table 27: South Korea Thermoplastic Composites Market Revenue (billion) Forecast, by Application 2020 & 2033
- Table 28: South Korea Thermoplastic Composites Market Volume (K Tons) Forecast, by Application 2020 & 2033
- Table 29: ASEAN Countries Thermoplastic Composites Market Revenue (billion) Forecast, by Application 2020 & 2033
- Table 30: ASEAN Countries Thermoplastic Composites Market Volume (K Tons) Forecast, by Application 2020 & 2033
- Table 31: Rest of Asia Pacific Thermoplastic Composites Market Revenue (billion) Forecast, by Application 2020 & 2033
- Table 32: Rest of Asia Pacific Thermoplastic Composites Market Volume (K Tons) Forecast, by Application 2020 & 2033
- Table 33: Global Thermoplastic Composites Market Revenue billion Forecast, by Resin Type 2020 & 2033
- Table 34: Global Thermoplastic Composites Market Volume K Tons Forecast, by Resin Type 2020 & 2033
- Table 35: Global Thermoplastic Composites Market Revenue billion Forecast, by Fiber Type 2020 & 2033
- Table 36: Global Thermoplastic Composites Market Volume K Tons Forecast, by Fiber Type 2020 & 2033
- Table 37: Global Thermoplastic Composites Market Revenue billion Forecast, by Product Type 2020 & 2033
- Table 38: Global Thermoplastic Composites Market Volume K Tons Forecast, by Product Type 2020 & 2033
- Table 39: Global Thermoplastic Composites Market Revenue billion Forecast, by End-user Industry 2020 & 2033
- Table 40: Global Thermoplastic Composites Market Volume K Tons Forecast, by End-user Industry 2020 & 2033
- Table 41: Global Thermoplastic Composites Market Revenue billion Forecast, by Country 2020 & 2033
- Table 42: Global Thermoplastic Composites Market Volume K Tons Forecast, by Country 2020 & 2033
- Table 43: United States Thermoplastic Composites Market Revenue (billion) Forecast, by Application 2020 & 2033
- Table 44: United States Thermoplastic Composites Market Volume (K Tons) Forecast, by Application 2020 & 2033
- Table 45: Canada Thermoplastic Composites Market Revenue (billion) Forecast, by Application 2020 & 2033
- Table 46: Canada Thermoplastic Composites Market Volume (K Tons) Forecast, by Application 2020 & 2033
- Table 47: Mexico Thermoplastic Composites Market Revenue (billion) Forecast, by Application 2020 & 2033
- Table 48: Mexico Thermoplastic Composites Market Volume (K Tons) Forecast, by Application 2020 & 2033
- Table 49: Global Thermoplastic Composites Market Revenue billion Forecast, by Resin Type 2020 & 2033
- Table 50: Global Thermoplastic Composites Market Volume K Tons Forecast, by Resin Type 2020 & 2033
- Table 51: Global Thermoplastic Composites Market Revenue billion Forecast, by Fiber Type 2020 & 2033
- Table 52: Global Thermoplastic Composites Market Volume K Tons Forecast, by Fiber Type 2020 & 2033
- Table 53: Global Thermoplastic Composites Market Revenue billion Forecast, by Product Type 2020 & 2033
- Table 54: Global Thermoplastic Composites Market Volume K Tons Forecast, by Product Type 2020 & 2033
- Table 55: Global Thermoplastic Composites Market Revenue billion Forecast, by End-user Industry 2020 & 2033
- Table 56: Global Thermoplastic Composites Market Volume K Tons Forecast, by End-user Industry 2020 & 2033
- Table 57: Global Thermoplastic Composites Market Revenue billion Forecast, by Country 2020 & 2033
- Table 58: Global Thermoplastic Composites Market Volume K Tons Forecast, by Country 2020 & 2033
- Table 59: Germany Thermoplastic Composites Market Revenue (billion) Forecast, by Application 2020 & 2033
- Table 60: Germany Thermoplastic Composites Market Volume (K Tons) Forecast, by Application 2020 & 2033
- Table 61: United Kingdom Thermoplastic Composites Market Revenue (billion) Forecast, by Application 2020 & 2033
- Table 62: United Kingdom Thermoplastic Composites Market Volume (K Tons) Forecast, by Application 2020 & 2033
- Table 63: France Thermoplastic Composites Market Revenue (billion) Forecast, by Application 2020 & 2033
- Table 64: France Thermoplastic Composites Market Volume (K Tons) Forecast, by Application 2020 & 2033
- Table 65: Italy Thermoplastic Composites Market Revenue (billion) Forecast, by Application 2020 & 2033
- Table 66: Italy Thermoplastic Composites Market Volume (K Tons) Forecast, by Application 2020 & 2033
- Table 67: Rest of Europe Thermoplastic Composites Market Revenue (billion) Forecast, by Application 2020 & 2033
- Table 68: Rest of Europe Thermoplastic Composites Market Volume (K Tons) Forecast, by Application 2020 & 2033
- Table 69: Global Thermoplastic Composites Market Revenue billion Forecast, by Resin Type 2020 & 2033
- Table 70: Global Thermoplastic Composites Market Volume K Tons Forecast, by Resin Type 2020 & 2033
- Table 71: Global Thermoplastic Composites Market Revenue billion Forecast, by Fiber Type 2020 & 2033
- Table 72: Global Thermoplastic Composites Market Volume K Tons Forecast, by Fiber Type 2020 & 2033
- Table 73: Global Thermoplastic Composites Market Revenue billion Forecast, by Product Type 2020 & 2033
- Table 74: Global Thermoplastic Composites Market Volume K Tons Forecast, by Product Type 2020 & 2033
- Table 75: Global Thermoplastic Composites Market Revenue billion Forecast, by End-user Industry 2020 & 2033
- Table 76: Global Thermoplastic Composites Market Volume K Tons Forecast, by End-user Industry 2020 & 2033
- Table 77: Global Thermoplastic Composites Market Revenue billion Forecast, by Country 2020 & 2033
- Table 78: Global Thermoplastic Composites Market Volume K Tons Forecast, by Country 2020 & 2033
- Table 79: Brazil Thermoplastic Composites Market Revenue (billion) Forecast, by Application 2020 & 2033
- Table 80: Brazil Thermoplastic Composites Market Volume (K Tons) Forecast, by Application 2020 & 2033
- Table 81: Argentina Thermoplastic Composites Market Revenue (billion) Forecast, by Application 2020 & 2033
- Table 82: Argentina Thermoplastic Composites Market Volume (K Tons) Forecast, by Application 2020 & 2033
- Table 83: Rest of South America Thermoplastic Composites Market Revenue (billion) Forecast, by Application 2020 & 2033
- Table 84: Rest of South America Thermoplastic Composites Market Volume (K Tons) Forecast, by Application 2020 & 2033
- Table 85: Global Thermoplastic Composites Market Revenue billion Forecast, by Resin Type 2020 & 2033
- Table 86: Global Thermoplastic Composites Market Volume K Tons Forecast, by Resin Type 2020 & 2033
- Table 87: Global Thermoplastic Composites Market Revenue billion Forecast, by Fiber Type 2020 & 2033
- Table 88: Global Thermoplastic Composites Market Volume K Tons Forecast, by Fiber Type 2020 & 2033
- Table 89: Global Thermoplastic Composites Market Revenue billion Forecast, by Product Type 2020 & 2033
- Table 90: Global Thermoplastic Composites Market Volume K Tons Forecast, by Product Type 2020 & 2033
- Table 91: Global Thermoplastic Composites Market Revenue billion Forecast, by End-user Industry 2020 & 2033
- Table 92: Global Thermoplastic Composites Market Volume K Tons Forecast, by End-user Industry 2020 & 2033
- Table 93: Global Thermoplastic Composites Market Revenue billion Forecast, by Country 2020 & 2033
- Table 94: Global Thermoplastic Composites Market Volume K Tons Forecast, by Country 2020 & 2033
- Table 95: Saudi Arabia Thermoplastic Composites Market Revenue (billion) Forecast, by Application 2020 & 2033
- Table 96: Saudi Arabia Thermoplastic Composites Market Volume (K Tons) Forecast, by Application 2020 & 2033
- Table 97: South Africa Thermoplastic Composites Market Revenue (billion) Forecast, by Application 2020 & 2033
- Table 98: South Africa Thermoplastic Composites Market Volume (K Tons) Forecast, by Application 2020 & 2033
- Table 99: Rest of Middle East and Africa Thermoplastic Composites Market Revenue (billion) Forecast, by Application 2020 & 2033
- Table 100: Rest of Middle East and Africa Thermoplastic Composites Market Volume (K Tons) Forecast, by Application 2020 & 2033
Frequently Asked Questions
1. What is the projected Compound Annual Growth Rate (CAGR) of the Thermoplastic Composites Market?
The projected CAGR is approximately 8.4%.
2. Which companies are prominent players in the Thermoplastic Composites Market?
Key companies in the market include SGL Carbon, Arkema SA, Solvay, Celanese Corporation, Avient Corporation, LANXESS, BASF SE, SABIC, DSM, Daicel Corporation, Toray Industries Inc, Mitsubishi Chemical Group Corporation, Hexcel Corporation, AVANCO Group, TechnoCompound GmbH, LyondellBasell Industries Holdings BV.
3. What are the main segments of the Thermoplastic Composites Market?
The market segments include Resin Type, Fiber Type, Product Type, End-user Industry.
4. Can you provide details about the market size?
The market size is estimated to be USD 34 billion as of 2022.
5. What are some drivers contributing to market growth?
Increasing Demand from the Automotive Industry; Rising Consumption in the Construction Industry.
6. What are the notable trends driving market growth?
Automotive Industry to Dominate the Market.
7. Are there any restraints impacting market growth?
High Cost of Raw Materials and Challenges to Form Thermoplastic Composites; Other Restraints.
8. Can you provide examples of recent developments in the market?
April 2023: LANXESS announced the launch of a joint venture with Advent International focused on engineering materials, which began operations on April 1, 2023. DSM's Engineering Materials segment and LANXESS's former High-Performance Materials business joined forces to establish the new joint venture. LANXESS owns around 40% of the joint venture, while Advent International owns approximately 60%.
9. What pricing options are available for accessing the report?
Pricing options include single-user, multi-user, and enterprise licenses priced at USD 4750, USD 5250, and USD 8750 respectively.
10. Is the market size provided in terms of value or volume?
The market size is provided in terms of value, measured in billion and volume, measured in K Tons.
11. Are there any specific market keywords associated with the report?
Yes, the market keyword associated with the report is "Thermoplastic Composites Market," which aids in identifying and referencing the specific market segment covered.
12. How do I determine which pricing option suits my needs best?
The pricing options vary based on user requirements and access needs. Individual users may opt for single-user licenses, while businesses requiring broader access may choose multi-user or enterprise licenses for cost-effective access to the report.
13. Are there any additional resources or data provided in the Thermoplastic Composites Market report?
While the report offers comprehensive insights, it's advisable to review the specific contents or supplementary materials provided to ascertain if additional resources or data are available.
14. How can I stay updated on further developments or reports in the Thermoplastic Composites Market?
To stay informed about further developments, trends, and reports in the Thermoplastic Composites Market, consider subscribing to industry newsletters, following relevant companies and organizations, or regularly checking reputable industry news sources and publications.
Methodology
Step 1 - Identification of Relevant Samples Size from Population Database


Step 2 - Approaches for Defining Global Market Size (Value, Volume* & Price*)

Note*: In applicable scenarios
Step 3 - Data Sources
Primary Research
- Web Analytics
- Survey Reports
- Research Institute
- Latest Research Reports
- Opinion Leaders
Secondary Research
- Annual Reports
- White Paper
- Latest Press Release
- Industry Association
- Paid Database
- Investor Presentations

Step 4 - Data Triangulation
Involves using different sources of information in order to increase the validity of a study
These sources are likely to be stakeholders in a program - participants, other researchers, program staff, other community members, and so on.
Then we put all data in single framework & apply various statistical tools to find out the dynamic on the market.
During the analysis stage, feedback from the stakeholder groups would be compared to determine areas of agreement as well as areas of divergence