
Key Insights
The global textured fiberglass roving market is experiencing robust growth, driven by increasing demand from the construction, automotive, and wind energy sectors. The market's expansion is fueled by the material's superior properties, including high tensile strength, lightweight nature, and excellent corrosion resistance, making it a preferred choice for reinforcement in various composite applications. The rising adoption of fiberglass-reinforced polymers (FRP) in infrastructure projects, particularly in bridge construction and building facades, is significantly contributing to market growth. Furthermore, the automotive industry's push for lightweight vehicles to improve fuel efficiency is driving demand for textured fiberglass rovings in components like body panels and chassis parts. The wind energy sector also presents a significant growth opportunity, with textured fiberglass rovings being used extensively in the manufacturing of wind turbine blades. While supply chain disruptions and raw material price fluctuations pose some challenges, technological advancements aimed at enhancing the properties of textured fiberglass rovings and expanding their applications are expected to mitigate these constraints. This, coupled with the increasing focus on sustainable construction materials, positions the market for strong, sustained growth over the forecast period.
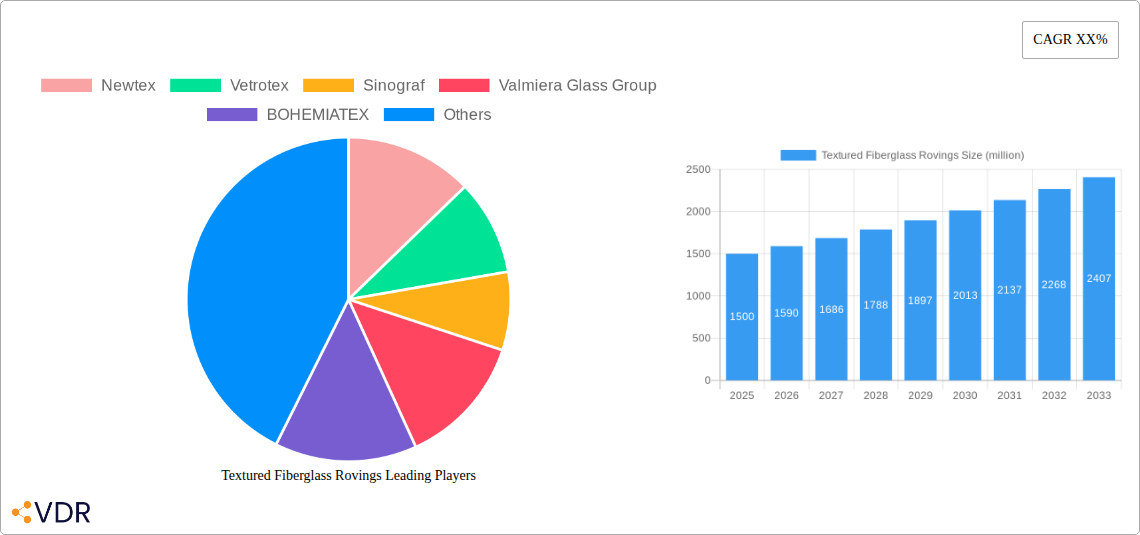
The competitive landscape is characterized by a mix of established players and emerging regional manufacturers. Key players like Newtex, Vetrotex, and Sinograf are leveraging their extensive experience and market presence to maintain their position. However, emerging companies are gaining traction by focusing on specialized applications and innovative product development. The market is witnessing geographic diversification, with regions like Asia-Pacific experiencing rapid growth due to increasing infrastructure investments and industrialization. North America and Europe also continue to be significant markets, driven by robust construction and automotive sectors. Future growth will be influenced by factors such as technological advancements leading to enhanced performance characteristics, government initiatives promoting sustainable building practices, and the continued expansion of renewable energy technologies. Strategic collaborations, mergers and acquisitions, and investments in research and development are likely to further shape the market dynamics in the coming years. We estimate the market to be valued at approximately $1.5 billion in 2025, growing at a CAGR of 6% to reach approximately $2.5 billion by 2033.
Textured Fiberglass Rovings Market Report: 2019-2033
This comprehensive report provides a detailed analysis of the global textured fiberglass rovings market, offering invaluable insights for industry professionals, investors, and strategic decision-makers. The study covers the period from 2019 to 2033, with a focus on the forecast period from 2025 to 2033, using 2025 as the base year and estimated year. The report segments the market by various applications and geographic regions, providing a granular understanding of growth drivers, challenges, and opportunities within the parent market of fiberglass reinforcements and the child market of construction and automotive composites. The market size is projected in million units.
Textured Fiberglass Rovings Market Dynamics & Structure
This section analyzes the market structure, focusing on concentration levels, technological innovation, regulatory landscapes, competitive substitutes, end-user demographics, and merger & acquisition (M&A) activities within the textured fiberglass roving industry. The report quantifies market share amongst key players and details the volume of M&A deals in the historical period.
- Market Concentration: The market exhibits a moderately concentrated structure, with the top five players holding approximately xx% of the global market share in 2025. This is expected to slightly decrease to xx% by 2033 due to the emergence of new players.
- Technological Innovation: Continuous improvements in fiber diameter control, surface treatment techniques, and resin compatibility are key drivers of innovation. However, high R&D costs pose a significant barrier to entry for smaller players.
- Regulatory Framework: Stringent environmental regulations related to the production and disposal of fiberglass materials are influencing market dynamics. Compliance costs are a factor impacting profitability.
- Competitive Substitutes: Alternative reinforcement materials such as carbon fiber and aramid fiber pose competitive pressure, particularly in high-performance applications. However, the cost-effectiveness of textured fiberglass rovings remains a key advantage.
- End-User Demographics: The construction and automotive industries are the primary end-users, with construction showing the largest market share, projected at xx million units in 2025.
- M&A Trends: The historical period (2019-2024) witnessed xx M&A deals, primarily focused on consolidating market share and expanding geographical reach. The forecast period is expected to see a similar trend, with xx deals predicted.
Textured Fiberglass Rovings Growth Trends & Insights
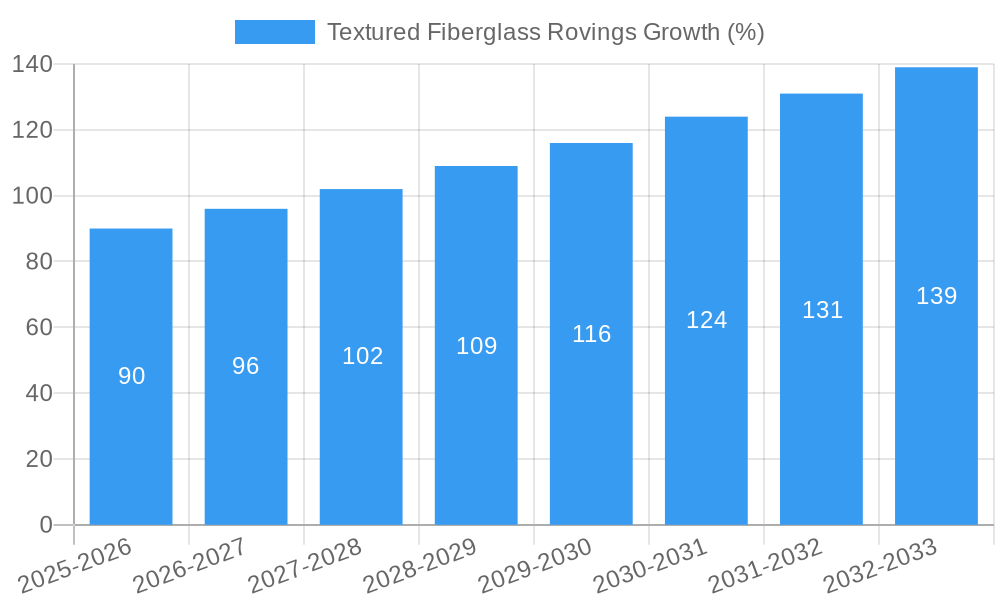
This in-depth analysis examines the evolution of market size, adoption rates, technological disruptions, and shifting consumer behavior in the textured fiberglass rovings market. Specific metrics like Compound Annual Growth Rate (CAGR) and market penetration are provided to deliver comprehensive insights. Utilizing multiple data sources, this section provides a detailed explanation of the market's trajectory, revealing factors driving expansion and potential hurdles in the path of continuous growth. The report projects a CAGR of xx% for the forecast period, driven by increasing demand from the construction and automotive industries. Market penetration is expected to reach xx% by 2033.
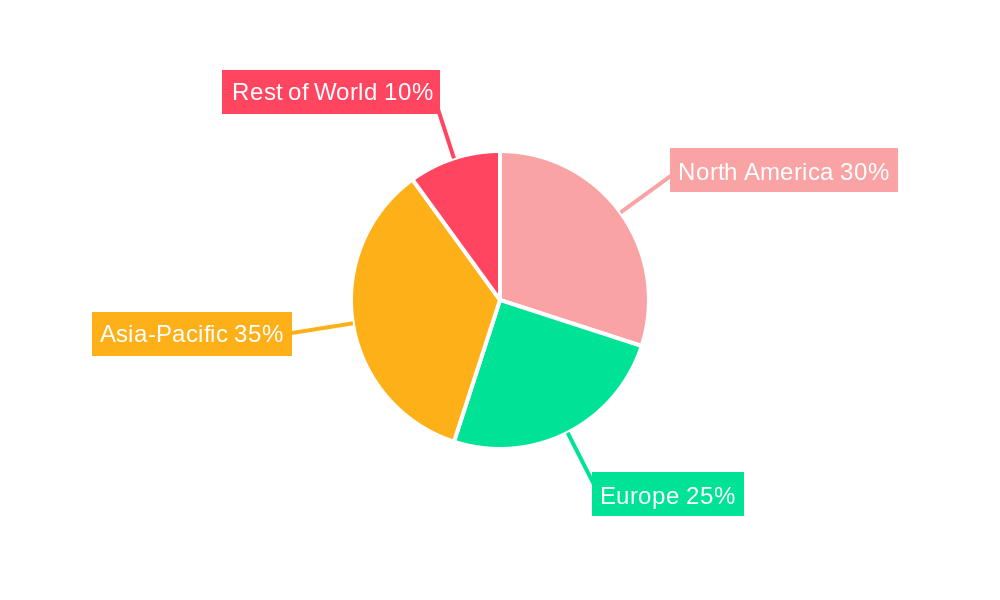
Dominant Regions, Countries, or Segments in Textured Fiberglass Rovings
This section pinpoints the leading geographical regions and segments driving market growth, providing a detailed examination of their dominance factors, market share, and future growth potential.
- North America: Strong infrastructure development and investments in the automotive sector drive substantial demand in this region, holding xx% market share in 2025. Continued focus on sustainable building materials further fuels growth.
- Asia-Pacific: This region is expected to experience the fastest growth due to rapid industrialization, urbanization, and booming automotive production, with a projected market share of xx% in 2033.
- Europe: Stringent environmental regulations and a mature market lead to moderate growth, holding a steady xx% market share.
The report further analyzes individual countries within these regions and their unique market dynamics.
Textured Fiberglass Rovings Product Landscape
Textured fiberglass rovings are characterized by their improved surface properties, resulting in enhanced bonding with resins and improved mechanical performance. Recent innovations focus on optimizing fiber diameter, surface treatment for better resin wetting, and the development of specialized rovings for specific applications, leading to improved tensile strength, flexural modulus, and impact resistance.
Key Drivers, Barriers & Challenges in Textured Fiberglass Rovings
Key Drivers: The primary drivers include the rising demand from the construction and automotive industries, the cost-effectiveness of fiberglass compared to other reinforcement materials, and continuous product innovation leading to improved performance characteristics.
Key Challenges: Supply chain disruptions, particularly in raw material sourcing (glass fibers), present a significant challenge. Fluctuating raw material prices and stringent environmental regulations also impact profitability. Intense competition from established players and the entry of new manufacturers add to the complexities.
Emerging Opportunities in Textured Fiberglass Rovings
Emerging opportunities lie in the growing demand for sustainable and lightweight materials in the construction and automotive sectors. The increasing adoption of high-performance composites in various industries like wind energy and aerospace presents further growth potential. Exploring untapped markets in developing economies also offers significant opportunities.
Growth Accelerators in the Textured Fiberglass Rovings Industry
Technological advancements leading to enhanced fiber properties, strategic partnerships to secure raw material supply chains, and expansion into new geographical markets and applications are key growth accelerators. Focus on sustainable manufacturing practices and environmentally friendly products will also play a significant role.
Key Players Shaping the Textured Fiberglass Rovings Market
- Newtex
- Vetrotex
- Sinograf
- Valmiera Glass Group
- BOHEMIATEX
- Lih Feng Jiing Enterprise Co.,Ltd.
- Ningbo Sunwell Sealing Materials Co.,Ltd.
- UTEK Composite
Notable Milestones in Textured Fiberglass Rovings Sector
- 2020: Newtex launched a new line of high-performance textured rovings optimized for wind turbine blade manufacturing.
- 2022: Vetrotex acquired a smaller competitor, expanding its market share in Europe.
- 2023: Several companies invested in improving their production processes to reduce environmental impact and enhance sustainability. (Specific details require further information.)
In-Depth Textured Fiberglass Rovings Market Outlook
The textured fiberglass rovings market exhibits strong growth potential driven by increasing demand from key industries, coupled with continuous technological advancements and strategic expansion initiatives by key players. The market is expected to remain dynamic, with ongoing innovations and strategic partnerships shaping its future trajectory. Companies focused on sustainability and efficient supply chain management are poised for significant success.
Textured Fiberglass Rovings Segmentation
-
1. Application
- 1.1. Mechanical Manufacturing
- 1.2. Textile
- 1.3. Chemical
- 1.4. Others
-
2. Types
- 2.1. E-glass
- 2.2. C-glass
Textured Fiberglass Rovings Segmentation By Geography
-
1. North America
- 1.1. United States
- 1.2. Canada
- 1.3. Mexico
-
2. South America
- 2.1. Brazil
- 2.2. Argentina
- 2.3. Rest of South America
-
3. Europe
- 3.1. United Kingdom
- 3.2. Germany
- 3.3. France
- 3.4. Italy
- 3.5. Spain
- 3.6. Russia
- 3.7. Benelux
- 3.8. Nordics
- 3.9. Rest of Europe
-
4. Middle East & Africa
- 4.1. Turkey
- 4.2. Israel
- 4.3. GCC
- 4.4. North Africa
- 4.5. South Africa
- 4.6. Rest of Middle East & Africa
-
5. Asia Pacific
- 5.1. China
- 5.2. India
- 5.3. Japan
- 5.4. South Korea
- 5.5. ASEAN
- 5.6. Oceania
- 5.7. Rest of Asia Pacific
Textured Fiberglass Rovings REPORT HIGHLIGHTS
| Aspects | Details |
|---|---|
| Study Period | 2019-2033 |
| Base Year | 2024 |
| Estimated Year | 2025 |
| Forecast Period | 2025-2033 |
| Historical Period | 2019-2024 |
| Growth Rate | CAGR of XX% from 2019-2033 |
| Segmentation |
|
Table of Contents
- 1. Introduction
- 1.1. Research Scope
- 1.2. Market Segmentation
- 1.3. Research Methodology
- 1.4. Definitions and Assumptions
- 2. Executive Summary
- 2.1. Introduction
- 3. Market Dynamics
- 3.1. Introduction
- 3.2. Market Drivers
- 3.3. Market Restrains
- 3.4. Market Trends
- 4. Market Factor Analysis
- 4.1. Porters Five Forces
- 4.2. Supply/Value Chain
- 4.3. PESTEL analysis
- 4.4. Market Entropy
- 4.5. Patent/Trademark Analysis
- 5. Global Textured Fiberglass Rovings Analysis, Insights and Forecast, 2019-2031
- 5.1. Market Analysis, Insights and Forecast - by Application
- 5.1.1. Mechanical Manufacturing
- 5.1.2. Textile
- 5.1.3. Chemical
- 5.1.4. Others
- 5.2. Market Analysis, Insights and Forecast - by Types
- 5.2.1. E-glass
- 5.2.2. C-glass
- 5.3. Market Analysis, Insights and Forecast - by Region
- 5.3.1. North America
- 5.3.2. South America
- 5.3.3. Europe
- 5.3.4. Middle East & Africa
- 5.3.5. Asia Pacific
- 5.1. Market Analysis, Insights and Forecast - by Application
- 6. North America Textured Fiberglass Rovings Analysis, Insights and Forecast, 2019-2031
- 6.1. Market Analysis, Insights and Forecast - by Application
- 6.1.1. Mechanical Manufacturing
- 6.1.2. Textile
- 6.1.3. Chemical
- 6.1.4. Others
- 6.2. Market Analysis, Insights and Forecast - by Types
- 6.2.1. E-glass
- 6.2.2. C-glass
- 6.1. Market Analysis, Insights and Forecast - by Application
- 7. South America Textured Fiberglass Rovings Analysis, Insights and Forecast, 2019-2031
- 7.1. Market Analysis, Insights and Forecast - by Application
- 7.1.1. Mechanical Manufacturing
- 7.1.2. Textile
- 7.1.3. Chemical
- 7.1.4. Others
- 7.2. Market Analysis, Insights and Forecast - by Types
- 7.2.1. E-glass
- 7.2.2. C-glass
- 7.1. Market Analysis, Insights and Forecast - by Application
- 8. Europe Textured Fiberglass Rovings Analysis, Insights and Forecast, 2019-2031
- 8.1. Market Analysis, Insights and Forecast - by Application
- 8.1.1. Mechanical Manufacturing
- 8.1.2. Textile
- 8.1.3. Chemical
- 8.1.4. Others
- 8.2. Market Analysis, Insights and Forecast - by Types
- 8.2.1. E-glass
- 8.2.2. C-glass
- 8.1. Market Analysis, Insights and Forecast - by Application
- 9. Middle East & Africa Textured Fiberglass Rovings Analysis, Insights and Forecast, 2019-2031
- 9.1. Market Analysis, Insights and Forecast - by Application
- 9.1.1. Mechanical Manufacturing
- 9.1.2. Textile
- 9.1.3. Chemical
- 9.1.4. Others
- 9.2. Market Analysis, Insights and Forecast - by Types
- 9.2.1. E-glass
- 9.2.2. C-glass
- 9.1. Market Analysis, Insights and Forecast - by Application
- 10. Asia Pacific Textured Fiberglass Rovings Analysis, Insights and Forecast, 2019-2031
- 10.1. Market Analysis, Insights and Forecast - by Application
- 10.1.1. Mechanical Manufacturing
- 10.1.2. Textile
- 10.1.3. Chemical
- 10.1.4. Others
- 10.2. Market Analysis, Insights and Forecast - by Types
- 10.2.1. E-glass
- 10.2.2. C-glass
- 10.1. Market Analysis, Insights and Forecast - by Application
- 11. Competitive Analysis
- 11.1. Global Market Share Analysis 2024
- 11.2. Company Profiles
- 11.2.1 Newtex
- 11.2.1.1. Overview
- 11.2.1.2. Products
- 11.2.1.3. SWOT Analysis
- 11.2.1.4. Recent Developments
- 11.2.1.5. Financials (Based on Availability)
- 11.2.2 Vetrotex
- 11.2.2.1. Overview
- 11.2.2.2. Products
- 11.2.2.3. SWOT Analysis
- 11.2.2.4. Recent Developments
- 11.2.2.5. Financials (Based on Availability)
- 11.2.3 Sinograf
- 11.2.3.1. Overview
- 11.2.3.2. Products
- 11.2.3.3. SWOT Analysis
- 11.2.3.4. Recent Developments
- 11.2.3.5. Financials (Based on Availability)
- 11.2.4 Valmiera Glass Group
- 11.2.4.1. Overview
- 11.2.4.2. Products
- 11.2.4.3. SWOT Analysis
- 11.2.4.4. Recent Developments
- 11.2.4.5. Financials (Based on Availability)
- 11.2.5 BOHEMIATEX
- 11.2.5.1. Overview
- 11.2.5.2. Products
- 11.2.5.3. SWOT Analysis
- 11.2.5.4. Recent Developments
- 11.2.5.5. Financials (Based on Availability)
- 11.2.6 Lih Feng Jiing Enterprise Co.
- 11.2.6.1. Overview
- 11.2.6.2. Products
- 11.2.6.3. SWOT Analysis
- 11.2.6.4. Recent Developments
- 11.2.6.5. Financials (Based on Availability)
- 11.2.7 Ltd.
- 11.2.7.1. Overview
- 11.2.7.2. Products
- 11.2.7.3. SWOT Analysis
- 11.2.7.4. Recent Developments
- 11.2.7.5. Financials (Based on Availability)
- 11.2.8 Ningbo Sunwell Sealing Materials Co.
- 11.2.8.1. Overview
- 11.2.8.2. Products
- 11.2.8.3. SWOT Analysis
- 11.2.8.4. Recent Developments
- 11.2.8.5. Financials (Based on Availability)
- 11.2.9 Ltd.
- 11.2.9.1. Overview
- 11.2.9.2. Products
- 11.2.9.3. SWOT Analysis
- 11.2.9.4. Recent Developments
- 11.2.9.5. Financials (Based on Availability)
- 11.2.10 UTEK Composite
- 11.2.10.1. Overview
- 11.2.10.2. Products
- 11.2.10.3. SWOT Analysis
- 11.2.10.4. Recent Developments
- 11.2.10.5. Financials (Based on Availability)
- 11.2.1 Newtex
List of Figures
- Figure 1: Global Textured Fiberglass Rovings Revenue Breakdown (million, %) by Region 2024 & 2032
- Figure 2: North America Textured Fiberglass Rovings Revenue (million), by Application 2024 & 2032
- Figure 3: North America Textured Fiberglass Rovings Revenue Share (%), by Application 2024 & 2032
- Figure 4: North America Textured Fiberglass Rovings Revenue (million), by Types 2024 & 2032
- Figure 5: North America Textured Fiberglass Rovings Revenue Share (%), by Types 2024 & 2032
- Figure 6: North America Textured Fiberglass Rovings Revenue (million), by Country 2024 & 2032
- Figure 7: North America Textured Fiberglass Rovings Revenue Share (%), by Country 2024 & 2032
- Figure 8: South America Textured Fiberglass Rovings Revenue (million), by Application 2024 & 2032
- Figure 9: South America Textured Fiberglass Rovings Revenue Share (%), by Application 2024 & 2032
- Figure 10: South America Textured Fiberglass Rovings Revenue (million), by Types 2024 & 2032
- Figure 11: South America Textured Fiberglass Rovings Revenue Share (%), by Types 2024 & 2032
- Figure 12: South America Textured Fiberglass Rovings Revenue (million), by Country 2024 & 2032
- Figure 13: South America Textured Fiberglass Rovings Revenue Share (%), by Country 2024 & 2032
- Figure 14: Europe Textured Fiberglass Rovings Revenue (million), by Application 2024 & 2032
- Figure 15: Europe Textured Fiberglass Rovings Revenue Share (%), by Application 2024 & 2032
- Figure 16: Europe Textured Fiberglass Rovings Revenue (million), by Types 2024 & 2032
- Figure 17: Europe Textured Fiberglass Rovings Revenue Share (%), by Types 2024 & 2032
- Figure 18: Europe Textured Fiberglass Rovings Revenue (million), by Country 2024 & 2032
- Figure 19: Europe Textured Fiberglass Rovings Revenue Share (%), by Country 2024 & 2032
- Figure 20: Middle East & Africa Textured Fiberglass Rovings Revenue (million), by Application 2024 & 2032
- Figure 21: Middle East & Africa Textured Fiberglass Rovings Revenue Share (%), by Application 2024 & 2032
- Figure 22: Middle East & Africa Textured Fiberglass Rovings Revenue (million), by Types 2024 & 2032
- Figure 23: Middle East & Africa Textured Fiberglass Rovings Revenue Share (%), by Types 2024 & 2032
- Figure 24: Middle East & Africa Textured Fiberglass Rovings Revenue (million), by Country 2024 & 2032
- Figure 25: Middle East & Africa Textured Fiberglass Rovings Revenue Share (%), by Country 2024 & 2032
- Figure 26: Asia Pacific Textured Fiberglass Rovings Revenue (million), by Application 2024 & 2032
- Figure 27: Asia Pacific Textured Fiberglass Rovings Revenue Share (%), by Application 2024 & 2032
- Figure 28: Asia Pacific Textured Fiberglass Rovings Revenue (million), by Types 2024 & 2032
- Figure 29: Asia Pacific Textured Fiberglass Rovings Revenue Share (%), by Types 2024 & 2032
- Figure 30: Asia Pacific Textured Fiberglass Rovings Revenue (million), by Country 2024 & 2032
- Figure 31: Asia Pacific Textured Fiberglass Rovings Revenue Share (%), by Country 2024 & 2032
List of Tables
- Table 1: Global Textured Fiberglass Rovings Revenue million Forecast, by Region 2019 & 2032
- Table 2: Global Textured Fiberglass Rovings Revenue million Forecast, by Application 2019 & 2032
- Table 3: Global Textured Fiberglass Rovings Revenue million Forecast, by Types 2019 & 2032
- Table 4: Global Textured Fiberglass Rovings Revenue million Forecast, by Region 2019 & 2032
- Table 5: Global Textured Fiberglass Rovings Revenue million Forecast, by Application 2019 & 2032
- Table 6: Global Textured Fiberglass Rovings Revenue million Forecast, by Types 2019 & 2032
- Table 7: Global Textured Fiberglass Rovings Revenue million Forecast, by Country 2019 & 2032
- Table 8: United States Textured Fiberglass Rovings Revenue (million) Forecast, by Application 2019 & 2032
- Table 9: Canada Textured Fiberglass Rovings Revenue (million) Forecast, by Application 2019 & 2032
- Table 10: Mexico Textured Fiberglass Rovings Revenue (million) Forecast, by Application 2019 & 2032
- Table 11: Global Textured Fiberglass Rovings Revenue million Forecast, by Application 2019 & 2032
- Table 12: Global Textured Fiberglass Rovings Revenue million Forecast, by Types 2019 & 2032
- Table 13: Global Textured Fiberglass Rovings Revenue million Forecast, by Country 2019 & 2032
- Table 14: Brazil Textured Fiberglass Rovings Revenue (million) Forecast, by Application 2019 & 2032
- Table 15: Argentina Textured Fiberglass Rovings Revenue (million) Forecast, by Application 2019 & 2032
- Table 16: Rest of South America Textured Fiberglass Rovings Revenue (million) Forecast, by Application 2019 & 2032
- Table 17: Global Textured Fiberglass Rovings Revenue million Forecast, by Application 2019 & 2032
- Table 18: Global Textured Fiberglass Rovings Revenue million Forecast, by Types 2019 & 2032
- Table 19: Global Textured Fiberglass Rovings Revenue million Forecast, by Country 2019 & 2032
- Table 20: United Kingdom Textured Fiberglass Rovings Revenue (million) Forecast, by Application 2019 & 2032
- Table 21: Germany Textured Fiberglass Rovings Revenue (million) Forecast, by Application 2019 & 2032
- Table 22: France Textured Fiberglass Rovings Revenue (million) Forecast, by Application 2019 & 2032
- Table 23: Italy Textured Fiberglass Rovings Revenue (million) Forecast, by Application 2019 & 2032
- Table 24: Spain Textured Fiberglass Rovings Revenue (million) Forecast, by Application 2019 & 2032
- Table 25: Russia Textured Fiberglass Rovings Revenue (million) Forecast, by Application 2019 & 2032
- Table 26: Benelux Textured Fiberglass Rovings Revenue (million) Forecast, by Application 2019 & 2032
- Table 27: Nordics Textured Fiberglass Rovings Revenue (million) Forecast, by Application 2019 & 2032
- Table 28: Rest of Europe Textured Fiberglass Rovings Revenue (million) Forecast, by Application 2019 & 2032
- Table 29: Global Textured Fiberglass Rovings Revenue million Forecast, by Application 2019 & 2032
- Table 30: Global Textured Fiberglass Rovings Revenue million Forecast, by Types 2019 & 2032
- Table 31: Global Textured Fiberglass Rovings Revenue million Forecast, by Country 2019 & 2032
- Table 32: Turkey Textured Fiberglass Rovings Revenue (million) Forecast, by Application 2019 & 2032
- Table 33: Israel Textured Fiberglass Rovings Revenue (million) Forecast, by Application 2019 & 2032
- Table 34: GCC Textured Fiberglass Rovings Revenue (million) Forecast, by Application 2019 & 2032
- Table 35: North Africa Textured Fiberglass Rovings Revenue (million) Forecast, by Application 2019 & 2032
- Table 36: South Africa Textured Fiberglass Rovings Revenue (million) Forecast, by Application 2019 & 2032
- Table 37: Rest of Middle East & Africa Textured Fiberglass Rovings Revenue (million) Forecast, by Application 2019 & 2032
- Table 38: Global Textured Fiberglass Rovings Revenue million Forecast, by Application 2019 & 2032
- Table 39: Global Textured Fiberglass Rovings Revenue million Forecast, by Types 2019 & 2032
- Table 40: Global Textured Fiberglass Rovings Revenue million Forecast, by Country 2019 & 2032
- Table 41: China Textured Fiberglass Rovings Revenue (million) Forecast, by Application 2019 & 2032
- Table 42: India Textured Fiberglass Rovings Revenue (million) Forecast, by Application 2019 & 2032
- Table 43: Japan Textured Fiberglass Rovings Revenue (million) Forecast, by Application 2019 & 2032
- Table 44: South Korea Textured Fiberglass Rovings Revenue (million) Forecast, by Application 2019 & 2032
- Table 45: ASEAN Textured Fiberglass Rovings Revenue (million) Forecast, by Application 2019 & 2032
- Table 46: Oceania Textured Fiberglass Rovings Revenue (million) Forecast, by Application 2019 & 2032
- Table 47: Rest of Asia Pacific Textured Fiberglass Rovings Revenue (million) Forecast, by Application 2019 & 2032
Frequently Asked Questions
1. What is the projected Compound Annual Growth Rate (CAGR) of the Textured Fiberglass Rovings?
The projected CAGR is approximately XX%.
2. Which companies are prominent players in the Textured Fiberglass Rovings?
Key companies in the market include Newtex, Vetrotex, Sinograf, Valmiera Glass Group, BOHEMIATEX, Lih Feng Jiing Enterprise Co., Ltd., Ningbo Sunwell Sealing Materials Co., Ltd., UTEK Composite.
3. What are the main segments of the Textured Fiberglass Rovings?
The market segments include Application, Types.
4. Can you provide details about the market size?
The market size is estimated to be USD XXX million as of 2022.
5. What are some drivers contributing to market growth?
N/A
6. What are the notable trends driving market growth?
N/A
7. Are there any restraints impacting market growth?
N/A
8. Can you provide examples of recent developments in the market?
N/A
9. What pricing options are available for accessing the report?
Pricing options include single-user, multi-user, and enterprise licenses priced at USD 4900.00, USD 7350.00, and USD 9800.00 respectively.
10. Is the market size provided in terms of value or volume?
The market size is provided in terms of value, measured in million.
11. Are there any specific market keywords associated with the report?
Yes, the market keyword associated with the report is "Textured Fiberglass Rovings," which aids in identifying and referencing the specific market segment covered.
12. How do I determine which pricing option suits my needs best?
The pricing options vary based on user requirements and access needs. Individual users may opt for single-user licenses, while businesses requiring broader access may choose multi-user or enterprise licenses for cost-effective access to the report.
13. Are there any additional resources or data provided in the Textured Fiberglass Rovings report?
While the report offers comprehensive insights, it's advisable to review the specific contents or supplementary materials provided to ascertain if additional resources or data are available.
14. How can I stay updated on further developments or reports in the Textured Fiberglass Rovings?
To stay informed about further developments, trends, and reports in the Textured Fiberglass Rovings, consider subscribing to industry newsletters, following relevant companies and organizations, or regularly checking reputable industry news sources and publications.
Methodology
Step 1 - Identification of Relevant Samples Size from Population Database


Step 2 - Approaches for Defining Global Market Size (Value, Volume* & Price*)

Note*: In applicable scenarios
Step 3 - Data Sources
Primary Research
- Web Analytics
- Survey Reports
- Research Institute
- Latest Research Reports
- Opinion Leaders
Secondary Research
- Annual Reports
- White Paper
- Latest Press Release
- Industry Association
- Paid Database
- Investor Presentations

Step 4 - Data Triangulation
Involves using different sources of information in order to increase the validity of a study
These sources are likely to be stakeholders in a program - participants, other researchers, program staff, other community members, and so on.
Then we put all data in single framework & apply various statistical tools to find out the dynamic on the market.
During the analysis stage, feedback from the stakeholder groups would be compared to determine areas of agreement as well as areas of divergence


