

Key Insights
The global tempered glass market, estimated at $5.95 billion in 2025, is projected for significant expansion with a Compound Annual Growth Rate (CAGR) of 11.51% from 2025 to 2033. Key growth drivers include escalating demand for enhanced safety features in the automotive sector, such as reinforced windshields and side windows. The construction industry's increasing adoption of tempered glass for improved energy efficiency and modern architectural designs also fuels market growth. Furthermore, the electronics industry's reliance on durable, scratch-resistant glass for devices like smartphones and tablets contributes substantially to market demand. Emerging trends, including the proliferation of smart buildings and a preference for larger display sizes in consumer electronics, are expected to positively influence market trajectory. Challenges such as volatile raw material prices and potential supply chain disruptions are present but are outweighed by consistent demand across diverse end-user industries, indicating a strong market outlook. The Asia-Pacific region, particularly China and India, is anticipated to lead market growth due to rapid urbanization and infrastructure development. North America and Europe remain significant markets, driven by established automotive and construction sectors.
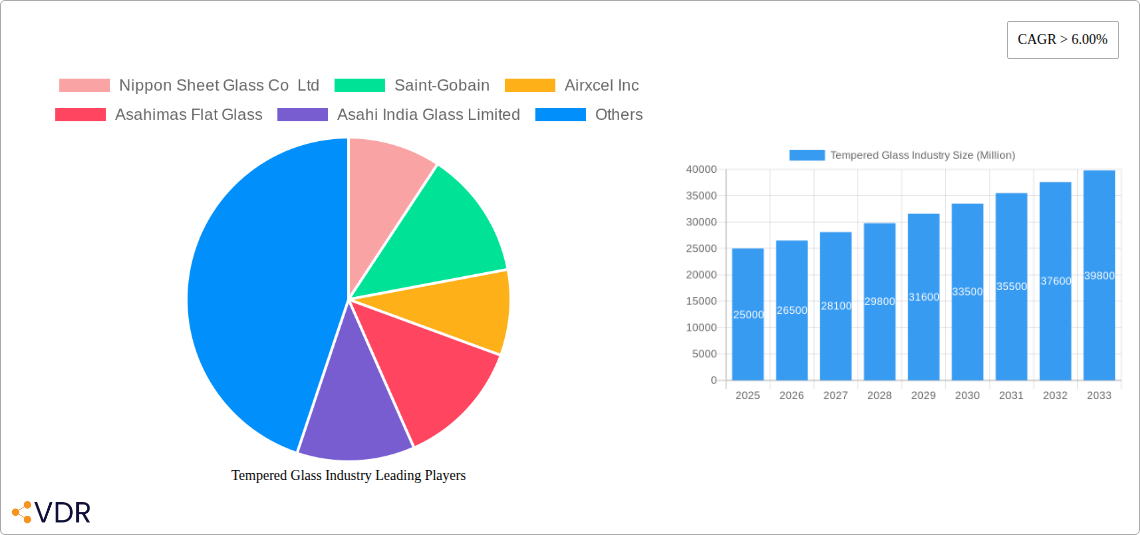
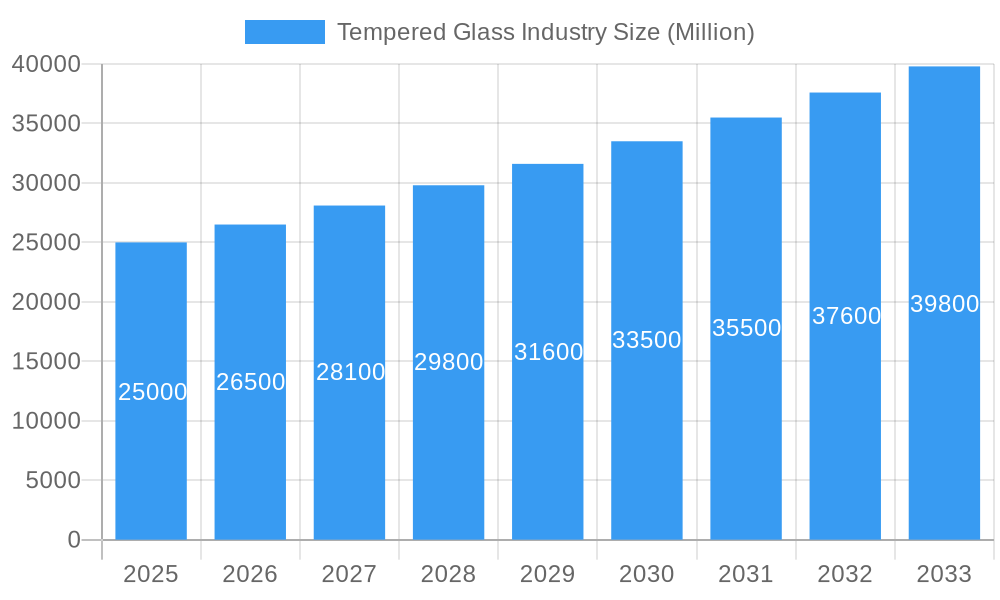
Tempered Glass Industry Market Size (In Billion)
The competitive environment features a blend of prominent global manufacturers and agile regional players. Leading companies like Nippon Sheet Glass, Saint-Gobain, and AGC Inc. maintain market leadership through extensive manufacturing expertise and robust distribution channels. Regional manufacturers are also contributing to market expansion by catering to localized demands and offering competitive pricing strategies. Future market dynamics will be shaped by technological advancements focused on enhancing glass strength, energy efficiency, and self-cleaning capabilities. Innovations in manufacturing processes to reduce costs and boost production efficiency will be critical. A growing emphasis on sustainable production methods and eco-friendly glass solutions is increasingly influencing consumer preferences and regulatory frameworks. This comprehensive analysis of market drivers, restraints, and innovative advancements underscores the tempered glass market's robust and sustained growth potential.
Tempered Glass Industry Company Market Share
Tempered Glass Industry Market Report: 2019-2033
This comprehensive report provides an in-depth analysis of the global tempered glass industry, encompassing market dynamics, growth trends, key players, and future outlook. The study period covers 2019-2033, with 2025 as the base and estimated year. The report leverages extensive primary and secondary research to offer actionable insights for industry professionals, investors, and strategic decision-makers. The market is segmented by end-user industry (Automotive, Construction, Electronics, Other End-user Industries) providing granular analysis for each segment. The report projects a market size of xx Million units by 2033, driven by key factors detailed within.
Tempered Glass Industry Market Dynamics & Structure
The tempered glass market is characterized by a moderately concentrated landscape, with key players such as Nippon Sheet Glass Co Ltd, Saint-Gobain, and AGC Inc holding significant market share. Market concentration is estimated at xx% in 2025. Technological innovation, particularly in areas like digital twin technology (as exemplified by AGC's COCOA) and improved energy-efficient manufacturing processes, are major growth drivers. Stringent safety regulations across various end-use sectors, especially automotive and construction, influence market dynamics. Competitive pressures from alternative materials, like plastics and composites, present a notable challenge. Mergers and acquisitions (M&A) activity is relatively moderate; however, strategic partnerships are increasingly common to expand market reach and technological capabilities. The estimated number of M&A deals in the period 2019-2024 was xx.
- Market Concentration: xx% in 2025 (estimated)
- Key Innovation Drivers: Digital twin technology, energy-efficient manufacturing.
- Regulatory Landscape: Stringent safety standards impacting design and manufacturing.
- Competitive Substitutes: Plastics, composites.
- M&A Activity: Moderate, with xx deals between 2019-2024 (estimated).
- Innovation Barriers: High capital investment requirements for new technologies.
Tempered Glass Industry Growth Trends & Insights
The global tempered glass market experienced significant growth between 2019 and 2024, with a CAGR of xx%. This growth is primarily attributed to rising demand across various end-use sectors, particularly the automotive and construction industries. Increased adoption of energy-efficient buildings and advancements in automotive safety features have fueled market expansion. Technological disruptions, such as the development of self-cleaning and electronically tintable glass, are driving further innovation and influencing consumer preferences. The market is expected to continue its growth trajectory during the forecast period (2025-2033), with a projected CAGR of xx%, reaching xx Million units by 2033. Market penetration in key sectors is projected to increase significantly, driven by factors like increasing disposable income and growing urbanization.
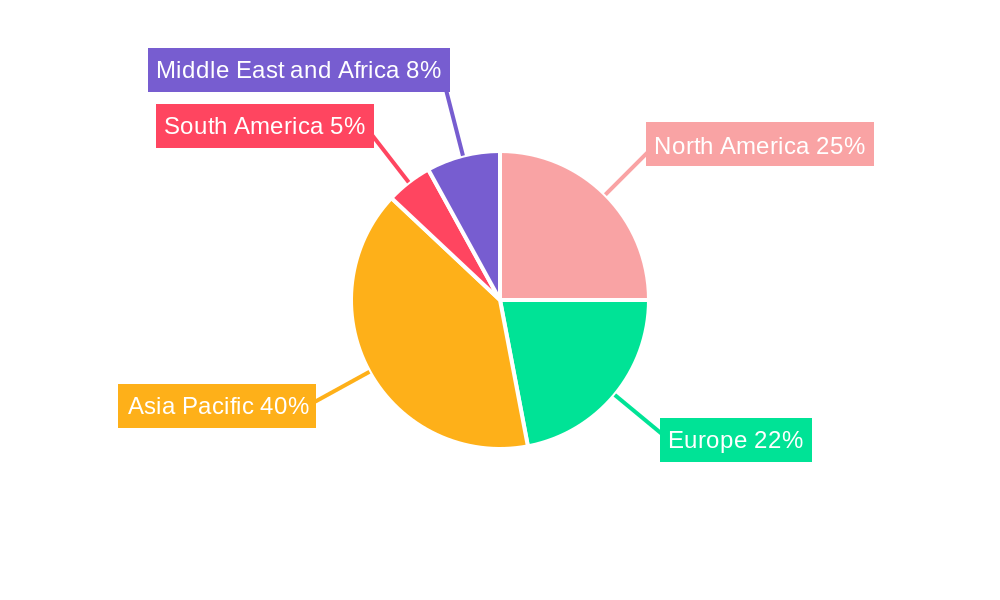
Dominant Regions, Countries, or Segments in Tempered Glass Industry
The Automotive segment is the dominant end-user industry, accounting for xx% of the market in 2025. North America and Asia-Pacific are currently the leading regions, driven by robust automotive and construction sectors. China, in particular, stands out due to its massive infrastructure development initiatives and burgeoning automotive industry. Europe also holds significant market share owing to stringent building codes and high adoption of energy-efficient technologies.
- Key Regional Drivers:
- North America: Strong automotive and construction sectors, focus on energy efficiency.
- Asia-Pacific (particularly China): Massive infrastructure projects, rapid urbanization, automotive growth.
- Europe: Stringent building regulations, adoption of energy-efficient glass.
- Segment Dominance: Automotive (xx% market share in 2025), driven by safety regulations and rising vehicle production.
Tempered Glass Industry Product Landscape
The tempered glass market offers a diverse range of products, including laminated, coated, and digitally printed glass, catering to various applications. Key performance metrics focus on strength, impact resistance, thermal stability, and light transmission. Recent innovations include self-cleaning glass, electronically tintable glass, and curved glass designs. These advancements enhance both aesthetic appeal and functional performance, driving adoption in diverse architectural and automotive designs.
Key Drivers, Barriers & Challenges in Tempered Glass Industry
Key Drivers:
- Increasing demand from the automotive and construction sectors.
- Technological advancements in glass manufacturing and coatings.
- Growing adoption of energy-efficient buildings.
- Stringent safety regulations in several countries.
Key Challenges and Restraints:
- Fluctuations in raw material prices (e.g., silica sand).
- High energy consumption in manufacturing.
- Intense competition from alternative materials.
- Potential supply chain disruptions.
Emerging Opportunities in Tempered Glass Industry
Emerging opportunities include the growing demand for energy-efficient and smart glass solutions in the building sector. The integration of tempered glass with advanced technologies, such as solar panels and sensors, will open up significant avenues for growth. The use of tempered glass in innovative architectural designs, such as curved facades and skylights, is expected to further drive demand. Exploring new applications in areas like electronics and medical devices also presents substantial potential.
Growth Accelerators in the Tempered Glass Industry
Technological breakthroughs in areas like digital twin technology for optimized production, and the development of novel glass coatings with enhanced properties (e.g., self-cleaning, anti-reflective) are driving significant growth. Strategic partnerships and collaborations across the value chain, from raw material suppliers to end-users, are further accelerating market expansion. Moreover, expansion into new geographical markets, especially in developing economies with burgeoning infrastructure and automotive industries, will continue to be a primary driver of market growth.
Key Players Shaping the Tempered Glass Industry Market
- Nippon Sheet Glass Co Ltd
- Saint-Gobain
- Airxcel Inc
- Asahimas Flat Glass
- Asahi India Glass Limited
- TOMAKK GLASS PARTNERS LLC
- GUARDIAN GLASS LLC
- GSC GLASS LTD
- KIBING GROUP
- AGC Inc
- CARDINAL GLASS INDUSTRIES INC
- Abrisa Technologies
- SCHOTT AG
Notable Milestones in Tempered Glass Industry Sector
- December 2022: Guardian Glass launched the Guardian Glass Resource Hub, providing 24/7 access to technical information and training, enhancing product support and potentially increasing market share.
- January 2023: AGC Inc. developed digital twin technology (COCOA) for glass melting, improving efficiency and reducing production costs, leading to a more competitive market position.
In-Depth Tempered Glass Industry Market Outlook
The tempered glass market is poised for continued robust growth driven by ongoing technological advancements, expanding applications across diverse sectors, and increasing investments in infrastructure development globally. Strategic partnerships and investments in energy-efficient manufacturing processes will further solidify market leadership for key players and pave the way for novel applications and growth opportunities. The potential for increased market penetration in emerging economies presents significant future potential.
Tempered Glass Industry Segmentation
-
1. End-user Industry
- 1.1. Automotive
- 1.2. Construction
- 1.3. Electronics
- 1.4. Other End-user Industries
Tempered Glass Industry Segmentation By Geography
-
1. Asia Pacific
- 1.1. China
- 1.2. India
- 1.3. Japan
- 1.4. South Korea
- 1.5. Rest of Asia Pacific
-
2. North America
- 2.1. United States
- 2.2. Canada
- 2.3. Mexico
-
3. Europe
- 3.1. Germany
- 3.2. United Kingdom
- 3.3. France
- 3.4. Italy
- 3.5. Rest of Europe
-
4. South America
- 4.1. Brazil
- 4.2. Argentina
- 4.3. Rest of South America
-
5. Middle East and Africa
- 5.1. Saudi Arabia
- 5.2. South Africa
- 5.3. Rest of Middle East and Africa
Tempered Glass Industry Regional Market Share
Geographic Coverage of Tempered Glass Industry
Tempered Glass Industry REPORT HIGHLIGHTS
| Aspects | Details |
|---|---|
| Study Period | 2020-2034 |
| Base Year | 2025 |
| Estimated Year | 2026 |
| Forecast Period | 2026-2034 |
| Historical Period | 2020-2025 |
| Growth Rate | CAGR of 11.51% from 2020-2034 |
| Segmentation |
|
Table of Contents
- 1. Introduction
- 1.1. Research Scope
- 1.2. Market Segmentation
- 1.3. Research Objective
- 1.4. Definitions and Assumptions
- 2. Executive Summary
- 2.1. Market Snapshot
- 3. Market Dynamics
- 3.1. Market Drivers
- 3.2. Market Restrains
- 3.3. Market Trends
- 3.4. Market Opportunities
- 4. Market Factor Analysis
- 4.1. Porters Five Forces
- 4.1.1. Bargaining Power of Suppliers
- 4.1.2. Bargaining Power of Buyers
- 4.1.3. Threat of New Entrants
- 4.1.4. Threat of Substitutes
- 4.1.5. Competitive Rivalry
- 4.2. PESTEL analysis
- 4.3. BCG Analysis
- 4.3.1. Stars (High Growth, High Market Share)
- 4.3.2. Cash Cows (Low Growth, High Market Share)
- 4.3.3. Question Mark (High Growth, Low Market Share)
- 4.3.4. Dogs (Low Growth, Low Market Share)
- 4.4. Ansoff Matrix Analysis
- 4.5. Supply Chain Analysis
- 4.6. Regulatory Landscape
- 4.7. Current Market Potential and Opportunity Assessment (TAM–SAM–SOM Framework)
- 4.8. VDR Analyst Note
- 4.1. Porters Five Forces
- 5. Market Analysis, Insights and Forecast 2021-2033
- 5.1. Market Analysis, Insights and Forecast - by End-user Industry
- 5.1.1. Automotive
- 5.1.2. Construction
- 5.1.3. Electronics
- 5.1.4. Other End-user Industries
- 5.2. Market Analysis, Insights and Forecast - by Region
- 5.2.1. Asia Pacific
- 5.2.2. North America
- 5.2.3. Europe
- 5.2.4. South America
- 5.2.5. Middle East and Africa
- 5.1. Market Analysis, Insights and Forecast - by End-user Industry
- 6. Global Tempered Glass Industry Analysis, Insights and Forecast, 2021-2033
- 6.1. Market Analysis, Insights and Forecast - by End-user Industry
- 6.1.1. Automotive
- 6.1.2. Construction
- 6.1.3. Electronics
- 6.1.4. Other End-user Industries
- 6.1. Market Analysis, Insights and Forecast - by End-user Industry
- 7. Asia Pacific Tempered Glass Industry Analysis, Insights and Forecast, 2021-2033
- 7.1. Market Analysis, Insights and Forecast - by End-user Industry
- 7.1.1. Automotive
- 7.1.2. Construction
- 7.1.3. Electronics
- 7.1.4. Other End-user Industries
- 7.1. Market Analysis, Insights and Forecast - by End-user Industry
- 8. North America Tempered Glass Industry Analysis, Insights and Forecast, 2021-2033
- 8.1. Market Analysis, Insights and Forecast - by End-user Industry
- 8.1.1. Automotive
- 8.1.2. Construction
- 8.1.3. Electronics
- 8.1.4. Other End-user Industries
- 8.1. Market Analysis, Insights and Forecast - by End-user Industry
- 9. Europe Tempered Glass Industry Analysis, Insights and Forecast, 2021-2033
- 9.1. Market Analysis, Insights and Forecast - by End-user Industry
- 9.1.1. Automotive
- 9.1.2. Construction
- 9.1.3. Electronics
- 9.1.4. Other End-user Industries
- 9.1. Market Analysis, Insights and Forecast - by End-user Industry
- 10. South America Tempered Glass Industry Analysis, Insights and Forecast, 2021-2033
- 10.1. Market Analysis, Insights and Forecast - by End-user Industry
- 10.1.1. Automotive
- 10.1.2. Construction
- 10.1.3. Electronics
- 10.1.4. Other End-user Industries
- 10.1. Market Analysis, Insights and Forecast - by End-user Industry
- 11. Middle East and Africa Tempered Glass Industry Analysis, Insights and Forecast, 2021-2033
- 11.1. Market Analysis, Insights and Forecast - by End-user Industry
- 11.1.1. Automotive
- 11.1.2. Construction
- 11.1.3. Electronics
- 11.1.4. Other End-user Industries
- 11.1. Market Analysis, Insights and Forecast - by End-user Industry
- 12. Competitive Analysis
- 12.1. Company Profiles
- 12.1.1 Nippon Sheet Glass Co Ltd
- 12.1.1.1. Company Overview
- 12.1.1.2. Products
- 12.1.1.3. Company Financials
- 12.1.1.4. SWOT Analysis
- 12.1.2 Saint-Gobain
- 12.1.2.1. Company Overview
- 12.1.2.2. Products
- 12.1.2.3. Company Financials
- 12.1.2.4. SWOT Analysis
- 12.1.3 Airxcel Inc
- 12.1.3.1. Company Overview
- 12.1.3.2. Products
- 12.1.3.3. Company Financials
- 12.1.3.4. SWOT Analysis
- 12.1.4 Asahimas Flat Glass
- 12.1.4.1. Company Overview
- 12.1.4.2. Products
- 12.1.4.3. Company Financials
- 12.1.4.4. SWOT Analysis
- 12.1.5 Asahi India Glass Limited
- 12.1.5.1. Company Overview
- 12.1.5.2. Products
- 12.1.5.3. Company Financials
- 12.1.5.4. SWOT Analysis
- 12.1.6 TOMAKK GLASS PARTNERS LLC*List Not Exhaustive
- 12.1.6.1. Company Overview
- 12.1.6.2. Products
- 12.1.6.3. Company Financials
- 12.1.6.4. SWOT Analysis
- 12.1.7 GUARDIAN GLASS LLC
- 12.1.7.1. Company Overview
- 12.1.7.2. Products
- 12.1.7.3. Company Financials
- 12.1.7.4. SWOT Analysis
- 12.1.8 GSC GLASS LTD
- 12.1.8.1. Company Overview
- 12.1.8.2. Products
- 12.1.8.3. Company Financials
- 12.1.8.4. SWOT Analysis
- 12.1.9 KIBING GROUP
- 12.1.9.1. Company Overview
- 12.1.9.2. Products
- 12.1.9.3. Company Financials
- 12.1.9.4. SWOT Analysis
- 12.1.10 AGC Inc
- 12.1.10.1. Company Overview
- 12.1.10.2. Products
- 12.1.10.3. Company Financials
- 12.1.10.4. SWOT Analysis
- 12.1.11 CARDINAL GLASS INDUSTRIES INC
- 12.1.11.1. Company Overview
- 12.1.11.2. Products
- 12.1.11.3. Company Financials
- 12.1.11.4. SWOT Analysis
- 12.1.12 Abrisa Technologies
- 12.1.12.1. Company Overview
- 12.1.12.2. Products
- 12.1.12.3. Company Financials
- 12.1.12.4. SWOT Analysis
- 12.1.13 SCHOTT AG
- 12.1.13.1. Company Overview
- 12.1.13.2. Products
- 12.1.13.3. Company Financials
- 12.1.13.4. SWOT Analysis
- 12.1.1 Nippon Sheet Glass Co Ltd
- 12.2. Market Entropy
- 12.2.1 Company's Key Areas Served
- 12.2.2 Recent Developments
- 12.3. Company Market Share Analysis 2025
- 12.3.1 Top 5 Companies Market Share Analysis
- 12.3.2 Top 3 Companies Market Share Analysis
- 12.4. List of Potential Customers
- 13. Research Methodology
List of Figures
- Figure 1: Global Tempered Glass Industry Revenue Breakdown (billion, %) by Region 2025 & 2033
- Figure 2: Asia Pacific Tempered Glass Industry Revenue (billion), by End-user Industry 2025 & 2033
- Figure 3: Asia Pacific Tempered Glass Industry Revenue Share (%), by End-user Industry 2025 & 2033
- Figure 4: Asia Pacific Tempered Glass Industry Revenue (billion), by Country 2025 & 2033
- Figure 5: Asia Pacific Tempered Glass Industry Revenue Share (%), by Country 2025 & 2033
- Figure 6: North America Tempered Glass Industry Revenue (billion), by End-user Industry 2025 & 2033
- Figure 7: North America Tempered Glass Industry Revenue Share (%), by End-user Industry 2025 & 2033
- Figure 8: North America Tempered Glass Industry Revenue (billion), by Country 2025 & 2033
- Figure 9: North America Tempered Glass Industry Revenue Share (%), by Country 2025 & 2033
- Figure 10: Europe Tempered Glass Industry Revenue (billion), by End-user Industry 2025 & 2033
- Figure 11: Europe Tempered Glass Industry Revenue Share (%), by End-user Industry 2025 & 2033
- Figure 12: Europe Tempered Glass Industry Revenue (billion), by Country 2025 & 2033
- Figure 13: Europe Tempered Glass Industry Revenue Share (%), by Country 2025 & 2033
- Figure 14: South America Tempered Glass Industry Revenue (billion), by End-user Industry 2025 & 2033
- Figure 15: South America Tempered Glass Industry Revenue Share (%), by End-user Industry 2025 & 2033
- Figure 16: South America Tempered Glass Industry Revenue (billion), by Country 2025 & 2033
- Figure 17: South America Tempered Glass Industry Revenue Share (%), by Country 2025 & 2033
- Figure 18: Middle East and Africa Tempered Glass Industry Revenue (billion), by End-user Industry 2025 & 2033
- Figure 19: Middle East and Africa Tempered Glass Industry Revenue Share (%), by End-user Industry 2025 & 2033
- Figure 20: Middle East and Africa Tempered Glass Industry Revenue (billion), by Country 2025 & 2033
- Figure 21: Middle East and Africa Tempered Glass Industry Revenue Share (%), by Country 2025 & 2033
List of Tables
- Table 1: Global Tempered Glass Industry Revenue billion Forecast, by End-user Industry 2020 & 2033
- Table 2: Global Tempered Glass Industry Revenue billion Forecast, by Region 2020 & 2033
- Table 3: Global Tempered Glass Industry Revenue billion Forecast, by End-user Industry 2020 & 2033
- Table 4: Global Tempered Glass Industry Revenue billion Forecast, by Country 2020 & 2033
- Table 5: China Tempered Glass Industry Revenue (billion) Forecast, by Application 2020 & 2033
- Table 6: India Tempered Glass Industry Revenue (billion) Forecast, by Application 2020 & 2033
- Table 7: Japan Tempered Glass Industry Revenue (billion) Forecast, by Application 2020 & 2033
- Table 8: South Korea Tempered Glass Industry Revenue (billion) Forecast, by Application 2020 & 2033
- Table 9: Rest of Asia Pacific Tempered Glass Industry Revenue (billion) Forecast, by Application 2020 & 2033
- Table 10: Global Tempered Glass Industry Revenue billion Forecast, by End-user Industry 2020 & 2033
- Table 11: Global Tempered Glass Industry Revenue billion Forecast, by Country 2020 & 2033
- Table 12: United States Tempered Glass Industry Revenue (billion) Forecast, by Application 2020 & 2033
- Table 13: Canada Tempered Glass Industry Revenue (billion) Forecast, by Application 2020 & 2033
- Table 14: Mexico Tempered Glass Industry Revenue (billion) Forecast, by Application 2020 & 2033
- Table 15: Global Tempered Glass Industry Revenue billion Forecast, by End-user Industry 2020 & 2033
- Table 16: Global Tempered Glass Industry Revenue billion Forecast, by Country 2020 & 2033
- Table 17: Germany Tempered Glass Industry Revenue (billion) Forecast, by Application 2020 & 2033
- Table 18: United Kingdom Tempered Glass Industry Revenue (billion) Forecast, by Application 2020 & 2033
- Table 19: France Tempered Glass Industry Revenue (billion) Forecast, by Application 2020 & 2033
- Table 20: Italy Tempered Glass Industry Revenue (billion) Forecast, by Application 2020 & 2033
- Table 21: Rest of Europe Tempered Glass Industry Revenue (billion) Forecast, by Application 2020 & 2033
- Table 22: Global Tempered Glass Industry Revenue billion Forecast, by End-user Industry 2020 & 2033
- Table 23: Global Tempered Glass Industry Revenue billion Forecast, by Country 2020 & 2033
- Table 24: Brazil Tempered Glass Industry Revenue (billion) Forecast, by Application 2020 & 2033
- Table 25: Argentina Tempered Glass Industry Revenue (billion) Forecast, by Application 2020 & 2033
- Table 26: Rest of South America Tempered Glass Industry Revenue (billion) Forecast, by Application 2020 & 2033
- Table 27: Global Tempered Glass Industry Revenue billion Forecast, by End-user Industry 2020 & 2033
- Table 28: Global Tempered Glass Industry Revenue billion Forecast, by Country 2020 & 2033
- Table 29: Saudi Arabia Tempered Glass Industry Revenue (billion) Forecast, by Application 2020 & 2033
- Table 30: South Africa Tempered Glass Industry Revenue (billion) Forecast, by Application 2020 & 2033
- Table 31: Rest of Middle East and Africa Tempered Glass Industry Revenue (billion) Forecast, by Application 2020 & 2033
Frequently Asked Questions
1. What is the projected Compound Annual Growth Rate (CAGR) of the Tempered Glass Industry?
The projected CAGR is approximately 11.51%.
2. Which companies are prominent players in the Tempered Glass Industry?
Key companies in the market include Nippon Sheet Glass Co Ltd, Saint-Gobain, Airxcel Inc, Asahimas Flat Glass, Asahi India Glass Limited, TOMAKK GLASS PARTNERS LLC*List Not Exhaustive, GUARDIAN GLASS LLC, GSC GLASS LTD, KIBING GROUP, AGC Inc, CARDINAL GLASS INDUSTRIES INC, Abrisa Technologies, SCHOTT AG.
3. What are the main segments of the Tempered Glass Industry?
The market segments include End-user Industry.
4. Can you provide details about the market size?
The market size is estimated to be USD 5.95 billion as of 2022.
5. What are some drivers contributing to market growth?
Growing Demand from the Construction Industry; Other Drivers.
6. What are the notable trends driving market growth?
Growing Demand from the Construction Industry.
7. Are there any restraints impacting market growth?
Increasing Use of Other Light Weight Products; Other Restraints.
8. Can you provide examples of recent developments in the market?
January 2023: AGC develops digital twin technology (CADTANK Online Computation and Optimization Assistant (COCOA)) for the glass melting process and starts flotation furnace operational verification. This technology makes it easy to get a quick and detailed understanding of how glass is melted and a first look at the manufacturing conditions.
9. What pricing options are available for accessing the report?
Pricing options include single-user, multi-user, and enterprise licenses priced at USD 4750, USD 5250, and USD 8750 respectively.
10. Is the market size provided in terms of value or volume?
The market size is provided in terms of value, measured in billion.
11. Are there any specific market keywords associated with the report?
Yes, the market keyword associated with the report is "Tempered Glass Industry," which aids in identifying and referencing the specific market segment covered.
12. How do I determine which pricing option suits my needs best?
The pricing options vary based on user requirements and access needs. Individual users may opt for single-user licenses, while businesses requiring broader access may choose multi-user or enterprise licenses for cost-effective access to the report.
13. Are there any additional resources or data provided in the Tempered Glass Industry report?
While the report offers comprehensive insights, it's advisable to review the specific contents or supplementary materials provided to ascertain if additional resources or data are available.
14. How can I stay updated on further developments or reports in the Tempered Glass Industry?
To stay informed about further developments, trends, and reports in the Tempered Glass Industry, consider subscribing to industry newsletters, following relevant companies and organizations, or regularly checking reputable industry news sources and publications.
Methodology
Step 1 - Identification of Relevant Samples Size from Population Database


Step 2 - Approaches for Defining Global Market Size (Value, Volume* & Price*)

Note*: In applicable scenarios
Step 3 - Data Sources
Primary Research
- Web Analytics
- Survey Reports
- Research Institute
- Latest Research Reports
- Opinion Leaders
Secondary Research
- Annual Reports
- White Paper
- Latest Press Release
- Industry Association
- Paid Database
- Investor Presentations

Step 4 - Data Triangulation
Involves using different sources of information in order to increase the validity of a study
These sources are likely to be stakeholders in a program - participants, other researchers, program staff, other community members, and so on.
Then we put all data in single framework & apply various statistical tools to find out the dynamic on the market.
During the analysis stage, feedback from the stakeholder groups would be compared to determine areas of agreement as well as areas of divergence