
Key Insights
The global switchyard maintenance market is experiencing robust growth, driven by the increasing demand for reliable and efficient power transmission and distribution infrastructure. The aging power grid in many regions necessitates significant investments in maintenance and upgrades to prevent outages and ensure grid stability. Furthermore, the integration of renewable energy sources, such as solar and wind power, adds complexity to existing switchyards, requiring specialized maintenance expertise and advanced technologies. This expanding market is segmented by service type (preventive, corrective, and predictive maintenance), technology (insulation testing, relay testing, and others), and end-user (utilities, independent power producers, and industrial users). The competitive landscape is characterized by a mix of large multinational corporations and specialized service providers, each vying for market share with unique strengths in technology and service offerings. The market's growth trajectory is expected to remain positive throughout the forecast period (2025-2033), fueled by continued investments in grid modernization and the global transition towards cleaner energy sources.
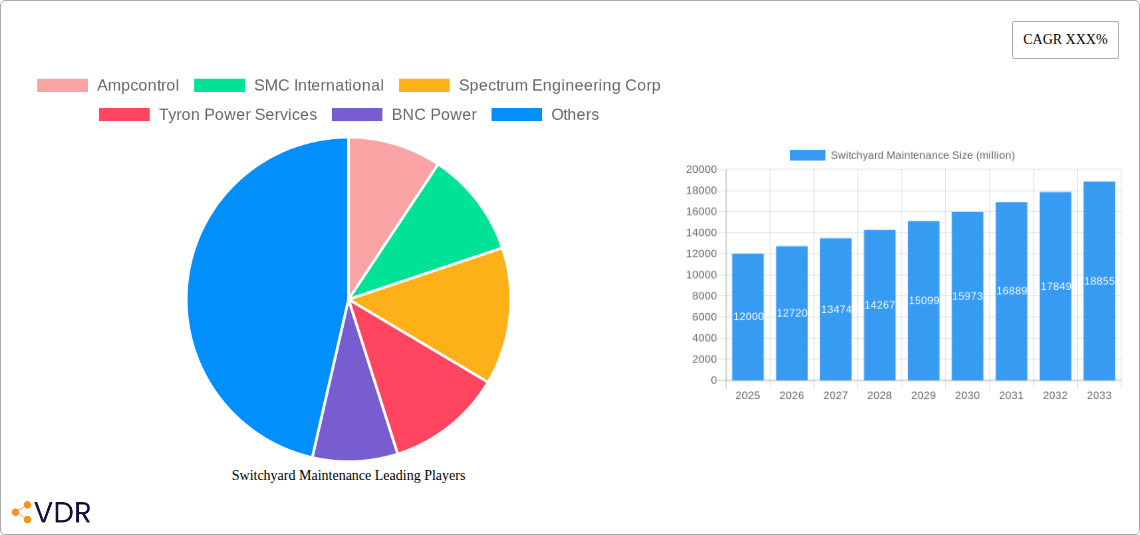
Technological advancements in switchyard maintenance, such as the adoption of smart sensors and data analytics for predictive maintenance, are significantly enhancing operational efficiency and reducing downtime. This shift towards data-driven maintenance strategies allows for proactive identification of potential issues, minimizing the risk of costly and disruptive failures. However, the market also faces challenges such as the high cost of specialized equipment and skilled labor, along with safety concerns associated with working on high-voltage equipment. Despite these restraints, the long-term outlook for the switchyard maintenance market remains optimistic, given the crucial role it plays in ensuring a secure and reliable power supply for a growing global population. A conservative estimate, considering typical growth in utility infrastructure spending, suggests a market size exceeding $15 billion by 2033.
Switchyard Maintenance Market Report: 2019-2033
This comprehensive report provides an in-depth analysis of the global switchyard maintenance market, encompassing market dynamics, growth trends, regional insights, competitive landscape, and future outlook. The study period covers 2019-2033, with 2025 as the base and estimated year. The forecast period spans 2025-2033, and the historical period analyzed is 2019-2024. This report is crucial for industry professionals, investors, and strategic decision-makers seeking a clear understanding of this vital sector within the broader power transmission and distribution (parent market) and substation maintenance (child market) industries. The market size is predicted to reach xx million by 2033.
Switchyard Maintenance Market Dynamics & Structure
The global switchyard maintenance market is characterized by moderate concentration, with key players holding significant market share. The market is driven by technological advancements such as the adoption of smart grid technologies and predictive maintenance solutions. Stringent regulatory frameworks focused on grid reliability and safety are also key drivers. Competitive pressures arise from substitute technologies and the emergence of new service providers. The market exhibits diverse end-user demographics including power utilities, independent system operators (ISOs), and industrial consumers. M&A activity in the sector is expected to be steady, driven by the need for companies to expand their service portfolios and geographic reach.
- Market Concentration: Moderately concentrated, with top 5 players holding approximately xx% market share in 2025.
- Technological Innovation: Adoption of IoT, AI, and predictive analytics for improved maintenance efficiency.
- Regulatory Frameworks: Stringent safety and reliability standards driving demand for specialized services.
- Competitive Substitutes: Limited direct substitutes, but cost pressures from emerging technologies are present.
- End-User Demographics: Power utilities (xx%), Industrial consumers (xx%), ISOs (xx%).
- M&A Trends: An estimated xx M&A deals projected between 2025 and 2033, focused on geographical expansion and service diversification.
Switchyard Maintenance Growth Trends & Insights
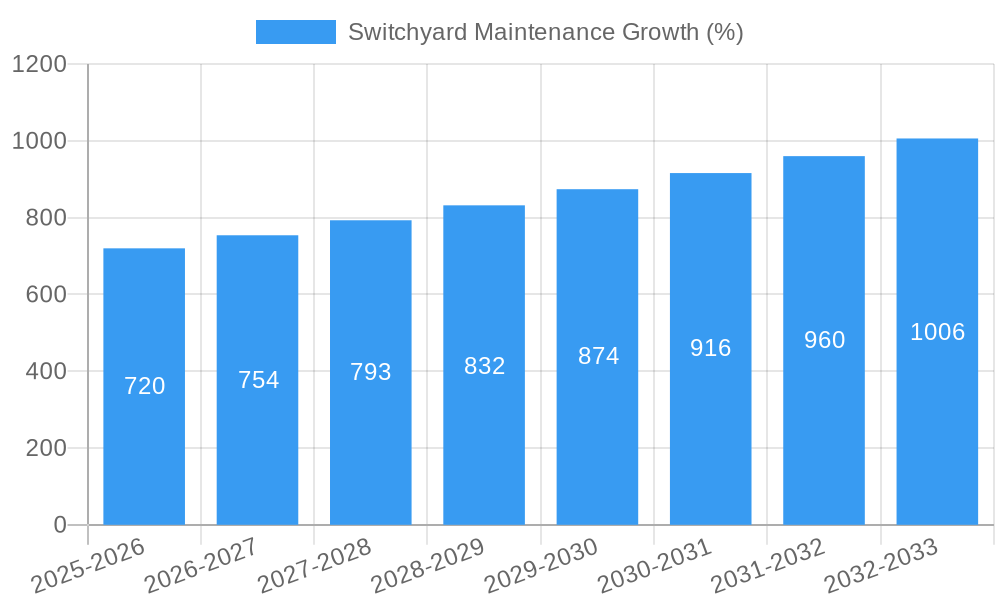
The switchyard maintenance market has experienced steady growth in recent years, driven by the aging power infrastructure and the need to ensure grid reliability. This trend is expected to continue throughout the forecast period. Adoption rates of advanced maintenance technologies are increasing, while technological disruptions are improving the efficiency and cost-effectiveness of maintenance operations. Consumer behavior shifts towards greater emphasis on sustainability and grid resilience are further shaping market demand. The market is expected to achieve a CAGR of xx% from 2025 to 2033, with market penetration projected to reach xx% by 2033.
Dominant Regions, Countries, or Segments in Switchyard Maintenance
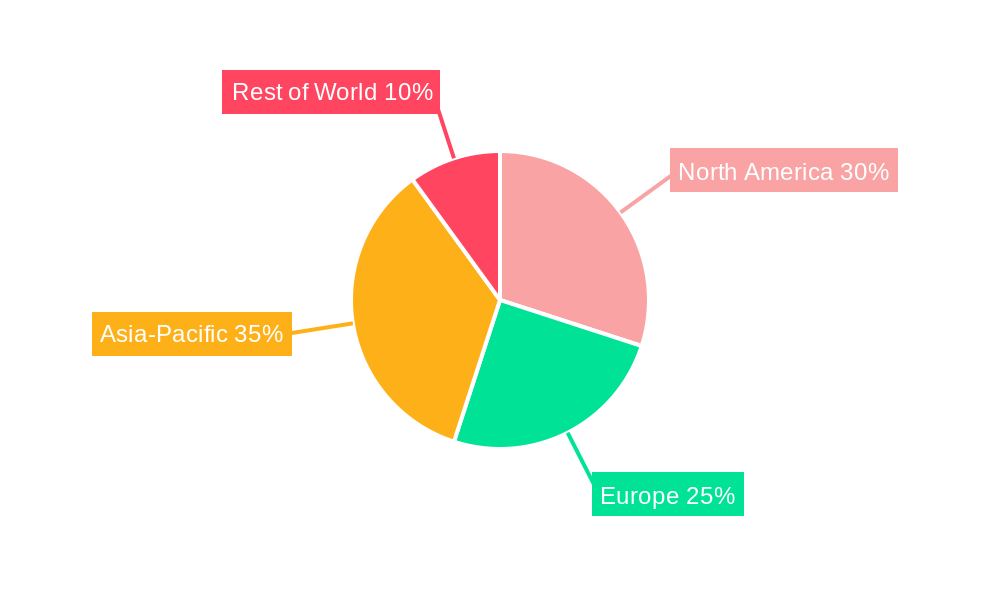
North America is currently the dominant region in the switchyard maintenance market, driven by robust investments in grid modernization and a large installed base of aging infrastructure. However, Asia-Pacific is expected to witness significant growth due to rapid economic development and increasing energy demand. Europe also represents a substantial market, with a focus on grid sustainability and renewable energy integration.
- Key Drivers in North America: High grid reliability standards, significant investments in grid modernization, and a mature market.
- Key Drivers in Asia-Pacific: Rapid economic growth, increasing electricity demand, and governmental initiatives supporting grid development.
- Key Drivers in Europe: Focus on renewable energy integration and sustainable grid management, high grid reliability standards.
- Market Share: North America (xx%), Asia-Pacific (xx%), Europe (xx%).
- Growth Potential: Asia-Pacific exhibiting the highest growth potential over the forecast period.
Switchyard Maintenance Product Landscape
The switchyard maintenance product landscape encompasses a range of services, including preventive maintenance, predictive maintenance, corrective maintenance, and specialized services such as testing and commissioning. Significant advancements in condition monitoring technologies, remote diagnostics, and data analytics are driving innovation. Companies are focusing on developing integrated solutions that improve efficiency and reduce downtime. Unique selling propositions (USPs) focus on advanced analytics, reduced maintenance time, and improved grid reliability.
Key Drivers, Barriers & Challenges in Switchyard Maintenance
Key Drivers:
- Aging power infrastructure requiring increased maintenance.
- Growing demand for grid reliability and resilience.
- Government regulations emphasizing grid safety and efficiency.
- Technological advancements improving maintenance effectiveness.
Key Challenges:
- Skilled labor shortages impacting service availability.
- High upfront costs associated with new technologies.
- Supply chain disruptions impacting availability of spare parts.
- Intense competition leading to price pressures. This impacts margins by approximately xx% in 2025.
Emerging Opportunities in Switchyard Maintenance
- Growing adoption of smart grid technologies creating opportunities for advanced maintenance services.
- Increasing demand for predictive maintenance solutions reduces overall downtime and costs.
- Untapped markets in developing economies present significant growth potential.
- The integration of renewable energy sources necessitates specialized maintenance capabilities.
Growth Accelerators in the Switchyard Maintenance Industry
The switchyard maintenance industry is poised for significant growth, accelerated by technological innovation in predictive maintenance and remote diagnostics. Strategic partnerships between equipment manufacturers and service providers are improving service offerings and expanding market reach. Furthermore, government initiatives promoting grid modernization and investment in renewable energy infrastructure are driving demand for specialized maintenance services.
Key Players Shaping the Switchyard Maintenance Market
- Ampcontrol
- SMC International
- Spectrum Engineering Corp
- Tyron Power Services
- BNC Power
- Schneider Electric
- Power Substation Services
- Hitachi ABB Power Grids
- Lee Electrical
- Power Line Services, Inc
- Mesa Line Services
- Siemens
- Global Substation Services
Notable Milestones in Switchyard Maintenance Sector
- 2022-Q3: Schneider Electric launched a new predictive maintenance platform for switchyards.
- 2021-Q4: Hitachi ABB Power Grids acquired a smaller substation maintenance company, expanding its service portfolio.
- 2020-Q1: Siemens introduced advanced diagnostic tools for switchgear components.
In-Depth Switchyard Maintenance Market Outlook
The future of the switchyard maintenance market is bright, driven by sustained growth in electricity demand and the ongoing need to modernize aging power infrastructure. The continued adoption of advanced technologies will drive efficiency gains and cost reductions, leading to further market expansion. Strategic partnerships and M&A activity will shape the competitive landscape, with a focus on providing comprehensive and integrated maintenance solutions. The market presents significant opportunities for companies that can effectively leverage technological advancements and adapt to evolving market demands.
Switchyard Maintenance Segmentation
-
1. Application
- 1.1. Residential
- 1.2. Commercial
- 1.3. Utilities
- 1.4. Oil & Gas
- 1.5. Others
-
2. Type
- 2.1. Breakdown Maintenance
- 2.2. Preventive Maintenance
- 2.3. Others
Switchyard Maintenance Segmentation By Geography
-
1. North America
- 1.1. United States
- 1.2. Canada
- 1.3. Mexico
-
2. South America
- 2.1. Brazil
- 2.2. Argentina
- 2.3. Rest of South America
-
3. Europe
- 3.1. United Kingdom
- 3.2. Germany
- 3.3. France
- 3.4. Italy
- 3.5. Spain
- 3.6. Russia
- 3.7. Benelux
- 3.8. Nordics
- 3.9. Rest of Europe
-
4. Middle East & Africa
- 4.1. Turkey
- 4.2. Israel
- 4.3. GCC
- 4.4. North Africa
- 4.5. South Africa
- 4.6. Rest of Middle East & Africa
-
5. Asia Pacific
- 5.1. China
- 5.2. India
- 5.3. Japan
- 5.4. South Korea
- 5.5. ASEAN
- 5.6. Oceania
- 5.7. Rest of Asia Pacific
Switchyard Maintenance REPORT HIGHLIGHTS
| Aspects | Details |
|---|---|
| Study Period | 2019-2033 |
| Base Year | 2024 |
| Estimated Year | 2025 |
| Forecast Period | 2025-2033 |
| Historical Period | 2019-2024 |
| Growth Rate | CAGR of XXX% from 2019-2033 |
| Segmentation |
|
Table of Contents
- 1. Introduction
- 1.1. Research Scope
- 1.2. Market Segmentation
- 1.3. Research Methodology
- 1.4. Definitions and Assumptions
- 2. Executive Summary
- 2.1. Introduction
- 3. Market Dynamics
- 3.1. Introduction
- 3.2. Market Drivers
- 3.3. Market Restrains
- 3.4. Market Trends
- 4. Market Factor Analysis
- 4.1. Porters Five Forces
- 4.2. Supply/Value Chain
- 4.3. PESTEL analysis
- 4.4. Market Entropy
- 4.5. Patent/Trademark Analysis
- 5. Global Switchyard Maintenance Analysis, Insights and Forecast, 2019-2031
- 5.1. Market Analysis, Insights and Forecast - by Application
- 5.1.1. Residential
- 5.1.2. Commercial
- 5.1.3. Utilities
- 5.1.4. Oil & Gas
- 5.1.5. Others
- 5.2. Market Analysis, Insights and Forecast - by Type
- 5.2.1. Breakdown Maintenance
- 5.2.2. Preventive Maintenance
- 5.2.3. Others
- 5.3. Market Analysis, Insights and Forecast - by Region
- 5.3.1. North America
- 5.3.2. South America
- 5.3.3. Europe
- 5.3.4. Middle East & Africa
- 5.3.5. Asia Pacific
- 5.1. Market Analysis, Insights and Forecast - by Application
- 6. North America Switchyard Maintenance Analysis, Insights and Forecast, 2019-2031
- 6.1. Market Analysis, Insights and Forecast - by Application
- 6.1.1. Residential
- 6.1.2. Commercial
- 6.1.3. Utilities
- 6.1.4. Oil & Gas
- 6.1.5. Others
- 6.2. Market Analysis, Insights and Forecast - by Type
- 6.2.1. Breakdown Maintenance
- 6.2.2. Preventive Maintenance
- 6.2.3. Others
- 6.1. Market Analysis, Insights and Forecast - by Application
- 7. South America Switchyard Maintenance Analysis, Insights and Forecast, 2019-2031
- 7.1. Market Analysis, Insights and Forecast - by Application
- 7.1.1. Residential
- 7.1.2. Commercial
- 7.1.3. Utilities
- 7.1.4. Oil & Gas
- 7.1.5. Others
- 7.2. Market Analysis, Insights and Forecast - by Type
- 7.2.1. Breakdown Maintenance
- 7.2.2. Preventive Maintenance
- 7.2.3. Others
- 7.1. Market Analysis, Insights and Forecast - by Application
- 8. Europe Switchyard Maintenance Analysis, Insights and Forecast, 2019-2031
- 8.1. Market Analysis, Insights and Forecast - by Application
- 8.1.1. Residential
- 8.1.2. Commercial
- 8.1.3. Utilities
- 8.1.4. Oil & Gas
- 8.1.5. Others
- 8.2. Market Analysis, Insights and Forecast - by Type
- 8.2.1. Breakdown Maintenance
- 8.2.2. Preventive Maintenance
- 8.2.3. Others
- 8.1. Market Analysis, Insights and Forecast - by Application
- 9. Middle East & Africa Switchyard Maintenance Analysis, Insights and Forecast, 2019-2031
- 9.1. Market Analysis, Insights and Forecast - by Application
- 9.1.1. Residential
- 9.1.2. Commercial
- 9.1.3. Utilities
- 9.1.4. Oil & Gas
- 9.1.5. Others
- 9.2. Market Analysis, Insights and Forecast - by Type
- 9.2.1. Breakdown Maintenance
- 9.2.2. Preventive Maintenance
- 9.2.3. Others
- 9.1. Market Analysis, Insights and Forecast - by Application
- 10. Asia Pacific Switchyard Maintenance Analysis, Insights and Forecast, 2019-2031
- 10.1. Market Analysis, Insights and Forecast - by Application
- 10.1.1. Residential
- 10.1.2. Commercial
- 10.1.3. Utilities
- 10.1.4. Oil & Gas
- 10.1.5. Others
- 10.2. Market Analysis, Insights and Forecast - by Type
- 10.2.1. Breakdown Maintenance
- 10.2.2. Preventive Maintenance
- 10.2.3. Others
- 10.1. Market Analysis, Insights and Forecast - by Application
- 11. Competitive Analysis
- 11.1. Global Market Share Analysis 2024
- 11.2. Company Profiles
- 11.2.1 Ampcontrol
- 11.2.1.1. Overview
- 11.2.1.2. Products
- 11.2.1.3. SWOT Analysis
- 11.2.1.4. Recent Developments
- 11.2.1.5. Financials (Based on Availability)
- 11.2.2 SMC International
- 11.2.2.1. Overview
- 11.2.2.2. Products
- 11.2.2.3. SWOT Analysis
- 11.2.2.4. Recent Developments
- 11.2.2.5. Financials (Based on Availability)
- 11.2.3 Spectrum Engineering Corp
- 11.2.3.1. Overview
- 11.2.3.2. Products
- 11.2.3.3. SWOT Analysis
- 11.2.3.4. Recent Developments
- 11.2.3.5. Financials (Based on Availability)
- 11.2.4 Tyron Power Services
- 11.2.4.1. Overview
- 11.2.4.2. Products
- 11.2.4.3. SWOT Analysis
- 11.2.4.4. Recent Developments
- 11.2.4.5. Financials (Based on Availability)
- 11.2.5 BNC Power
- 11.2.5.1. Overview
- 11.2.5.2. Products
- 11.2.5.3. SWOT Analysis
- 11.2.5.4. Recent Developments
- 11.2.5.5. Financials (Based on Availability)
- 11.2.6 Schneider Electric
- 11.2.6.1. Overview
- 11.2.6.2. Products
- 11.2.6.3. SWOT Analysis
- 11.2.6.4. Recent Developments
- 11.2.6.5. Financials (Based on Availability)
- 11.2.7 Power Substation Services
- 11.2.7.1. Overview
- 11.2.7.2. Products
- 11.2.7.3. SWOT Analysis
- 11.2.7.4. Recent Developments
- 11.2.7.5. Financials (Based on Availability)
- 11.2.8 Hitachi ABB Power Grids
- 11.2.8.1. Overview
- 11.2.8.2. Products
- 11.2.8.3. SWOT Analysis
- 11.2.8.4. Recent Developments
- 11.2.8.5. Financials (Based on Availability)
- 11.2.9 Lee Electrical
- 11.2.9.1. Overview
- 11.2.9.2. Products
- 11.2.9.3. SWOT Analysis
- 11.2.9.4. Recent Developments
- 11.2.9.5. Financials (Based on Availability)
- 11.2.10 Power Line Services Inc
- 11.2.10.1. Overview
- 11.2.10.2. Products
- 11.2.10.3. SWOT Analysis
- 11.2.10.4. Recent Developments
- 11.2.10.5. Financials (Based on Availability)
- 11.2.11 Mesa Line Services
- 11.2.11.1. Overview
- 11.2.11.2. Products
- 11.2.11.3. SWOT Analysis
- 11.2.11.4. Recent Developments
- 11.2.11.5. Financials (Based on Availability)
- 11.2.12 Siemens
- 11.2.12.1. Overview
- 11.2.12.2. Products
- 11.2.12.3. SWOT Analysis
- 11.2.12.4. Recent Developments
- 11.2.12.5. Financials (Based on Availability)
- 11.2.13 Global Substation Services
- 11.2.13.1. Overview
- 11.2.13.2. Products
- 11.2.13.3. SWOT Analysis
- 11.2.13.4. Recent Developments
- 11.2.13.5. Financials (Based on Availability)
- 11.2.1 Ampcontrol
List of Figures
- Figure 1: Global Switchyard Maintenance Revenue Breakdown (million, %) by Region 2024 & 2032
- Figure 2: North America Switchyard Maintenance Revenue (million), by Application 2024 & 2032
- Figure 3: North America Switchyard Maintenance Revenue Share (%), by Application 2024 & 2032
- Figure 4: North America Switchyard Maintenance Revenue (million), by Type 2024 & 2032
- Figure 5: North America Switchyard Maintenance Revenue Share (%), by Type 2024 & 2032
- Figure 6: North America Switchyard Maintenance Revenue (million), by Country 2024 & 2032
- Figure 7: North America Switchyard Maintenance Revenue Share (%), by Country 2024 & 2032
- Figure 8: South America Switchyard Maintenance Revenue (million), by Application 2024 & 2032
- Figure 9: South America Switchyard Maintenance Revenue Share (%), by Application 2024 & 2032
- Figure 10: South America Switchyard Maintenance Revenue (million), by Type 2024 & 2032
- Figure 11: South America Switchyard Maintenance Revenue Share (%), by Type 2024 & 2032
- Figure 12: South America Switchyard Maintenance Revenue (million), by Country 2024 & 2032
- Figure 13: South America Switchyard Maintenance Revenue Share (%), by Country 2024 & 2032
- Figure 14: Europe Switchyard Maintenance Revenue (million), by Application 2024 & 2032
- Figure 15: Europe Switchyard Maintenance Revenue Share (%), by Application 2024 & 2032
- Figure 16: Europe Switchyard Maintenance Revenue (million), by Type 2024 & 2032
- Figure 17: Europe Switchyard Maintenance Revenue Share (%), by Type 2024 & 2032
- Figure 18: Europe Switchyard Maintenance Revenue (million), by Country 2024 & 2032
- Figure 19: Europe Switchyard Maintenance Revenue Share (%), by Country 2024 & 2032
- Figure 20: Middle East & Africa Switchyard Maintenance Revenue (million), by Application 2024 & 2032
- Figure 21: Middle East & Africa Switchyard Maintenance Revenue Share (%), by Application 2024 & 2032
- Figure 22: Middle East & Africa Switchyard Maintenance Revenue (million), by Type 2024 & 2032
- Figure 23: Middle East & Africa Switchyard Maintenance Revenue Share (%), by Type 2024 & 2032
- Figure 24: Middle East & Africa Switchyard Maintenance Revenue (million), by Country 2024 & 2032
- Figure 25: Middle East & Africa Switchyard Maintenance Revenue Share (%), by Country 2024 & 2032
- Figure 26: Asia Pacific Switchyard Maintenance Revenue (million), by Application 2024 & 2032
- Figure 27: Asia Pacific Switchyard Maintenance Revenue Share (%), by Application 2024 & 2032
- Figure 28: Asia Pacific Switchyard Maintenance Revenue (million), by Type 2024 & 2032
- Figure 29: Asia Pacific Switchyard Maintenance Revenue Share (%), by Type 2024 & 2032
- Figure 30: Asia Pacific Switchyard Maintenance Revenue (million), by Country 2024 & 2032
- Figure 31: Asia Pacific Switchyard Maintenance Revenue Share (%), by Country 2024 & 2032
List of Tables
- Table 1: Global Switchyard Maintenance Revenue million Forecast, by Region 2019 & 2032
- Table 2: Global Switchyard Maintenance Revenue million Forecast, by Application 2019 & 2032
- Table 3: Global Switchyard Maintenance Revenue million Forecast, by Type 2019 & 2032
- Table 4: Global Switchyard Maintenance Revenue million Forecast, by Region 2019 & 2032
- Table 5: Global Switchyard Maintenance Revenue million Forecast, by Application 2019 & 2032
- Table 6: Global Switchyard Maintenance Revenue million Forecast, by Type 2019 & 2032
- Table 7: Global Switchyard Maintenance Revenue million Forecast, by Country 2019 & 2032
- Table 8: United States Switchyard Maintenance Revenue (million) Forecast, by Application 2019 & 2032
- Table 9: Canada Switchyard Maintenance Revenue (million) Forecast, by Application 2019 & 2032
- Table 10: Mexico Switchyard Maintenance Revenue (million) Forecast, by Application 2019 & 2032
- Table 11: Global Switchyard Maintenance Revenue million Forecast, by Application 2019 & 2032
- Table 12: Global Switchyard Maintenance Revenue million Forecast, by Type 2019 & 2032
- Table 13: Global Switchyard Maintenance Revenue million Forecast, by Country 2019 & 2032
- Table 14: Brazil Switchyard Maintenance Revenue (million) Forecast, by Application 2019 & 2032
- Table 15: Argentina Switchyard Maintenance Revenue (million) Forecast, by Application 2019 & 2032
- Table 16: Rest of South America Switchyard Maintenance Revenue (million) Forecast, by Application 2019 & 2032
- Table 17: Global Switchyard Maintenance Revenue million Forecast, by Application 2019 & 2032
- Table 18: Global Switchyard Maintenance Revenue million Forecast, by Type 2019 & 2032
- Table 19: Global Switchyard Maintenance Revenue million Forecast, by Country 2019 & 2032
- Table 20: United Kingdom Switchyard Maintenance Revenue (million) Forecast, by Application 2019 & 2032
- Table 21: Germany Switchyard Maintenance Revenue (million) Forecast, by Application 2019 & 2032
- Table 22: France Switchyard Maintenance Revenue (million) Forecast, by Application 2019 & 2032
- Table 23: Italy Switchyard Maintenance Revenue (million) Forecast, by Application 2019 & 2032
- Table 24: Spain Switchyard Maintenance Revenue (million) Forecast, by Application 2019 & 2032
- Table 25: Russia Switchyard Maintenance Revenue (million) Forecast, by Application 2019 & 2032
- Table 26: Benelux Switchyard Maintenance Revenue (million) Forecast, by Application 2019 & 2032
- Table 27: Nordics Switchyard Maintenance Revenue (million) Forecast, by Application 2019 & 2032
- Table 28: Rest of Europe Switchyard Maintenance Revenue (million) Forecast, by Application 2019 & 2032
- Table 29: Global Switchyard Maintenance Revenue million Forecast, by Application 2019 & 2032
- Table 30: Global Switchyard Maintenance Revenue million Forecast, by Type 2019 & 2032
- Table 31: Global Switchyard Maintenance Revenue million Forecast, by Country 2019 & 2032
- Table 32: Turkey Switchyard Maintenance Revenue (million) Forecast, by Application 2019 & 2032
- Table 33: Israel Switchyard Maintenance Revenue (million) Forecast, by Application 2019 & 2032
- Table 34: GCC Switchyard Maintenance Revenue (million) Forecast, by Application 2019 & 2032
- Table 35: North Africa Switchyard Maintenance Revenue (million) Forecast, by Application 2019 & 2032
- Table 36: South Africa Switchyard Maintenance Revenue (million) Forecast, by Application 2019 & 2032
- Table 37: Rest of Middle East & Africa Switchyard Maintenance Revenue (million) Forecast, by Application 2019 & 2032
- Table 38: Global Switchyard Maintenance Revenue million Forecast, by Application 2019 & 2032
- Table 39: Global Switchyard Maintenance Revenue million Forecast, by Type 2019 & 2032
- Table 40: Global Switchyard Maintenance Revenue million Forecast, by Country 2019 & 2032
- Table 41: China Switchyard Maintenance Revenue (million) Forecast, by Application 2019 & 2032
- Table 42: India Switchyard Maintenance Revenue (million) Forecast, by Application 2019 & 2032
- Table 43: Japan Switchyard Maintenance Revenue (million) Forecast, by Application 2019 & 2032
- Table 44: South Korea Switchyard Maintenance Revenue (million) Forecast, by Application 2019 & 2032
- Table 45: ASEAN Switchyard Maintenance Revenue (million) Forecast, by Application 2019 & 2032
- Table 46: Oceania Switchyard Maintenance Revenue (million) Forecast, by Application 2019 & 2032
- Table 47: Rest of Asia Pacific Switchyard Maintenance Revenue (million) Forecast, by Application 2019 & 2032
Frequently Asked Questions
1. What is the projected Compound Annual Growth Rate (CAGR) of the Switchyard Maintenance?
The projected CAGR is approximately XXX%.
2. Which companies are prominent players in the Switchyard Maintenance?
Key companies in the market include Ampcontrol, SMC International, Spectrum Engineering Corp, Tyron Power Services, BNC Power, Schneider Electric, Power Substation Services, Hitachi ABB Power Grids, Lee Electrical, Power Line Services, Inc, Mesa Line Services, Siemens, Global Substation Services.
3. What are the main segments of the Switchyard Maintenance?
The market segments include Application, Type.
4. Can you provide details about the market size?
The market size is estimated to be USD XXX million as of 2022.
5. What are some drivers contributing to market growth?
N/A
6. What are the notable trends driving market growth?
N/A
7. Are there any restraints impacting market growth?
N/A
8. Can you provide examples of recent developments in the market?
N/A
9. What pricing options are available for accessing the report?
Pricing options include single-user, multi-user, and enterprise licenses priced at USD 4250.00, USD 6375.00, and USD 8500.00 respectively.
10. Is the market size provided in terms of value or volume?
The market size is provided in terms of value, measured in million.
11. Are there any specific market keywords associated with the report?
Yes, the market keyword associated with the report is "Switchyard Maintenance," which aids in identifying and referencing the specific market segment covered.
12. How do I determine which pricing option suits my needs best?
The pricing options vary based on user requirements and access needs. Individual users may opt for single-user licenses, while businesses requiring broader access may choose multi-user or enterprise licenses for cost-effective access to the report.
13. Are there any additional resources or data provided in the Switchyard Maintenance report?
While the report offers comprehensive insights, it's advisable to review the specific contents or supplementary materials provided to ascertain if additional resources or data are available.
14. How can I stay updated on further developments or reports in the Switchyard Maintenance?
To stay informed about further developments, trends, and reports in the Switchyard Maintenance, consider subscribing to industry newsletters, following relevant companies and organizations, or regularly checking reputable industry news sources and publications.
Methodology
Step 1 - Identification of Relevant Samples Size from Population Database


Step 2 - Approaches for Defining Global Market Size (Value, Volume* & Price*)

Note*: In applicable scenarios
Step 3 - Data Sources
Primary Research
- Web Analytics
- Survey Reports
- Research Institute
- Latest Research Reports
- Opinion Leaders
Secondary Research
- Annual Reports
- White Paper
- Latest Press Release
- Industry Association
- Paid Database
- Investor Presentations

Step 4 - Data Triangulation
Involves using different sources of information in order to increase the validity of a study
These sources are likely to be stakeholders in a program - participants, other researchers, program staff, other community members, and so on.
Then we put all data in single framework & apply various statistical tools to find out the dynamic on the market.
During the analysis stage, feedback from the stakeholder groups would be compared to determine areas of agreement as well as areas of divergence


