

Key Insights
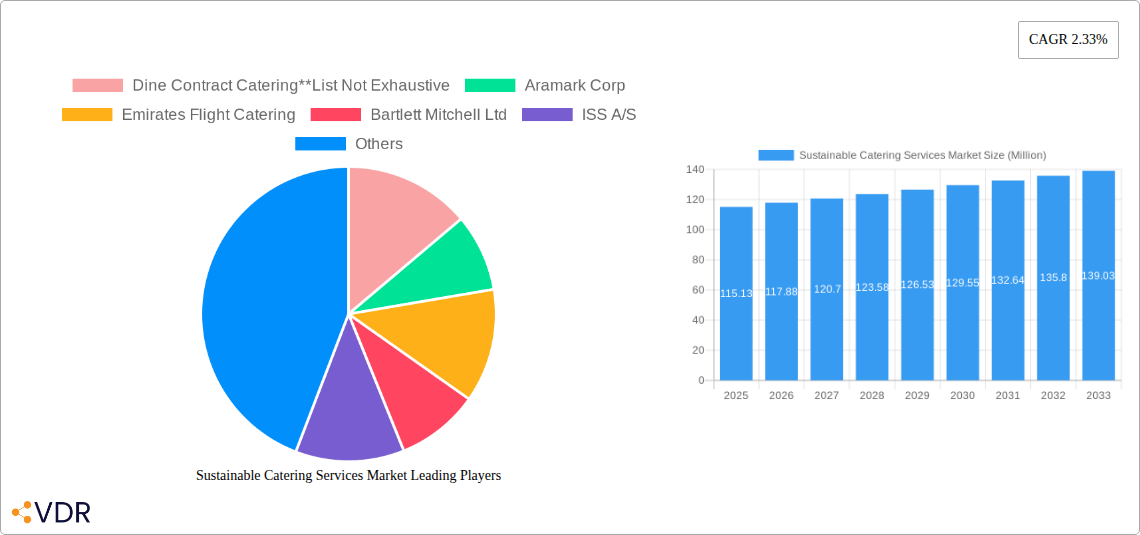
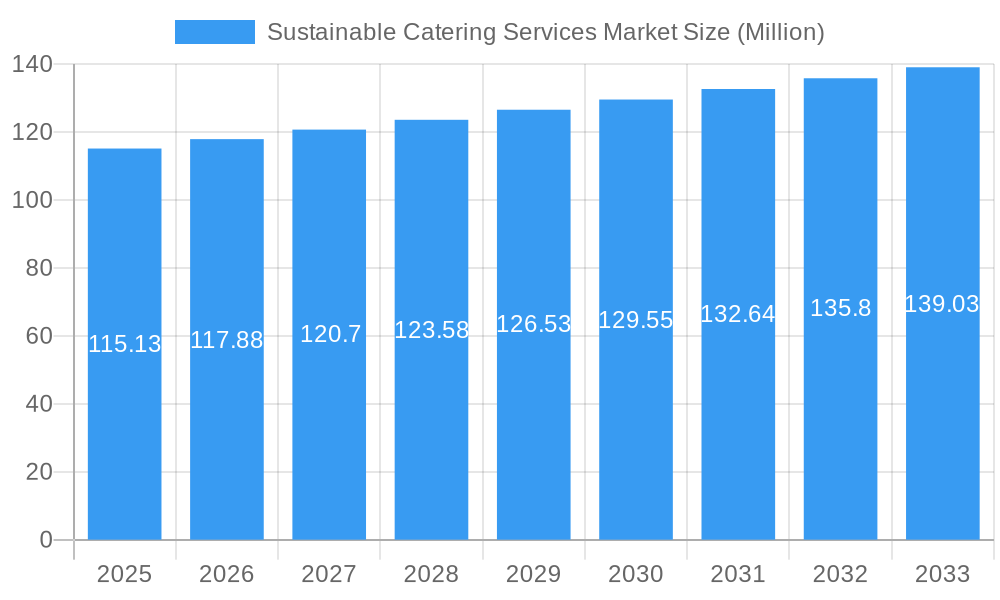
The global sustainable catering services market, valued at $115.13 million in 2025, is projected to experience steady growth, driven by increasing consumer awareness of environmental and social responsibility. A Compound Annual Growth Rate (CAGR) of 2.33% from 2025 to 2033 indicates a gradual but consistent expansion. Key drivers include the rising demand for locally sourced, organic, and plant-based food options within catering services. Growing corporate social responsibility (CSR) initiatives and the increasing adoption of sustainable practices by businesses are further fueling this market's expansion. The segments showing significant promise include contractual catering services (dominating due to long-term contracts and economies of scale), corporate events (driven by large-scale events adopting sustainable choices), and the hospitality sector (influenced by eco-conscious travelers). While specific market restraints aren't explicitly provided, potential challenges include the higher cost of sustainable ingredients and the complexities of implementing sustainable practices across the entire supply chain. However, these challenges are being addressed through innovative sourcing strategies, technological advancements, and growing consumer willingness to pay a premium for ethically and sustainably produced food.
Sustainable Catering Services Market Market Size (In Million)
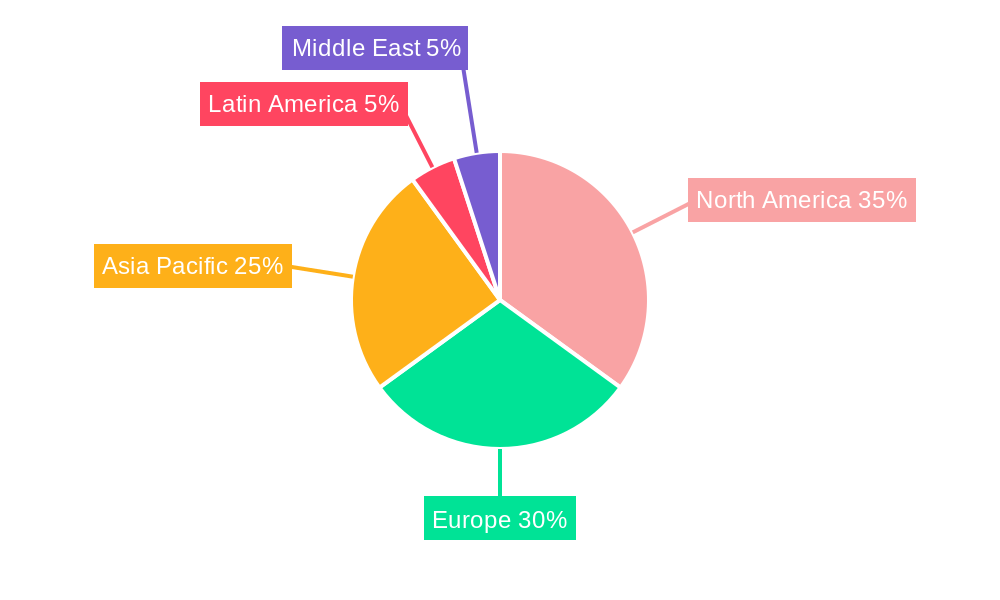
The geographical distribution reveals a diverse market landscape. North America and Europe are currently leading the market due to strong consumer demand and established sustainable food systems. However, the Asia-Pacific region presents significant growth potential, driven by rising disposable incomes, increasing urbanization, and a growing middle class increasingly aware of sustainable practices. Key players like Aramark, Compass Group, and Elior are actively investing in sustainable initiatives to cater to this evolving market, leading to increased competition and innovation in the sector. The market is segmented by service type (contractual, non-contractual, other), event type (corporate, wedding, social, other), and end-user (individuals, hospitality, education, healthcare, in-flight, other). This segmentation facilitates a more precise understanding of the market's dynamics and allows for targeted marketing strategies.
Sustainable Catering Services Market Company Market Share
Sustainable Catering Services Market: A Comprehensive Market Report (2019-2033)
This comprehensive report provides a detailed analysis of the Sustainable Catering Services Market, encompassing market dynamics, growth trends, regional dominance, product landscape, key players, and future outlook. The report covers the period 2019-2033, with 2025 as the base year and a forecast period from 2025-2033. The market is segmented by service type (Contractual Catering Services, Non-Contractual Catering Services, Other Catering Services), event type (Corporate, Wedding, Social Events, Others), and end-user (Individuals, Hospitality, Educational, Healthcare, In-flight, Other End Users). The total market size in 2025 is estimated at xx Million.
Sustainable Catering Services Market Dynamics & Structure
The Sustainable Catering Services Market is a dynamic landscape shaped by several interconnected factors. Market concentration is moderate, with several large players dominating the contractual catering segment, while smaller businesses thrive in the non-contractual sector. Technological innovation, particularly in areas like food waste reduction technology and sustainable packaging, is a key driver. Stricter environmental regulations and growing consumer awareness of sustainability are also pushing the market towards environmentally friendly practices. Competitive substitutes include traditional catering services that lack sustainable practices, but the increasing demand for environmentally responsible choices is eroding their market share. End-user demographics, particularly the increasing preference for sustainable options among younger generations, are significantly influencing market growth. The market has witnessed a number of mergers and acquisitions (M&A) in recent years, indicating consolidation and a drive for expansion within the industry.
- Market Concentration: Moderate, with a few large players dominating the contractual catering segment.
- Technological Innovation: Key driver, focusing on waste reduction and sustainable packaging.
- Regulatory Framework: Stringent environmental regulations are driving adoption of sustainable practices.
- Competitive Substitutes: Traditional catering services, but their market share is declining.
- End-User Demographics: Growing preference for sustainability among younger generations.
- M&A Trends: Significant M&A activity indicates industry consolidation and expansion. The total value of M&A deals between 2019 and 2024 is estimated at xx Million. The average deal size was approximately xx Million.
Sustainable Catering Services Market Growth Trends & Insights
The Sustainable Catering Services Market has experienced robust growth in recent years, driven by increasing environmental consciousness and a growing demand for ethical and responsible consumption. The market size has grown from xx Million in 2019 to an estimated xx Million in 2025, exhibiting a Compound Annual Growth Rate (CAGR) of xx% during the historical period. This growth is fueled by several factors including technological advancements in sustainable food sourcing and preparation, the rise of eco-conscious consumers, and supportive government policies promoting sustainability. The market penetration of sustainable catering services is steadily increasing, particularly in urban areas and among environmentally aware businesses and organizations. Technological disruptions, such as the use of AI-powered waste management systems and plant-based protein alternatives, are further accelerating the market's expansion. Consumer behavior is shifting towards prioritizing sustainability, leading to increased demand for sustainable catering services. The forecast period (2025-2033) is expected to witness a CAGR of xx%, reaching an estimated market size of xx Million by 2033.
Dominant Regions, Countries, or Segments in Sustainable Catering Services Market
The Sustainable Catering Services Market exhibits varied growth across different regions, countries, and segments. North America and Europe currently hold significant market shares, driven by high environmental awareness and robust regulatory frameworks. Within these regions, major cities and densely populated areas show higher adoption rates. The Contractual Catering Services segment accounts for the largest market share, owing to consistent demand from corporations, educational institutions, and healthcare providers seeking sustainable solutions. The Corporate event type dominates the event segment due to the significant investment in sustainable practices by large organizations. Growth is also observed in the wedding and social events segment, reflecting a rise in environmentally conscious consumers.
- Key Drivers (North America & Europe): Stringent environmental regulations, high consumer awareness, and significant corporate investments in sustainable practices.
- Contractual Catering Services: Largest segment due to consistent demand from corporations and institutions.
- Corporate Events: Dominant event type due to large-scale corporate commitments to sustainability.
- Market Share: North America and Europe hold the largest market share, with xx% and xx% respectively. The remaining market share is distributed across Asia-Pacific, Middle East & Africa and South America.
- Growth Potential: Asia-Pacific is expected to show significant growth in the forecast period.
Sustainable Catering Services Market Product Landscape
The product landscape of the Sustainable Catering Services Market is characterized by innovation in sustainable food sourcing, packaging, and waste management. Companies are focusing on locally sourced, seasonal ingredients to minimize their carbon footprint and offering innovative packaging options like compostable or biodegradable alternatives to traditional plastic containers. Performance metrics such as carbon emissions, water usage, and waste generated are increasingly monitored and reported to demonstrate the environmental impact of the services provided. Unique selling propositions include transparency in sourcing, commitment to reducing food waste, and the use of eco-friendly practices throughout the supply chain. Technological advancements in food preservation and transportation are also enabling efficient delivery of fresh and sustainable food.
Key Drivers, Barriers & Challenges in Sustainable Catering Services Market
Key Drivers:
- Growing consumer demand for sustainable and ethically sourced food.
- Stringent environmental regulations driving adoption of green practices.
- Technological advancements in sustainable food production and waste management.
- Corporate social responsibility (CSR) initiatives promoting sustainable catering.
Key Challenges and Restraints:
- Higher costs associated with sustainable ingredients and packaging can limit affordability. The estimated impact of higher costs on market growth is xx% .
- Supply chain complexities in sourcing sustainable products consistently.
- Lack of standardization in sustainability certifications and labeling.
- Competition from traditional catering services offering lower prices.
Emerging Opportunities in Sustainable Catering Services Market
- Expansion into untapped markets: Emerging economies present significant growth opportunities.
- Innovative applications: Development of sustainable event catering solutions, and specialized dietary requirements.
- Evolving consumer preferences: Catering to specialized diets (vegan, vegetarian, etc.).
- Technological innovations: Integration of AI-driven food waste management systems, utilization of blockchain technology to enhance transparency in supply chain.
Growth Accelerators in the Sustainable Catering Services Market Industry
Technological breakthroughs, particularly in areas such as precision fermentation, vertical farming, and AI-driven supply chain optimization, are significant drivers of long-term growth. Strategic partnerships between catering companies, food producers, and technology providers foster innovation and market expansion. Adopting robust sustainability certifications and engaging in responsible marketing campaigns can attract environmentally conscious customers. Focusing on specific niche markets, like corporate sustainability events or eco-friendly wedding catering, allows companies to tap into specialized consumer segments.
Key Players Shaping the Sustainable Catering Services Market Market
- Dine Contract Catering
- Aramark Corp
- Emirates Flight Catering
- Bartlett Mitchell Ltd
- ISS A/S
- Elior Group
- Entier Limited
- Compass Group PLC
- DO & CO Aktiengesellschaft
- CH and Co Catering Group Ltd
Notable Milestones in Sustainable Catering Services Market Sector
- January 2024: Compass Group PLC acquired CH&CO for USD 600 Million, significantly impacting market consolidation.
- May 2023: Aramark partnered with Bean Sprouts, expanding its reach in the healthy and sustainable children’s food segment.
In-Depth Sustainable Catering Services Market Market Outlook
The Sustainable Catering Services Market is poised for significant growth in the coming years, driven by consistent increases in consumer demand and stringent environmental regulations. The increasing adoption of sustainable practices across various sectors, coupled with technological advancements, will further fuel market expansion. Strategic partnerships and the development of innovative solutions will be crucial for companies to remain competitive in this rapidly evolving market. The market's future hinges on its capacity to address challenges related to cost optimization, supply chain management, and consumer education. The forecast period presents substantial opportunities for growth and innovation in the sustainable catering services sector.
Sustainable Catering Services Market Segmentation
-
1. Service Type
- 1.1. Contractual Catering Services
- 1.2. Non-Contractual Catering Services
- 1.3. Other Catering Services
-
2. Event Type
- 2.1. Corporate
- 2.2. Wedding
- 2.3. Social Events
- 2.4. Others
-
3. End-User
- 3.1. Individuals
- 3.2. Hospitality
- 3.3. Educational
- 3.4. Healthcare
- 3.5. In-Flight
- 3.6. Other End Users
- 4. Geography
-
5. North America
- 5.1. United States
- 5.2. Canada
- 5.3. Mexico
- 5.4. Rest of North America
-
6. Europe
- 6.1. United Kingdom
- 6.2. Germany
- 6.3. France
- 6.4. Russia
- 6.5. Italy
- 6.6. Spain
- 6.7. Rest of Europe
-
7. Asia-Pacific
- 7.1. India
- 7.2. China
- 7.3. Japan
- 7.4. Australia
- 7.5. Rest of Asia-Pacific
-
8. South America
- 8.1. Brazil
- 8.2. Argentina
- 8.3. Rest of South America
-
9. Middle-East and Africa
- 9.1. United Arab Emirates
- 9.2. South Africa
- 9.3. Rest of Middle-East and Africa
Sustainable Catering Services Market Segmentation By Geography
-
1. North America
- 1.1. United States
- 1.2. Canada
- 1.3. Mexico
-
2. South America
- 2.1. Brazil
- 2.2. Argentina
- 2.3. Rest of South America
-
3. Europe
- 3.1. United Kingdom
- 3.2. Germany
- 3.3. France
- 3.4. Italy
- 3.5. Spain
- 3.6. Russia
- 3.7. Benelux
- 3.8. Nordics
- 3.9. Rest of Europe
-
4. Middle East & Africa
- 4.1. Turkey
- 4.2. Israel
- 4.3. GCC
- 4.4. North Africa
- 4.5. South Africa
- 4.6. Rest of Middle East & Africa
-
5. Asia Pacific
- 5.1. China
- 5.2. India
- 5.3. Japan
- 5.4. South Korea
- 5.5. ASEAN
- 5.6. Oceania
- 5.7. Rest of Asia Pacific
Sustainable Catering Services Market Regional Market Share
Geographic Coverage of Sustainable Catering Services Market
Sustainable Catering Services Market REPORT HIGHLIGHTS
| Aspects | Details |
|---|---|
| Study Period | 2020-2034 |
| Base Year | 2025 |
| Estimated Year | 2026 |
| Forecast Period | 2026-2034 |
| Historical Period | 2020-2025 |
| Growth Rate | CAGR of 2.33% from 2020-2034 |
| Segmentation |
|
Table of Contents
- 1. Introduction
- 1.1. Research Scope
- 1.2. Market Segmentation
- 1.3. Research Objective
- 1.4. Definitions and Assumptions
- 2. Executive Summary
- 2.1. Market Snapshot
- 3. Market Dynamics
- 3.1. Market Drivers
- 3.2. Market Restrains
- 3.3. Market Trends
- 3.4. Market Opportunities
- 4. Market Factor Analysis
- 4.1. Porters Five Forces
- 4.1.1. Bargaining Power of Suppliers
- 4.1.2. Bargaining Power of Buyers
- 4.1.3. Threat of New Entrants
- 4.1.4. Threat of Substitutes
- 4.1.5. Competitive Rivalry
- 4.2. PESTEL analysis
- 4.3. BCG Analysis
- 4.3.1. Stars (High Growth, High Market Share)
- 4.3.2. Cash Cows (Low Growth, High Market Share)
- 4.3.3. Question Mark (High Growth, Low Market Share)
- 4.3.4. Dogs (Low Growth, Low Market Share)
- 4.4. Ansoff Matrix Analysis
- 4.5. Supply Chain Analysis
- 4.6. Regulatory Landscape
- 4.7. Current Market Potential and Opportunity Assessment (TAM–SAM–SOM Framework)
- 4.8. VDR Analyst Note
- 4.1. Porters Five Forces
- 5. Market Analysis, Insights and Forecast 2021-2033
- 5.1. Market Analysis, Insights and Forecast - by Service Type
- 5.1.1. Contractual Catering Services
- 5.1.2. Non-Contractual Catering Services
- 5.1.3. Other Catering Services
- 5.2. Market Analysis, Insights and Forecast - by Event Type
- 5.2.1. Corporate
- 5.2.2. Wedding
- 5.2.3. Social Events
- 5.2.4. Others
- 5.3. Market Analysis, Insights and Forecast - by End-User
- 5.3.1. Individuals
- 5.3.2. Hospitality
- 5.3.3. Educational
- 5.3.4. Healthcare
- 5.3.5. In-Flight
- 5.3.6. Other End Users
- 5.4. Market Analysis, Insights and Forecast - by Geography
- 5.5. Market Analysis, Insights and Forecast - by North America
- 5.5.1. United States
- 5.5.2. Canada
- 5.5.3. Mexico
- 5.5.4. Rest of North America
- 5.6. Market Analysis, Insights and Forecast - by Europe
- 5.6.1. United Kingdom
- 5.6.2. Germany
- 5.6.3. France
- 5.6.4. Russia
- 5.6.5. Italy
- 5.6.6. Spain
- 5.6.7. Rest of Europe
- 5.7. Market Analysis, Insights and Forecast - by Asia-Pacific
- 5.7.1. India
- 5.7.2. China
- 5.7.3. Japan
- 5.7.4. Australia
- 5.7.5. Rest of Asia-Pacific
- 5.8. Market Analysis, Insights and Forecast - by South America
- 5.8.1. Brazil
- 5.8.2. Argentina
- 5.8.3. Rest of South America
- 5.9. Market Analysis, Insights and Forecast - by Middle-East and Africa
- 5.9.1. United Arab Emirates
- 5.9.2. South Africa
- 5.9.3. Rest of Middle-East and Africa
- 5.10. Market Analysis, Insights and Forecast - by Region
- 5.10.1. North America
- 5.10.2. South America
- 5.10.3. Europe
- 5.10.4. Middle East & Africa
- 5.10.5. Asia Pacific
- 5.1. Market Analysis, Insights and Forecast - by Service Type
- 6. Global Sustainable Catering Services Market Analysis, Insights and Forecast, 2021-2033
- 6.1. Market Analysis, Insights and Forecast - by Service Type
- 6.1.1. Contractual Catering Services
- 6.1.2. Non-Contractual Catering Services
- 6.1.3. Other Catering Services
- 6.2. Market Analysis, Insights and Forecast - by Event Type
- 6.2.1. Corporate
- 6.2.2. Wedding
- 6.2.3. Social Events
- 6.2.4. Others
- 6.3. Market Analysis, Insights and Forecast - by End-User
- 6.3.1. Individuals
- 6.3.2. Hospitality
- 6.3.3. Educational
- 6.3.4. Healthcare
- 6.3.5. In-Flight
- 6.3.6. Other End Users
- 6.4. Market Analysis, Insights and Forecast - by Geography
- 6.5. Market Analysis, Insights and Forecast - by North America
- 6.5.1. United States
- 6.5.2. Canada
- 6.5.3. Mexico
- 6.5.4. Rest of North America
- 6.6. Market Analysis, Insights and Forecast - by Europe
- 6.6.1. United Kingdom
- 6.6.2. Germany
- 6.6.3. France
- 6.6.4. Russia
- 6.6.5. Italy
- 6.6.6. Spain
- 6.6.7. Rest of Europe
- 6.7. Market Analysis, Insights and Forecast - by Asia-Pacific
- 6.7.1. India
- 6.7.2. China
- 6.7.3. Japan
- 6.7.4. Australia
- 6.7.5. Rest of Asia-Pacific
- 6.8. Market Analysis, Insights and Forecast - by South America
- 6.8.1. Brazil
- 6.8.2. Argentina
- 6.8.3. Rest of South America
- 6.9. Market Analysis, Insights and Forecast - by Middle-East and Africa
- 6.9.1. United Arab Emirates
- 6.9.2. South Africa
- 6.9.3. Rest of Middle-East and Africa
- 6.1. Market Analysis, Insights and Forecast - by Service Type
- 7. North America Sustainable Catering Services Market Analysis, Insights and Forecast, 2021-2033
- 7.1. Market Analysis, Insights and Forecast - by Service Type
- 7.1.1. Contractual Catering Services
- 7.1.2. Non-Contractual Catering Services
- 7.1.3. Other Catering Services
- 7.2. Market Analysis, Insights and Forecast - by Event Type
- 7.2.1. Corporate
- 7.2.2. Wedding
- 7.2.3. Social Events
- 7.2.4. Others
- 7.3. Market Analysis, Insights and Forecast - by End-User
- 7.3.1. Individuals
- 7.3.2. Hospitality
- 7.3.3. Educational
- 7.3.4. Healthcare
- 7.3.5. In-Flight
- 7.3.6. Other End Users
- 7.4. Market Analysis, Insights and Forecast - by Geography
- 7.5. Market Analysis, Insights and Forecast - by North America
- 7.5.1. United States
- 7.5.2. Canada
- 7.5.3. Mexico
- 7.5.4. Rest of North America
- 7.6. Market Analysis, Insights and Forecast - by Europe
- 7.6.1. United Kingdom
- 7.6.2. Germany
- 7.6.3. France
- 7.6.4. Russia
- 7.6.5. Italy
- 7.6.6. Spain
- 7.6.7. Rest of Europe
- 7.7. Market Analysis, Insights and Forecast - by Asia-Pacific
- 7.7.1. India
- 7.7.2. China
- 7.7.3. Japan
- 7.7.4. Australia
- 7.7.5. Rest of Asia-Pacific
- 7.8. Market Analysis, Insights and Forecast - by South America
- 7.8.1. Brazil
- 7.8.2. Argentina
- 7.8.3. Rest of South America
- 7.9. Market Analysis, Insights and Forecast - by Middle-East and Africa
- 7.9.1. United Arab Emirates
- 7.9.2. South Africa
- 7.9.3. Rest of Middle-East and Africa
- 7.1. Market Analysis, Insights and Forecast - by Service Type
- 8. South America Sustainable Catering Services Market Analysis, Insights and Forecast, 2021-2033
- 8.1. Market Analysis, Insights and Forecast - by Service Type
- 8.1.1. Contractual Catering Services
- 8.1.2. Non-Contractual Catering Services
- 8.1.3. Other Catering Services
- 8.2. Market Analysis, Insights and Forecast - by Event Type
- 8.2.1. Corporate
- 8.2.2. Wedding
- 8.2.3. Social Events
- 8.2.4. Others
- 8.3. Market Analysis, Insights and Forecast - by End-User
- 8.3.1. Individuals
- 8.3.2. Hospitality
- 8.3.3. Educational
- 8.3.4. Healthcare
- 8.3.5. In-Flight
- 8.3.6. Other End Users
- 8.4. Market Analysis, Insights and Forecast - by Geography
- 8.5. Market Analysis, Insights and Forecast - by North America
- 8.5.1. United States
- 8.5.2. Canada
- 8.5.3. Mexico
- 8.5.4. Rest of North America
- 8.6. Market Analysis, Insights and Forecast - by Europe
- 8.6.1. United Kingdom
- 8.6.2. Germany
- 8.6.3. France
- 8.6.4. Russia
- 8.6.5. Italy
- 8.6.6. Spain
- 8.6.7. Rest of Europe
- 8.7. Market Analysis, Insights and Forecast - by Asia-Pacific
- 8.7.1. India
- 8.7.2. China
- 8.7.3. Japan
- 8.7.4. Australia
- 8.7.5. Rest of Asia-Pacific
- 8.8. Market Analysis, Insights and Forecast - by South America
- 8.8.1. Brazil
- 8.8.2. Argentina
- 8.8.3. Rest of South America
- 8.9. Market Analysis, Insights and Forecast - by Middle-East and Africa
- 8.9.1. United Arab Emirates
- 8.9.2. South Africa
- 8.9.3. Rest of Middle-East and Africa
- 8.1. Market Analysis, Insights and Forecast - by Service Type
- 9. Europe Sustainable Catering Services Market Analysis, Insights and Forecast, 2021-2033
- 9.1. Market Analysis, Insights and Forecast - by Service Type
- 9.1.1. Contractual Catering Services
- 9.1.2. Non-Contractual Catering Services
- 9.1.3. Other Catering Services
- 9.2. Market Analysis, Insights and Forecast - by Event Type
- 9.2.1. Corporate
- 9.2.2. Wedding
- 9.2.3. Social Events
- 9.2.4. Others
- 9.3. Market Analysis, Insights and Forecast - by End-User
- 9.3.1. Individuals
- 9.3.2. Hospitality
- 9.3.3. Educational
- 9.3.4. Healthcare
- 9.3.5. In-Flight
- 9.3.6. Other End Users
- 9.4. Market Analysis, Insights and Forecast - by Geography
- 9.5. Market Analysis, Insights and Forecast - by North America
- 9.5.1. United States
- 9.5.2. Canada
- 9.5.3. Mexico
- 9.5.4. Rest of North America
- 9.6. Market Analysis, Insights and Forecast - by Europe
- 9.6.1. United Kingdom
- 9.6.2. Germany
- 9.6.3. France
- 9.6.4. Russia
- 9.6.5. Italy
- 9.6.6. Spain
- 9.6.7. Rest of Europe
- 9.7. Market Analysis, Insights and Forecast - by Asia-Pacific
- 9.7.1. India
- 9.7.2. China
- 9.7.3. Japan
- 9.7.4. Australia
- 9.7.5. Rest of Asia-Pacific
- 9.8. Market Analysis, Insights and Forecast - by South America
- 9.8.1. Brazil
- 9.8.2. Argentina
- 9.8.3. Rest of South America
- 9.9. Market Analysis, Insights and Forecast - by Middle-East and Africa
- 9.9.1. United Arab Emirates
- 9.9.2. South Africa
- 9.9.3. Rest of Middle-East and Africa
- 9.1. Market Analysis, Insights and Forecast - by Service Type
- 10. Middle East & Africa Sustainable Catering Services Market Analysis, Insights and Forecast, 2021-2033
- 10.1. Market Analysis, Insights and Forecast - by Service Type
- 10.1.1. Contractual Catering Services
- 10.1.2. Non-Contractual Catering Services
- 10.1.3. Other Catering Services
- 10.2. Market Analysis, Insights and Forecast - by Event Type
- 10.2.1. Corporate
- 10.2.2. Wedding
- 10.2.3. Social Events
- 10.2.4. Others
- 10.3. Market Analysis, Insights and Forecast - by End-User
- 10.3.1. Individuals
- 10.3.2. Hospitality
- 10.3.3. Educational
- 10.3.4. Healthcare
- 10.3.5. In-Flight
- 10.3.6. Other End Users
- 10.4. Market Analysis, Insights and Forecast - by Geography
- 10.5. Market Analysis, Insights and Forecast - by North America
- 10.5.1. United States
- 10.5.2. Canada
- 10.5.3. Mexico
- 10.5.4. Rest of North America
- 10.6. Market Analysis, Insights and Forecast - by Europe
- 10.6.1. United Kingdom
- 10.6.2. Germany
- 10.6.3. France
- 10.6.4. Russia
- 10.6.5. Italy
- 10.6.6. Spain
- 10.6.7. Rest of Europe
- 10.7. Market Analysis, Insights and Forecast - by Asia-Pacific
- 10.7.1. India
- 10.7.2. China
- 10.7.3. Japan
- 10.7.4. Australia
- 10.7.5. Rest of Asia-Pacific
- 10.8. Market Analysis, Insights and Forecast - by South America
- 10.8.1. Brazil
- 10.8.2. Argentina
- 10.8.3. Rest of South America
- 10.9. Market Analysis, Insights and Forecast - by Middle-East and Africa
- 10.9.1. United Arab Emirates
- 10.9.2. South Africa
- 10.9.3. Rest of Middle-East and Africa
- 10.1. Market Analysis, Insights and Forecast - by Service Type
- 11. Asia Pacific Sustainable Catering Services Market Analysis, Insights and Forecast, 2021-2033
- 11.1. Market Analysis, Insights and Forecast - by Service Type
- 11.1.1. Contractual Catering Services
- 11.1.2. Non-Contractual Catering Services
- 11.1.3. Other Catering Services
- 11.2. Market Analysis, Insights and Forecast - by Event Type
- 11.2.1. Corporate
- 11.2.2. Wedding
- 11.2.3. Social Events
- 11.2.4. Others
- 11.3. Market Analysis, Insights and Forecast - by End-User
- 11.3.1. Individuals
- 11.3.2. Hospitality
- 11.3.3. Educational
- 11.3.4. Healthcare
- 11.3.5. In-Flight
- 11.3.6. Other End Users
- 11.4. Market Analysis, Insights and Forecast - by Geography
- 11.5. Market Analysis, Insights and Forecast - by North America
- 11.5.1. United States
- 11.5.2. Canada
- 11.5.3. Mexico
- 11.5.4. Rest of North America
- 11.6. Market Analysis, Insights and Forecast - by Europe
- 11.6.1. United Kingdom
- 11.6.2. Germany
- 11.6.3. France
- 11.6.4. Russia
- 11.6.5. Italy
- 11.6.6. Spain
- 11.6.7. Rest of Europe
- 11.7. Market Analysis, Insights and Forecast - by Asia-Pacific
- 11.7.1. India
- 11.7.2. China
- 11.7.3. Japan
- 11.7.4. Australia
- 11.7.5. Rest of Asia-Pacific
- 11.8. Market Analysis, Insights and Forecast - by South America
- 11.8.1. Brazil
- 11.8.2. Argentina
- 11.8.3. Rest of South America
- 11.9. Market Analysis, Insights and Forecast - by Middle-East and Africa
- 11.9.1. United Arab Emirates
- 11.9.2. South Africa
- 11.9.3. Rest of Middle-East and Africa
- 11.1. Market Analysis, Insights and Forecast - by Service Type
- 12. Competitive Analysis
- 12.1. Company Profiles
- 12.1.1 Dine Contract Catering**List Not Exhaustive
- 12.1.1.1. Company Overview
- 12.1.1.2. Products
- 12.1.1.3. Company Financials
- 12.1.1.4. SWOT Analysis
- 12.1.2 Aramark Corp
- 12.1.2.1. Company Overview
- 12.1.2.2. Products
- 12.1.2.3. Company Financials
- 12.1.2.4. SWOT Analysis
- 12.1.3 Emirates Flight Catering
- 12.1.3.1. Company Overview
- 12.1.3.2. Products
- 12.1.3.3. Company Financials
- 12.1.3.4. SWOT Analysis
- 12.1.4 Bartlett Mitchell Ltd
- 12.1.4.1. Company Overview
- 12.1.4.2. Products
- 12.1.4.3. Company Financials
- 12.1.4.4. SWOT Analysis
- 12.1.5 ISS A/S
- 12.1.5.1. Company Overview
- 12.1.5.2. Products
- 12.1.5.3. Company Financials
- 12.1.5.4. SWOT Analysis
- 12.1.6 Elior Group
- 12.1.6.1. Company Overview
- 12.1.6.2. Products
- 12.1.6.3. Company Financials
- 12.1.6.4. SWOT Analysis
- 12.1.7 Entier Limited
- 12.1.7.1. Company Overview
- 12.1.7.2. Products
- 12.1.7.3. Company Financials
- 12.1.7.4. SWOT Analysis
- 12.1.8 Compass Group PLC
- 12.1.8.1. Company Overview
- 12.1.8.2. Products
- 12.1.8.3. Company Financials
- 12.1.8.4. SWOT Analysis
- 12.1.9 DO & CO Aktiengesellschaft
- 12.1.9.1. Company Overview
- 12.1.9.2. Products
- 12.1.9.3. Company Financials
- 12.1.9.4. SWOT Analysis
- 12.1.10 CH and Co Catering Group Ltd
- 12.1.10.1. Company Overview
- 12.1.10.2. Products
- 12.1.10.3. Company Financials
- 12.1.10.4. SWOT Analysis
- 12.1.1 Dine Contract Catering**List Not Exhaustive
- 12.2. Market Entropy
- 12.2.1 Company's Key Areas Served
- 12.2.2 Recent Developments
- 12.3. Company Market Share Analysis 2025
- 12.3.1 Top 5 Companies Market Share Analysis
- 12.3.2 Top 3 Companies Market Share Analysis
- 12.4. List of Potential Customers
- 13. Research Methodology
List of Figures
- Figure 1: Global Sustainable Catering Services Market Revenue Breakdown (Million, %) by Region 2025 & 2033
- Figure 2: North America Sustainable Catering Services Market Revenue (Million), by Service Type 2025 & 2033
- Figure 3: North America Sustainable Catering Services Market Revenue Share (%), by Service Type 2025 & 2033
- Figure 4: North America Sustainable Catering Services Market Revenue (Million), by Event Type 2025 & 2033
- Figure 5: North America Sustainable Catering Services Market Revenue Share (%), by Event Type 2025 & 2033
- Figure 6: North America Sustainable Catering Services Market Revenue (Million), by End-User 2025 & 2033
- Figure 7: North America Sustainable Catering Services Market Revenue Share (%), by End-User 2025 & 2033
- Figure 8: North America Sustainable Catering Services Market Revenue (Million), by Geography 2025 & 2033
- Figure 9: North America Sustainable Catering Services Market Revenue Share (%), by Geography 2025 & 2033
- Figure 10: North America Sustainable Catering Services Market Revenue (Million), by North America 2025 & 2033
- Figure 11: North America Sustainable Catering Services Market Revenue Share (%), by North America 2025 & 2033
- Figure 12: North America Sustainable Catering Services Market Revenue (Million), by Europe 2025 & 2033
- Figure 13: North America Sustainable Catering Services Market Revenue Share (%), by Europe 2025 & 2033
- Figure 14: North America Sustainable Catering Services Market Revenue (Million), by Asia-Pacific 2025 & 2033
- Figure 15: North America Sustainable Catering Services Market Revenue Share (%), by Asia-Pacific 2025 & 2033
- Figure 16: North America Sustainable Catering Services Market Revenue (Million), by South America 2025 & 2033
- Figure 17: North America Sustainable Catering Services Market Revenue Share (%), by South America 2025 & 2033
- Figure 18: North America Sustainable Catering Services Market Revenue (Million), by Middle-East and Africa 2025 & 2033
- Figure 19: North America Sustainable Catering Services Market Revenue Share (%), by Middle-East and Africa 2025 & 2033
- Figure 20: North America Sustainable Catering Services Market Revenue (Million), by Country 2025 & 2033
- Figure 21: North America Sustainable Catering Services Market Revenue Share (%), by Country 2025 & 2033
- Figure 22: South America Sustainable Catering Services Market Revenue (Million), by Service Type 2025 & 2033
- Figure 23: South America Sustainable Catering Services Market Revenue Share (%), by Service Type 2025 & 2033
- Figure 24: South America Sustainable Catering Services Market Revenue (Million), by Event Type 2025 & 2033
- Figure 25: South America Sustainable Catering Services Market Revenue Share (%), by Event Type 2025 & 2033
- Figure 26: South America Sustainable Catering Services Market Revenue (Million), by End-User 2025 & 2033
- Figure 27: South America Sustainable Catering Services Market Revenue Share (%), by End-User 2025 & 2033
- Figure 28: South America Sustainable Catering Services Market Revenue (Million), by Geography 2025 & 2033
- Figure 29: South America Sustainable Catering Services Market Revenue Share (%), by Geography 2025 & 2033
- Figure 30: South America Sustainable Catering Services Market Revenue (Million), by North America 2025 & 2033
- Figure 31: South America Sustainable Catering Services Market Revenue Share (%), by North America 2025 & 2033
- Figure 32: South America Sustainable Catering Services Market Revenue (Million), by Europe 2025 & 2033
- Figure 33: South America Sustainable Catering Services Market Revenue Share (%), by Europe 2025 & 2033
- Figure 34: South America Sustainable Catering Services Market Revenue (Million), by Asia-Pacific 2025 & 2033
- Figure 35: South America Sustainable Catering Services Market Revenue Share (%), by Asia-Pacific 2025 & 2033
- Figure 36: South America Sustainable Catering Services Market Revenue (Million), by South America 2025 & 2033
- Figure 37: South America Sustainable Catering Services Market Revenue Share (%), by South America 2025 & 2033
- Figure 38: South America Sustainable Catering Services Market Revenue (Million), by Middle-East and Africa 2025 & 2033
- Figure 39: South America Sustainable Catering Services Market Revenue Share (%), by Middle-East and Africa 2025 & 2033
- Figure 40: South America Sustainable Catering Services Market Revenue (Million), by Country 2025 & 2033
- Figure 41: South America Sustainable Catering Services Market Revenue Share (%), by Country 2025 & 2033
- Figure 42: Europe Sustainable Catering Services Market Revenue (Million), by Service Type 2025 & 2033
- Figure 43: Europe Sustainable Catering Services Market Revenue Share (%), by Service Type 2025 & 2033
- Figure 44: Europe Sustainable Catering Services Market Revenue (Million), by Event Type 2025 & 2033
- Figure 45: Europe Sustainable Catering Services Market Revenue Share (%), by Event Type 2025 & 2033
- Figure 46: Europe Sustainable Catering Services Market Revenue (Million), by End-User 2025 & 2033
- Figure 47: Europe Sustainable Catering Services Market Revenue Share (%), by End-User 2025 & 2033
- Figure 48: Europe Sustainable Catering Services Market Revenue (Million), by Geography 2025 & 2033
- Figure 49: Europe Sustainable Catering Services Market Revenue Share (%), by Geography 2025 & 2033
- Figure 50: Europe Sustainable Catering Services Market Revenue (Million), by North America 2025 & 2033
- Figure 51: Europe Sustainable Catering Services Market Revenue Share (%), by North America 2025 & 2033
- Figure 52: Europe Sustainable Catering Services Market Revenue (Million), by Europe 2025 & 2033
- Figure 53: Europe Sustainable Catering Services Market Revenue Share (%), by Europe 2025 & 2033
- Figure 54: Europe Sustainable Catering Services Market Revenue (Million), by Asia-Pacific 2025 & 2033
- Figure 55: Europe Sustainable Catering Services Market Revenue Share (%), by Asia-Pacific 2025 & 2033
- Figure 56: Europe Sustainable Catering Services Market Revenue (Million), by South America 2025 & 2033
- Figure 57: Europe Sustainable Catering Services Market Revenue Share (%), by South America 2025 & 2033
- Figure 58: Europe Sustainable Catering Services Market Revenue (Million), by Middle-East and Africa 2025 & 2033
- Figure 59: Europe Sustainable Catering Services Market Revenue Share (%), by Middle-East and Africa 2025 & 2033
- Figure 60: Europe Sustainable Catering Services Market Revenue (Million), by Country 2025 & 2033
- Figure 61: Europe Sustainable Catering Services Market Revenue Share (%), by Country 2025 & 2033
- Figure 62: Middle East & Africa Sustainable Catering Services Market Revenue (Million), by Service Type 2025 & 2033
- Figure 63: Middle East & Africa Sustainable Catering Services Market Revenue Share (%), by Service Type 2025 & 2033
- Figure 64: Middle East & Africa Sustainable Catering Services Market Revenue (Million), by Event Type 2025 & 2033
- Figure 65: Middle East & Africa Sustainable Catering Services Market Revenue Share (%), by Event Type 2025 & 2033
- Figure 66: Middle East & Africa Sustainable Catering Services Market Revenue (Million), by End-User 2025 & 2033
- Figure 67: Middle East & Africa Sustainable Catering Services Market Revenue Share (%), by End-User 2025 & 2033
- Figure 68: Middle East & Africa Sustainable Catering Services Market Revenue (Million), by Geography 2025 & 2033
- Figure 69: Middle East & Africa Sustainable Catering Services Market Revenue Share (%), by Geography 2025 & 2033
- Figure 70: Middle East & Africa Sustainable Catering Services Market Revenue (Million), by North America 2025 & 2033
- Figure 71: Middle East & Africa Sustainable Catering Services Market Revenue Share (%), by North America 2025 & 2033
- Figure 72: Middle East & Africa Sustainable Catering Services Market Revenue (Million), by Europe 2025 & 2033
- Figure 73: Middle East & Africa Sustainable Catering Services Market Revenue Share (%), by Europe 2025 & 2033
- Figure 74: Middle East & Africa Sustainable Catering Services Market Revenue (Million), by Asia-Pacific 2025 & 2033
- Figure 75: Middle East & Africa Sustainable Catering Services Market Revenue Share (%), by Asia-Pacific 2025 & 2033
- Figure 76: Middle East & Africa Sustainable Catering Services Market Revenue (Million), by South America 2025 & 2033
- Figure 77: Middle East & Africa Sustainable Catering Services Market Revenue Share (%), by South America 2025 & 2033
- Figure 78: Middle East & Africa Sustainable Catering Services Market Revenue (Million), by Middle-East and Africa 2025 & 2033
- Figure 79: Middle East & Africa Sustainable Catering Services Market Revenue Share (%), by Middle-East and Africa 2025 & 2033
- Figure 80: Middle East & Africa Sustainable Catering Services Market Revenue (Million), by Country 2025 & 2033
- Figure 81: Middle East & Africa Sustainable Catering Services Market Revenue Share (%), by Country 2025 & 2033
- Figure 82: Asia Pacific Sustainable Catering Services Market Revenue (Million), by Service Type 2025 & 2033
- Figure 83: Asia Pacific Sustainable Catering Services Market Revenue Share (%), by Service Type 2025 & 2033
- Figure 84: Asia Pacific Sustainable Catering Services Market Revenue (Million), by Event Type 2025 & 2033
- Figure 85: Asia Pacific Sustainable Catering Services Market Revenue Share (%), by Event Type 2025 & 2033
- Figure 86: Asia Pacific Sustainable Catering Services Market Revenue (Million), by End-User 2025 & 2033
- Figure 87: Asia Pacific Sustainable Catering Services Market Revenue Share (%), by End-User 2025 & 2033
- Figure 88: Asia Pacific Sustainable Catering Services Market Revenue (Million), by Geography 2025 & 2033
- Figure 89: Asia Pacific Sustainable Catering Services Market Revenue Share (%), by Geography 2025 & 2033
- Figure 90: Asia Pacific Sustainable Catering Services Market Revenue (Million), by North America 2025 & 2033
- Figure 91: Asia Pacific Sustainable Catering Services Market Revenue Share (%), by North America 2025 & 2033
- Figure 92: Asia Pacific Sustainable Catering Services Market Revenue (Million), by Europe 2025 & 2033
- Figure 93: Asia Pacific Sustainable Catering Services Market Revenue Share (%), by Europe 2025 & 2033
- Figure 94: Asia Pacific Sustainable Catering Services Market Revenue (Million), by Asia-Pacific 2025 & 2033
- Figure 95: Asia Pacific Sustainable Catering Services Market Revenue Share (%), by Asia-Pacific 2025 & 2033
- Figure 96: Asia Pacific Sustainable Catering Services Market Revenue (Million), by South America 2025 & 2033
- Figure 97: Asia Pacific Sustainable Catering Services Market Revenue Share (%), by South America 2025 & 2033
- Figure 98: Asia Pacific Sustainable Catering Services Market Revenue (Million), by Middle-East and Africa 2025 & 2033
- Figure 99: Asia Pacific Sustainable Catering Services Market Revenue Share (%), by Middle-East and Africa 2025 & 2033
- Figure 100: Asia Pacific Sustainable Catering Services Market Revenue (Million), by Country 2025 & 2033
- Figure 101: Asia Pacific Sustainable Catering Services Market Revenue Share (%), by Country 2025 & 2033
List of Tables
- Table 1: Global Sustainable Catering Services Market Revenue Million Forecast, by Service Type 2020 & 2033
- Table 2: Global Sustainable Catering Services Market Revenue Million Forecast, by Event Type 2020 & 2033
- Table 3: Global Sustainable Catering Services Market Revenue Million Forecast, by End-User 2020 & 2033
- Table 4: Global Sustainable Catering Services Market Revenue Million Forecast, by Geography 2020 & 2033
- Table 5: Global Sustainable Catering Services Market Revenue Million Forecast, by North America 2020 & 2033
- Table 6: Global Sustainable Catering Services Market Revenue Million Forecast, by Europe 2020 & 2033
- Table 7: Global Sustainable Catering Services Market Revenue Million Forecast, by Asia-Pacific 2020 & 2033
- Table 8: Global Sustainable Catering Services Market Revenue Million Forecast, by South America 2020 & 2033
- Table 9: Global Sustainable Catering Services Market Revenue Million Forecast, by Middle-East and Africa 2020 & 2033
- Table 10: Global Sustainable Catering Services Market Revenue Million Forecast, by Region 2020 & 2033
- Table 11: Global Sustainable Catering Services Market Revenue Million Forecast, by Service Type 2020 & 2033
- Table 12: Global Sustainable Catering Services Market Revenue Million Forecast, by Event Type 2020 & 2033
- Table 13: Global Sustainable Catering Services Market Revenue Million Forecast, by End-User 2020 & 2033
- Table 14: Global Sustainable Catering Services Market Revenue Million Forecast, by Geography 2020 & 2033
- Table 15: Global Sustainable Catering Services Market Revenue Million Forecast, by North America 2020 & 2033
- Table 16: Global Sustainable Catering Services Market Revenue Million Forecast, by Europe 2020 & 2033
- Table 17: Global Sustainable Catering Services Market Revenue Million Forecast, by Asia-Pacific 2020 & 2033
- Table 18: Global Sustainable Catering Services Market Revenue Million Forecast, by South America 2020 & 2033
- Table 19: Global Sustainable Catering Services Market Revenue Million Forecast, by Middle-East and Africa 2020 & 2033
- Table 20: Global Sustainable Catering Services Market Revenue Million Forecast, by Country 2020 & 2033
- Table 21: United States Sustainable Catering Services Market Revenue (Million) Forecast, by Application 2020 & 2033
- Table 22: Canada Sustainable Catering Services Market Revenue (Million) Forecast, by Application 2020 & 2033
- Table 23: Mexico Sustainable Catering Services Market Revenue (Million) Forecast, by Application 2020 & 2033
- Table 24: Global Sustainable Catering Services Market Revenue Million Forecast, by Service Type 2020 & 2033
- Table 25: Global Sustainable Catering Services Market Revenue Million Forecast, by Event Type 2020 & 2033
- Table 26: Global Sustainable Catering Services Market Revenue Million Forecast, by End-User 2020 & 2033
- Table 27: Global Sustainable Catering Services Market Revenue Million Forecast, by Geography 2020 & 2033
- Table 28: Global Sustainable Catering Services Market Revenue Million Forecast, by North America 2020 & 2033
- Table 29: Global Sustainable Catering Services Market Revenue Million Forecast, by Europe 2020 & 2033
- Table 30: Global Sustainable Catering Services Market Revenue Million Forecast, by Asia-Pacific 2020 & 2033
- Table 31: Global Sustainable Catering Services Market Revenue Million Forecast, by South America 2020 & 2033
- Table 32: Global Sustainable Catering Services Market Revenue Million Forecast, by Middle-East and Africa 2020 & 2033
- Table 33: Global Sustainable Catering Services Market Revenue Million Forecast, by Country 2020 & 2033
- Table 34: Brazil Sustainable Catering Services Market Revenue (Million) Forecast, by Application 2020 & 2033
- Table 35: Argentina Sustainable Catering Services Market Revenue (Million) Forecast, by Application 2020 & 2033
- Table 36: Rest of South America Sustainable Catering Services Market Revenue (Million) Forecast, by Application 2020 & 2033
- Table 37: Global Sustainable Catering Services Market Revenue Million Forecast, by Service Type 2020 & 2033
- Table 38: Global Sustainable Catering Services Market Revenue Million Forecast, by Event Type 2020 & 2033
- Table 39: Global Sustainable Catering Services Market Revenue Million Forecast, by End-User 2020 & 2033
- Table 40: Global Sustainable Catering Services Market Revenue Million Forecast, by Geography 2020 & 2033
- Table 41: Global Sustainable Catering Services Market Revenue Million Forecast, by North America 2020 & 2033
- Table 42: Global Sustainable Catering Services Market Revenue Million Forecast, by Europe 2020 & 2033
- Table 43: Global Sustainable Catering Services Market Revenue Million Forecast, by Asia-Pacific 2020 & 2033
- Table 44: Global Sustainable Catering Services Market Revenue Million Forecast, by South America 2020 & 2033
- Table 45: Global Sustainable Catering Services Market Revenue Million Forecast, by Middle-East and Africa 2020 & 2033
- Table 46: Global Sustainable Catering Services Market Revenue Million Forecast, by Country 2020 & 2033
- Table 47: United Kingdom Sustainable Catering Services Market Revenue (Million) Forecast, by Application 2020 & 2033
- Table 48: Germany Sustainable Catering Services Market Revenue (Million) Forecast, by Application 2020 & 2033
- Table 49: France Sustainable Catering Services Market Revenue (Million) Forecast, by Application 2020 & 2033
- Table 50: Italy Sustainable Catering Services Market Revenue (Million) Forecast, by Application 2020 & 2033
- Table 51: Spain Sustainable Catering Services Market Revenue (Million) Forecast, by Application 2020 & 2033
- Table 52: Russia Sustainable Catering Services Market Revenue (Million) Forecast, by Application 2020 & 2033
- Table 53: Benelux Sustainable Catering Services Market Revenue (Million) Forecast, by Application 2020 & 2033
- Table 54: Nordics Sustainable Catering Services Market Revenue (Million) Forecast, by Application 2020 & 2033
- Table 55: Rest of Europe Sustainable Catering Services Market Revenue (Million) Forecast, by Application 2020 & 2033
- Table 56: Global Sustainable Catering Services Market Revenue Million Forecast, by Service Type 2020 & 2033
- Table 57: Global Sustainable Catering Services Market Revenue Million Forecast, by Event Type 2020 & 2033
- Table 58: Global Sustainable Catering Services Market Revenue Million Forecast, by End-User 2020 & 2033
- Table 59: Global Sustainable Catering Services Market Revenue Million Forecast, by Geography 2020 & 2033
- Table 60: Global Sustainable Catering Services Market Revenue Million Forecast, by North America 2020 & 2033
- Table 61: Global Sustainable Catering Services Market Revenue Million Forecast, by Europe 2020 & 2033
- Table 62: Global Sustainable Catering Services Market Revenue Million Forecast, by Asia-Pacific 2020 & 2033
- Table 63: Global Sustainable Catering Services Market Revenue Million Forecast, by South America 2020 & 2033
- Table 64: Global Sustainable Catering Services Market Revenue Million Forecast, by Middle-East and Africa 2020 & 2033
- Table 65: Global Sustainable Catering Services Market Revenue Million Forecast, by Country 2020 & 2033
- Table 66: Turkey Sustainable Catering Services Market Revenue (Million) Forecast, by Application 2020 & 2033
- Table 67: Israel Sustainable Catering Services Market Revenue (Million) Forecast, by Application 2020 & 2033
- Table 68: GCC Sustainable Catering Services Market Revenue (Million) Forecast, by Application 2020 & 2033
- Table 69: North Africa Sustainable Catering Services Market Revenue (Million) Forecast, by Application 2020 & 2033
- Table 70: South Africa Sustainable Catering Services Market Revenue (Million) Forecast, by Application 2020 & 2033
- Table 71: Rest of Middle East & Africa Sustainable Catering Services Market Revenue (Million) Forecast, by Application 2020 & 2033
- Table 72: Global Sustainable Catering Services Market Revenue Million Forecast, by Service Type 2020 & 2033
- Table 73: Global Sustainable Catering Services Market Revenue Million Forecast, by Event Type 2020 & 2033
- Table 74: Global Sustainable Catering Services Market Revenue Million Forecast, by End-User 2020 & 2033
- Table 75: Global Sustainable Catering Services Market Revenue Million Forecast, by Geography 2020 & 2033
- Table 76: Global Sustainable Catering Services Market Revenue Million Forecast, by North America 2020 & 2033
- Table 77: Global Sustainable Catering Services Market Revenue Million Forecast, by Europe 2020 & 2033
- Table 78: Global Sustainable Catering Services Market Revenue Million Forecast, by Asia-Pacific 2020 & 2033
- Table 79: Global Sustainable Catering Services Market Revenue Million Forecast, by South America 2020 & 2033
- Table 80: Global Sustainable Catering Services Market Revenue Million Forecast, by Middle-East and Africa 2020 & 2033
- Table 81: Global Sustainable Catering Services Market Revenue Million Forecast, by Country 2020 & 2033
- Table 82: China Sustainable Catering Services Market Revenue (Million) Forecast, by Application 2020 & 2033
- Table 83: India Sustainable Catering Services Market Revenue (Million) Forecast, by Application 2020 & 2033
- Table 84: Japan Sustainable Catering Services Market Revenue (Million) Forecast, by Application 2020 & 2033
- Table 85: South Korea Sustainable Catering Services Market Revenue (Million) Forecast, by Application 2020 & 2033
- Table 86: ASEAN Sustainable Catering Services Market Revenue (Million) Forecast, by Application 2020 & 2033
- Table 87: Oceania Sustainable Catering Services Market Revenue (Million) Forecast, by Application 2020 & 2033
- Table 88: Rest of Asia Pacific Sustainable Catering Services Market Revenue (Million) Forecast, by Application 2020 & 2033
Frequently Asked Questions
1. What is the projected Compound Annual Growth Rate (CAGR) of the Sustainable Catering Services Market?
The projected CAGR is approximately 2.33%.
2. Which companies are prominent players in the Sustainable Catering Services Market?
Key companies in the market include Dine Contract Catering**List Not Exhaustive, Aramark Corp, Emirates Flight Catering, Bartlett Mitchell Ltd, ISS A/S, Elior Group, Entier Limited, Compass Group PLC, DO & CO Aktiengesellschaft, CH and Co Catering Group Ltd.
3. What are the main segments of the Sustainable Catering Services Market?
The market segments include Service Type, Event Type, End-User, Geography, North America, Europe, Asia-Pacific, South America, Middle-East and Africa.
4. Can you provide details about the market size?
The market size is estimated to be USD 115.13 Million as of 2022.
5. What are some drivers contributing to market growth?
Increasing Trend of Outsourcing Food Services; Growing Popularity of Social Events.
6. What are the notable trends driving market growth?
Rise in Demand for Organic Food.
7. Are there any restraints impacting market growth?
Challenges in Sourcing Organic and Local Ingredients; Limited Consumer Awareness and Understanding of Sustainable Catering Practices.
8. Can you provide examples of recent developments in the market?
In January 2024, Compass Group PLC, a leading global food service company, acquired CH&CO, a premium contract and hospitality service provider in the UK and Ireland, for an initial enterprise value of GBP 475 Million (USD 600 Million).
9. What pricing options are available for accessing the report?
Pricing options include single-user, multi-user, and enterprise licenses priced at USD 3800, USD 4500, and USD 5800 respectively.
10. Is the market size provided in terms of value or volume?
The market size is provided in terms of value, measured in Million.
11. Are there any specific market keywords associated with the report?
Yes, the market keyword associated with the report is "Sustainable Catering Services Market," which aids in identifying and referencing the specific market segment covered.
12. How do I determine which pricing option suits my needs best?
The pricing options vary based on user requirements and access needs. Individual users may opt for single-user licenses, while businesses requiring broader access may choose multi-user or enterprise licenses for cost-effective access to the report.
13. Are there any additional resources or data provided in the Sustainable Catering Services Market report?
While the report offers comprehensive insights, it's advisable to review the specific contents or supplementary materials provided to ascertain if additional resources or data are available.
14. How can I stay updated on further developments or reports in the Sustainable Catering Services Market?
To stay informed about further developments, trends, and reports in the Sustainable Catering Services Market, consider subscribing to industry newsletters, following relevant companies and organizations, or regularly checking reputable industry news sources and publications.
Methodology
Step 1 - Identification of Relevant Samples Size from Population Database


Step 2 - Approaches for Defining Global Market Size (Value, Volume* & Price*)

Note*: In applicable scenarios
Step 3 - Data Sources
Primary Research
- Web Analytics
- Survey Reports
- Research Institute
- Latest Research Reports
- Opinion Leaders
Secondary Research
- Annual Reports
- White Paper
- Latest Press Release
- Industry Association
- Paid Database
- Investor Presentations

Step 4 - Data Triangulation
Involves using different sources of information in order to increase the validity of a study
These sources are likely to be stakeholders in a program - participants, other researchers, program staff, other community members, and so on.
Then we put all data in single framework & apply various statistical tools to find out the dynamic on the market.
During the analysis stage, feedback from the stakeholder groups would be compared to determine areas of agreement as well as areas of divergence