


Key Insights
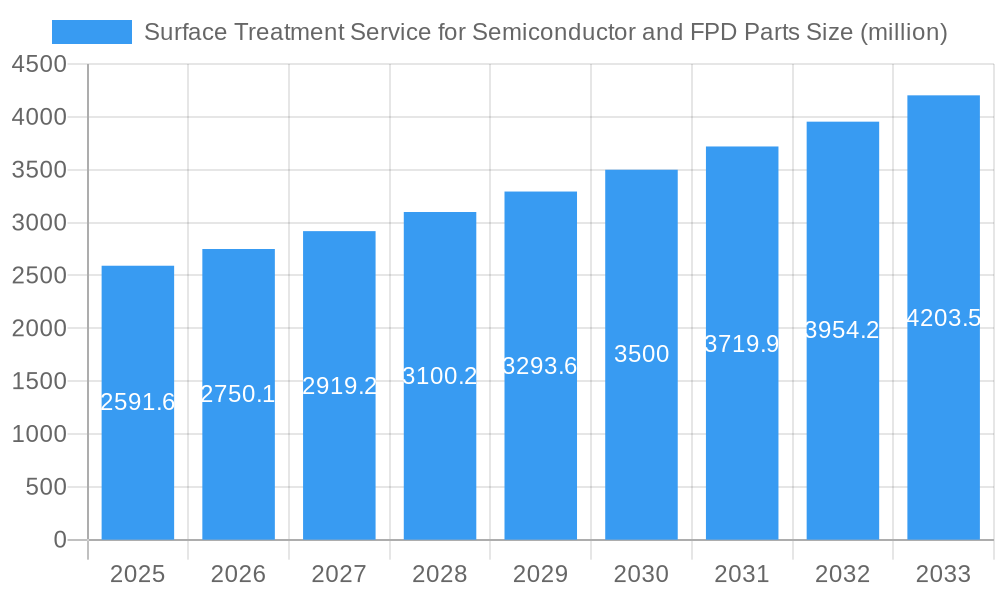
The global market for surface treatment services for semiconductor and FPD (flat panel display) parts is experiencing robust growth, projected to reach $2591.6 million in 2025, expanding at a compound annual growth rate (CAGR) of 5.9%. This growth is fueled by the increasing demand for advanced semiconductor and FPD technologies in various applications, including smartphones, computers, automobiles, and medical devices. Miniaturization and enhanced performance requirements necessitate sophisticated surface treatments to improve component reliability, durability, and efficiency. Key drivers include the rise of 5G and AI technologies, the expanding automotive electronics sector, and the continuous innovation in display technologies. The industry is witnessing trends towards advanced cleaning techniques, environmentally friendly materials, and increased automation to meet the stringent quality and productivity demands. Potential restraints include supply chain disruptions, fluctuations in raw material prices, and intense competition among numerous players. The market is segmented by treatment type (e.g., cleaning, coating, etching), application (e.g., wafers, substrates, packaging), and geographical region. Major players like UCT, Pentagon Technologies, and Mitsubishi Chemical (Cleanpart) are actively investing in research and development to enhance their product offerings and expand their market share.
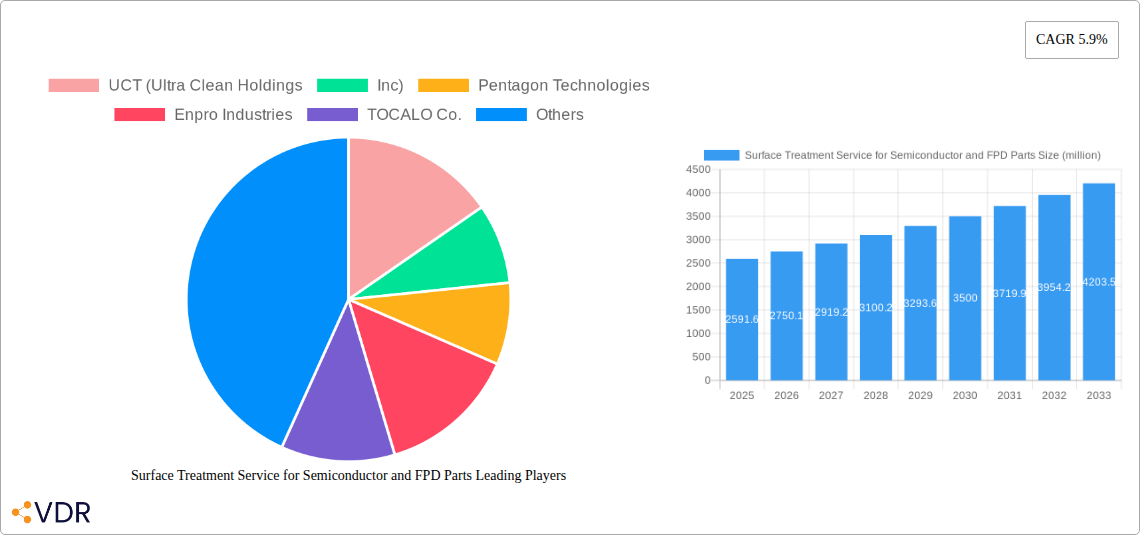
Surface Treatment Service for Semiconductor and FPD Parts Market Size (In Billion)

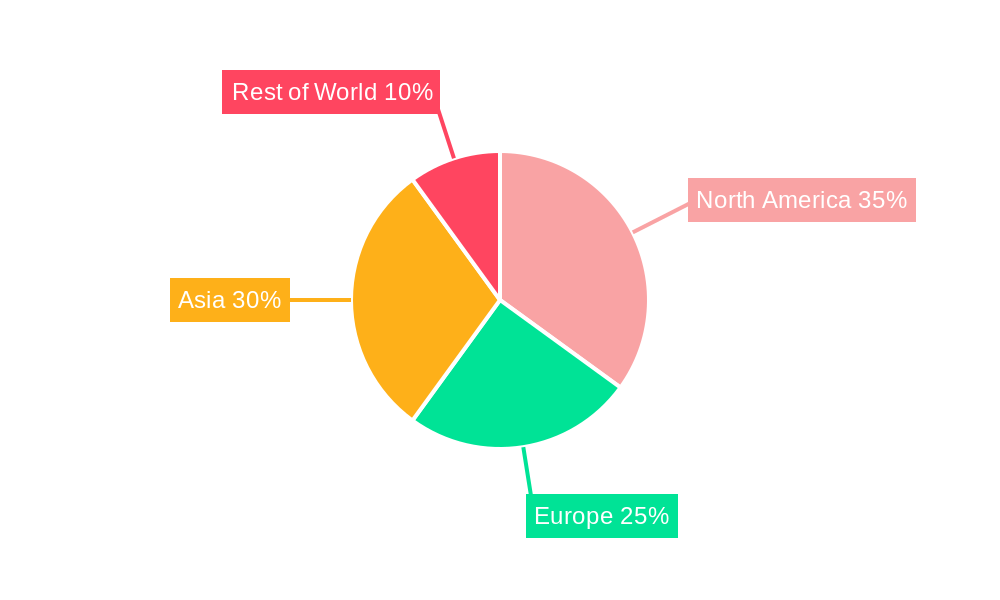
The competitive landscape is characterized by a mix of large multinational corporations and specialized regional players. The market's future trajectory hinges on continuous technological advancements and the evolving needs of the semiconductor and FPD industries. The adoption of Industry 4.0 principles and increasing focus on sustainable manufacturing practices will further shape the market's development. While precise regional breakdowns are unavailable, it's reasonable to anticipate strong growth in regions with significant semiconductor manufacturing hubs such as East Asia, North America, and Europe, reflecting their established technological infrastructure and robust demand. Furthermore, emerging economies will also show incremental growth given their increasing participation in the global electronics manufacturing ecosystem. This comprehensive approach to understanding the market dynamics promises to provide valuable insights for stakeholders across the industry value chain.
Surface Treatment Service for Semiconductor and FPD Parts Company Market Share
Surface Treatment Service for Semiconductor and FPD Parts Market Report: 2019-2033
This comprehensive report provides an in-depth analysis of the global surface treatment service market for semiconductor and FPD (Flat Panel Display) parts, offering invaluable insights for industry professionals, investors, and strategists. The study covers the period from 2019 to 2033, with a focus on the forecast period from 2025 to 2033 and a base year of 2025. The market is segmented by various factors, providing a granular understanding of growth drivers and challenges across different regions and application areas. The report incorporates data from key players, including UCT (Ultra Clean Holdings, Inc.), Pentagon Technologies, Enpro Industries, and others, to provide a holistic view of the market landscape. The total market size in 2025 is estimated at xx million USD, with a projected CAGR of xx% during the forecast period.
Surface Treatment Service for Semiconductor and FPD Parts Market Dynamics & Structure
This section analyzes the market's competitive landscape, technological advancements, and regulatory influences shaping its trajectory. The market is characterized by a moderately concentrated structure with a few dominant players and a large number of smaller niche players. Technological innovation, driven by the increasing demand for higher performance and miniaturization in semiconductors and FPDs, is a key growth driver. Stringent regulatory frameworks related to environmental concerns and material safety impose considerable challenges and opportunities for market players. The emergence of advanced surface treatment technologies, such as atomic layer deposition (ALD) and chemical mechanical planarization (CMP), is reshaping the competitive landscape. M&A activity has been relatively moderate in recent years, but an increase in consolidation within the industry is anticipated during the forecast period.
- Market Concentration: Moderately concentrated, with the top 5 players holding an estimated xx% market share in 2025.
- Technological Innovation: Key drivers include ALD, CMP, and plasma etching advancements.
- Regulatory Framework: Stringent environmental and safety regulations impact operational costs and innovation.
- Competitive Substitutes: Limited direct substitutes, but alternative processing techniques pose indirect competition.
- End-User Demographics: Primarily focused on semiconductor and FPD manufacturers, with growing demand from other electronics sectors.
- M&A Trends: Moderate activity historically, with an anticipated increase in consolidation in the coming years. xx M&A deals projected between 2025 and 2033.
Surface Treatment Service for Semiconductor and FPD Parts Growth Trends & Insights
The global surface treatment services market for semiconductor and FPD parts has witnessed significant growth over the past few years, driven by factors such as increasing demand for advanced electronics and technological advancements in semiconductor manufacturing. Market size evolution shows a steady upward trend, with the market valued at xx million USD in 2019 and xx million USD in 2024. This growth is largely attributed to the rising adoption of sophisticated surface treatment techniques to enhance the performance and reliability of semiconductor and FPD components. The market is also experiencing technological disruptions due to the development and adoption of new materials and processes. Changes in consumer behavior, particularly the increased demand for high-performance electronics, are driving the need for advanced surface treatments. The market is expected to continue its growth trajectory in the forecast period, driven by technological innovations and an increase in demand from emerging markets. The CAGR is projected to be xx% from 2025 to 2033, reaching a market value of xx million USD by 2033. Market penetration in emerging economies is a key factor in future growth.
Dominant Regions, Countries, or Segments in Surface Treatment Service for Semiconductor and FPD Parts
East Asia (particularly Taiwan, South Korea, and China) holds the dominant position in the surface treatment services market for semiconductors and FPD parts, due to the concentration of major semiconductor and FPD manufacturers in the region. This dominance is primarily driven by substantial government investments in the semiconductor and electronics industry, advanced infrastructure supporting manufacturing operations, and a skilled workforce capable of handling advanced technologies. Other regions like North America and Europe are also significant contributors to the market, but their growth rates are expected to be lower compared to East Asia.
- Key Drivers in East Asia:
- Large concentration of semiconductor and FPD manufacturing facilities.
- Significant government investments and supportive policies.
- Highly skilled and experienced workforce.
- Robust infrastructure supporting advanced manufacturing.
- Market Share: East Asia holds approximately xx% of the global market share in 2025.
- Growth Potential: While East Asia maintains its dominance, other regions are expected to exhibit growth, but at a slower pace.
Surface Treatment Service for Semiconductor and FPD Parts Product Landscape
The product landscape encompasses a variety of surface treatment processes, including cleaning, etching, deposition, and coating. Recent innovations focus on improving process efficiency, reducing defects, and enhancing the performance of treated surfaces. Advanced techniques like ALD and CMP are gaining traction, offering superior control and precision compared to traditional methods. Unique selling propositions include faster processing speeds, improved surface uniformity, enhanced adhesion properties, and reduced environmental impact. These advancements contribute to better yield, reliability, and performance in the end products.
Key Drivers, Barriers & Challenges in Surface Treatment Service for Semiconductor and FPD Parts
Key Drivers: The increasing demand for miniaturized and high-performance semiconductor and FPD devices, advancements in semiconductor manufacturing processes, and the rise of innovative surface treatment technologies are major drivers. Government initiatives and investments in the semiconductor industry also play a crucial role.
Key Challenges & Restraints: The high capital expenditure required for advanced equipment and facilities presents a significant barrier to entry. Stringent environmental regulations and the complexity of surface treatment processes add to the operational challenges. Intense competition and price pressures from both domestic and international players are also significant concerns. Supply chain disruptions impacting raw materials and equipment availability pose a continuing risk, estimated to impact the market by xx million USD in 2026.
Emerging Opportunities in Surface Treatment Service for Semiconductor and FPD Parts
Emerging opportunities include the growing demand for advanced packaging technologies, the expansion of the 5G and IoT markets driving higher demand for advanced semiconductor devices, and the development of new materials and applications in the FPD sector. Untapped markets in emerging economies offer significant potential for growth. The increasing focus on sustainability and environmental responsibility creates opportunities for eco-friendly surface treatment solutions.
Growth Accelerators in the Surface Treatment Service for Semiconductor and FPD Parts Industry
Technological breakthroughs, specifically in ALD and CMP, significantly accelerate market growth by enabling the production of more sophisticated and reliable semiconductor and FPD components. Strategic partnerships between surface treatment providers and semiconductor manufacturers enhance collaboration and innovation, while market expansion strategies, focusing on emerging economies, create new avenues for growth.
Key Players Shaping the Surface Treatment Service for Semiconductor and FPD Parts Market
- UCT (Ultra Clean Holdings, Inc.)
- Pentagon Technologies
- Enpro Industries
- TOCALO Co., Ltd.
- Mitsubishi Chemical (Cleanpart)
- KoMiCo
- Cinos
- Hansol IONES
- WONIK QnC
- DFtech
- TOPWINTECH
- FEMVIX
- Heraeus Holding
- Frontken Corporation Berhad
- Value Engineering Co., Ltd
- KERTZ HIGH TECH
- Hung Jie Technology Corporation
- Oerlikon Balzers
- APS Materials, Inc.
- SilcoTek
- Shih Her Technology
- HTCSolar
- Neutron Technology Enterprise
- JST Manufacturing
- Jiangsu Kaiweitesi Semiconductor Technology Co., Ltd.
- HCUT Co., Ltd
- Ferrotec (Anhui) Technology Development Co., Ltd
- Shanghai Companion
- Tolerance Semiconductor Equipment Qidong
- Konfoong Materials International
- MC Evolve Technologies Corporation
- SK enpulse
- Kuritec Service Co., Ltd.
Notable Milestones in Surface Treatment Service for Semiconductor and FPD Parts Sector
- 2020-Q4: Introduction of a new plasma etching technology by WONIK QnC significantly improving process efficiency.
- 2022-Q2: Strategic partnership between UCT and a major semiconductor manufacturer for the development of next-generation CMP solutions.
- 2023-Q1: Acquisition of a smaller surface treatment company by Heraeus Holding, expanding its market reach.
- 2024-Q3: Launch of a new eco-friendly cleaning solution by Mitsubishi Chemical (Cleanpart) addressing environmental concerns.
In-Depth Surface Treatment Service for Semiconductor and FPD Parts Market Outlook
The surface treatment services market for semiconductor and FPD parts is poised for continued robust growth, driven by advancements in semiconductor technology, increasing demand for high-performance electronics, and the expansion of emerging markets. Strategic partnerships, innovative product developments, and the adoption of sustainable practices will play crucial roles in shaping the future of this dynamic market. The long-term outlook is positive, with significant growth potential for companies that can adapt to evolving technological landscapes and customer needs.
Surface Treatment Service for Semiconductor and FPD Parts Segmentation
-
1. Application
- 1.1. Semiconductor Equipment Parts
- 1.2. Flat Panel Display (FPD)
-
2. Types
- 2.1. Precision Cleaning
- 2.2. Thermal Spray Coating
- 2.3. Anodizing
- 2.4. Others
Surface Treatment Service for Semiconductor and FPD Parts Segmentation By Geography
-
1. North America
- 1.1. United States
- 1.2. Canada
- 1.3. Mexico
-
2. South America
- 2.1. Brazil
- 2.2. Argentina
- 2.3. Rest of South America
-
3. Europe
- 3.1. United Kingdom
- 3.2. Germany
- 3.3. France
- 3.4. Italy
- 3.5. Spain
- 3.6. Russia
- 3.7. Benelux
- 3.8. Nordics
- 3.9. Rest of Europe
-
4. Middle East & Africa
- 4.1. Turkey
- 4.2. Israel
- 4.3. GCC
- 4.4. North Africa
- 4.5. South Africa
- 4.6. Rest of Middle East & Africa
-
5. Asia Pacific
- 5.1. China
- 5.2. India
- 5.3. Japan
- 5.4. South Korea
- 5.5. ASEAN
- 5.6. Oceania
- 5.7. Rest of Asia Pacific
Surface Treatment Service for Semiconductor and FPD Parts Regional Market Share
Geographic Coverage of Surface Treatment Service for Semiconductor and FPD Parts
Surface Treatment Service for Semiconductor and FPD Parts REPORT HIGHLIGHTS
| Aspects | Details |
|---|---|
| Study Period | 2020-2034 |
| Base Year | 2025 |
| Estimated Year | 2026 |
| Forecast Period | 2026-2034 |
| Historical Period | 2020-2025 |
| Growth Rate | CAGR of 5.9% from 2020-2034 |
| Segmentation |
|
Table of Contents
- 1. Introduction
- 1.1. Research Scope
- 1.2. Market Segmentation
- 1.3. Research Methodology
- 1.4. Definitions and Assumptions
- 2. Executive Summary
- 2.1. Introduction
- 3. Market Dynamics
- 3.1. Introduction
- 3.2. Market Drivers
- 3.3. Market Restrains
- 3.4. Market Trends
- 4. Market Factor Analysis
- 4.1. Porters Five Forces
- 4.2. Supply/Value Chain
- 4.3. PESTEL analysis
- 4.4. Market Entropy
- 4.5. Patent/Trademark Analysis
- 5. Global Surface Treatment Service for Semiconductor and FPD Parts Analysis, Insights and Forecast, 2020-2032
- 5.1. Market Analysis, Insights and Forecast - by Application
- 5.1.1. Semiconductor Equipment Parts
- 5.1.2. Flat Panel Display (FPD)
- 5.2. Market Analysis, Insights and Forecast - by Types
- 5.2.1. Precision Cleaning
- 5.2.2. Thermal Spray Coating
- 5.2.3. Anodizing
- 5.2.4. Others
- 5.3. Market Analysis, Insights and Forecast - by Region
- 5.3.1. North America
- 5.3.2. South America
- 5.3.3. Europe
- 5.3.4. Middle East & Africa
- 5.3.5. Asia Pacific
- 5.1. Market Analysis, Insights and Forecast - by Application
- 6. North America Surface Treatment Service for Semiconductor and FPD Parts Analysis, Insights and Forecast, 2020-2032
- 6.1. Market Analysis, Insights and Forecast - by Application
- 6.1.1. Semiconductor Equipment Parts
- 6.1.2. Flat Panel Display (FPD)
- 6.2. Market Analysis, Insights and Forecast - by Types
- 6.2.1. Precision Cleaning
- 6.2.2. Thermal Spray Coating
- 6.2.3. Anodizing
- 6.2.4. Others
- 6.1. Market Analysis, Insights and Forecast - by Application
- 7. South America Surface Treatment Service for Semiconductor and FPD Parts Analysis, Insights and Forecast, 2020-2032
- 7.1. Market Analysis, Insights and Forecast - by Application
- 7.1.1. Semiconductor Equipment Parts
- 7.1.2. Flat Panel Display (FPD)
- 7.2. Market Analysis, Insights and Forecast - by Types
- 7.2.1. Precision Cleaning
- 7.2.2. Thermal Spray Coating
- 7.2.3. Anodizing
- 7.2.4. Others
- 7.1. Market Analysis, Insights and Forecast - by Application
- 8. Europe Surface Treatment Service for Semiconductor and FPD Parts Analysis, Insights and Forecast, 2020-2032
- 8.1. Market Analysis, Insights and Forecast - by Application
- 8.1.1. Semiconductor Equipment Parts
- 8.1.2. Flat Panel Display (FPD)
- 8.2. Market Analysis, Insights and Forecast - by Types
- 8.2.1. Precision Cleaning
- 8.2.2. Thermal Spray Coating
- 8.2.3. Anodizing
- 8.2.4. Others
- 8.1. Market Analysis, Insights and Forecast - by Application
- 9. Middle East & Africa Surface Treatment Service for Semiconductor and FPD Parts Analysis, Insights and Forecast, 2020-2032
- 9.1. Market Analysis, Insights and Forecast - by Application
- 9.1.1. Semiconductor Equipment Parts
- 9.1.2. Flat Panel Display (FPD)
- 9.2. Market Analysis, Insights and Forecast - by Types
- 9.2.1. Precision Cleaning
- 9.2.2. Thermal Spray Coating
- 9.2.3. Anodizing
- 9.2.4. Others
- 9.1. Market Analysis, Insights and Forecast - by Application
- 10. Asia Pacific Surface Treatment Service for Semiconductor and FPD Parts Analysis, Insights and Forecast, 2020-2032
- 10.1. Market Analysis, Insights and Forecast - by Application
- 10.1.1. Semiconductor Equipment Parts
- 10.1.2. Flat Panel Display (FPD)
- 10.2. Market Analysis, Insights and Forecast - by Types
- 10.2.1. Precision Cleaning
- 10.2.2. Thermal Spray Coating
- 10.2.3. Anodizing
- 10.2.4. Others
- 10.1. Market Analysis, Insights and Forecast - by Application
- 11. Competitive Analysis
- 11.1. Global Market Share Analysis 2025
- 11.2. Company Profiles
- 11.2.1 UCT (Ultra Clean Holdings
- 11.2.1.1. Overview
- 11.2.1.2. Products
- 11.2.1.3. SWOT Analysis
- 11.2.1.4. Recent Developments
- 11.2.1.5. Financials (Based on Availability)
- 11.2.2 Inc)
- 11.2.2.1. Overview
- 11.2.2.2. Products
- 11.2.2.3. SWOT Analysis
- 11.2.2.4. Recent Developments
- 11.2.2.5. Financials (Based on Availability)
- 11.2.3 Pentagon Technologies
- 11.2.3.1. Overview
- 11.2.3.2. Products
- 11.2.3.3. SWOT Analysis
- 11.2.3.4. Recent Developments
- 11.2.3.5. Financials (Based on Availability)
- 11.2.4 Enpro Industries
- 11.2.4.1. Overview
- 11.2.4.2. Products
- 11.2.4.3. SWOT Analysis
- 11.2.4.4. Recent Developments
- 11.2.4.5. Financials (Based on Availability)
- 11.2.5 TOCALO Co.
- 11.2.5.1. Overview
- 11.2.5.2. Products
- 11.2.5.3. SWOT Analysis
- 11.2.5.4. Recent Developments
- 11.2.5.5. Financials (Based on Availability)
- 11.2.6 Ltd.
- 11.2.6.1. Overview
- 11.2.6.2. Products
- 11.2.6.3. SWOT Analysis
- 11.2.6.4. Recent Developments
- 11.2.6.5. Financials (Based on Availability)
- 11.2.7 Mitsubishi Chemical (Cleanpart)
- 11.2.7.1. Overview
- 11.2.7.2. Products
- 11.2.7.3. SWOT Analysis
- 11.2.7.4. Recent Developments
- 11.2.7.5. Financials (Based on Availability)
- 11.2.8 KoMiCo
- 11.2.8.1. Overview
- 11.2.8.2. Products
- 11.2.8.3. SWOT Analysis
- 11.2.8.4. Recent Developments
- 11.2.8.5. Financials (Based on Availability)
- 11.2.9 Cinos
- 11.2.9.1. Overview
- 11.2.9.2. Products
- 11.2.9.3. SWOT Analysis
- 11.2.9.4. Recent Developments
- 11.2.9.5. Financials (Based on Availability)
- 11.2.10 Hansol IONES
- 11.2.10.1. Overview
- 11.2.10.2. Products
- 11.2.10.3. SWOT Analysis
- 11.2.10.4. Recent Developments
- 11.2.10.5. Financials (Based on Availability)
- 11.2.11 WONIK QnC
- 11.2.11.1. Overview
- 11.2.11.2. Products
- 11.2.11.3. SWOT Analysis
- 11.2.11.4. Recent Developments
- 11.2.11.5. Financials (Based on Availability)
- 11.2.12 DFtech
- 11.2.12.1. Overview
- 11.2.12.2. Products
- 11.2.12.3. SWOT Analysis
- 11.2.12.4. Recent Developments
- 11.2.12.5. Financials (Based on Availability)
- 11.2.13 TOPWINTECH
- 11.2.13.1. Overview
- 11.2.13.2. Products
- 11.2.13.3. SWOT Analysis
- 11.2.13.4. Recent Developments
- 11.2.13.5. Financials (Based on Availability)
- 11.2.14 FEMVIX
- 11.2.14.1. Overview
- 11.2.14.2. Products
- 11.2.14.3. SWOT Analysis
- 11.2.14.4. Recent Developments
- 11.2.14.5. Financials (Based on Availability)
- 11.2.15 Heraeus Holding
- 11.2.15.1. Overview
- 11.2.15.2. Products
- 11.2.15.3. SWOT Analysis
- 11.2.15.4. Recent Developments
- 11.2.15.5. Financials (Based on Availability)
- 11.2.16 Frontken Corporation Berhad
- 11.2.16.1. Overview
- 11.2.16.2. Products
- 11.2.16.3. SWOT Analysis
- 11.2.16.4. Recent Developments
- 11.2.16.5. Financials (Based on Availability)
- 11.2.17 Value Engineering Co.
- 11.2.17.1. Overview
- 11.2.17.2. Products
- 11.2.17.3. SWOT Analysis
- 11.2.17.4. Recent Developments
- 11.2.17.5. Financials (Based on Availability)
- 11.2.18 Ltd
- 11.2.18.1. Overview
- 11.2.18.2. Products
- 11.2.18.3. SWOT Analysis
- 11.2.18.4. Recent Developments
- 11.2.18.5. Financials (Based on Availability)
- 11.2.19 KERTZ HIGH TECH
- 11.2.19.1. Overview
- 11.2.19.2. Products
- 11.2.19.3. SWOT Analysis
- 11.2.19.4. Recent Developments
- 11.2.19.5. Financials (Based on Availability)
- 11.2.20 Hung Jie Technology Corporation
- 11.2.20.1. Overview
- 11.2.20.2. Products
- 11.2.20.3. SWOT Analysis
- 11.2.20.4. Recent Developments
- 11.2.20.5. Financials (Based on Availability)
- 11.2.21 Oerlikon Balzers
- 11.2.21.1. Overview
- 11.2.21.2. Products
- 11.2.21.3. SWOT Analysis
- 11.2.21.4. Recent Developments
- 11.2.21.5. Financials (Based on Availability)
- 11.2.22 APS Materials
- 11.2.22.1. Overview
- 11.2.22.2. Products
- 11.2.22.3. SWOT Analysis
- 11.2.22.4. Recent Developments
- 11.2.22.5. Financials (Based on Availability)
- 11.2.23 Inc.
- 11.2.23.1. Overview
- 11.2.23.2. Products
- 11.2.23.3. SWOT Analysis
- 11.2.23.4. Recent Developments
- 11.2.23.5. Financials (Based on Availability)
- 11.2.24 SilcoTek
- 11.2.24.1. Overview
- 11.2.24.2. Products
- 11.2.24.3. SWOT Analysis
- 11.2.24.4. Recent Developments
- 11.2.24.5. Financials (Based on Availability)
- 11.2.25 Shih Her Technology
- 11.2.25.1. Overview
- 11.2.25.2. Products
- 11.2.25.3. SWOT Analysis
- 11.2.25.4. Recent Developments
- 11.2.25.5. Financials (Based on Availability)
- 11.2.26 HTCSolar
- 11.2.26.1. Overview
- 11.2.26.2. Products
- 11.2.26.3. SWOT Analysis
- 11.2.26.4. Recent Developments
- 11.2.26.5. Financials (Based on Availability)
- 11.2.27 Neutron Technology Enterprise
- 11.2.27.1. Overview
- 11.2.27.2. Products
- 11.2.27.3. SWOT Analysis
- 11.2.27.4. Recent Developments
- 11.2.27.5. Financials (Based on Availability)
- 11.2.28 JST Manufacturing
- 11.2.28.1. Overview
- 11.2.28.2. Products
- 11.2.28.3. SWOT Analysis
- 11.2.28.4. Recent Developments
- 11.2.28.5. Financials (Based on Availability)
- 11.2.29 Jiangsu Kaiweitesi Semiconductor Technology Co.
- 11.2.29.1. Overview
- 11.2.29.2. Products
- 11.2.29.3. SWOT Analysis
- 11.2.29.4. Recent Developments
- 11.2.29.5. Financials (Based on Availability)
- 11.2.30 Ltd.
- 11.2.30.1. Overview
- 11.2.30.2. Products
- 11.2.30.3. SWOT Analysis
- 11.2.30.4. Recent Developments
- 11.2.30.5. Financials (Based on Availability)
- 11.2.31 HCUT Co.
- 11.2.31.1. Overview
- 11.2.31.2. Products
- 11.2.31.3. SWOT Analysis
- 11.2.31.4. Recent Developments
- 11.2.31.5. Financials (Based on Availability)
- 11.2.32 Ltd
- 11.2.32.1. Overview
- 11.2.32.2. Products
- 11.2.32.3. SWOT Analysis
- 11.2.32.4. Recent Developments
- 11.2.32.5. Financials (Based on Availability)
- 11.2.33 Ferrotec (Anhui) Technology Development Co.
- 11.2.33.1. Overview
- 11.2.33.2. Products
- 11.2.33.3. SWOT Analysis
- 11.2.33.4. Recent Developments
- 11.2.33.5. Financials (Based on Availability)
- 11.2.34 Ltd
- 11.2.34.1. Overview
- 11.2.34.2. Products
- 11.2.34.3. SWOT Analysis
- 11.2.34.4. Recent Developments
- 11.2.34.5. Financials (Based on Availability)
- 11.2.35 Shanghai Companion
- 11.2.35.1. Overview
- 11.2.35.2. Products
- 11.2.35.3. SWOT Analysis
- 11.2.35.4. Recent Developments
- 11.2.35.5. Financials (Based on Availability)
- 11.2.36 Tolerance Semiconductor Equipment Qidong
- 11.2.36.1. Overview
- 11.2.36.2. Products
- 11.2.36.3. SWOT Analysis
- 11.2.36.4. Recent Developments
- 11.2.36.5. Financials (Based on Availability)
- 11.2.37 Konfoong Materials International
- 11.2.37.1. Overview
- 11.2.37.2. Products
- 11.2.37.3. SWOT Analysis
- 11.2.37.4. Recent Developments
- 11.2.37.5. Financials (Based on Availability)
- 11.2.38 MC Evolve Technologies Corporation
- 11.2.38.1. Overview
- 11.2.38.2. Products
- 11.2.38.3. SWOT Analysis
- 11.2.38.4. Recent Developments
- 11.2.38.5. Financials (Based on Availability)
- 11.2.39 SK enpulse
- 11.2.39.1. Overview
- 11.2.39.2. Products
- 11.2.39.3. SWOT Analysis
- 11.2.39.4. Recent Developments
- 11.2.39.5. Financials (Based on Availability)
- 11.2.40 Kuritec Service Co.
- 11.2.40.1. Overview
- 11.2.40.2. Products
- 11.2.40.3. SWOT Analysis
- 11.2.40.4. Recent Developments
- 11.2.40.5. Financials (Based on Availability)
- 11.2.41 Ltd.
- 11.2.41.1. Overview
- 11.2.41.2. Products
- 11.2.41.3. SWOT Analysis
- 11.2.41.4. Recent Developments
- 11.2.41.5. Financials (Based on Availability)
- 11.2.1 UCT (Ultra Clean Holdings
List of Figures
- Figure 1: Global Surface Treatment Service for Semiconductor and FPD Parts Revenue Breakdown (million, %) by Region 2025 & 2033
- Figure 2: North America Surface Treatment Service for Semiconductor and FPD Parts Revenue (million), by Application 2025 & 2033
- Figure 3: North America Surface Treatment Service for Semiconductor and FPD Parts Revenue Share (%), by Application 2025 & 2033
- Figure 4: North America Surface Treatment Service for Semiconductor and FPD Parts Revenue (million), by Types 2025 & 2033
- Figure 5: North America Surface Treatment Service for Semiconductor and FPD Parts Revenue Share (%), by Types 2025 & 2033
- Figure 6: North America Surface Treatment Service for Semiconductor and FPD Parts Revenue (million), by Country 2025 & 2033
- Figure 7: North America Surface Treatment Service for Semiconductor and FPD Parts Revenue Share (%), by Country 2025 & 2033
- Figure 8: South America Surface Treatment Service for Semiconductor and FPD Parts Revenue (million), by Application 2025 & 2033
- Figure 9: South America Surface Treatment Service for Semiconductor and FPD Parts Revenue Share (%), by Application 2025 & 2033
- Figure 10: South America Surface Treatment Service for Semiconductor and FPD Parts Revenue (million), by Types 2025 & 2033
- Figure 11: South America Surface Treatment Service for Semiconductor and FPD Parts Revenue Share (%), by Types 2025 & 2033
- Figure 12: South America Surface Treatment Service for Semiconductor and FPD Parts Revenue (million), by Country 2025 & 2033
- Figure 13: South America Surface Treatment Service for Semiconductor and FPD Parts Revenue Share (%), by Country 2025 & 2033
- Figure 14: Europe Surface Treatment Service for Semiconductor and FPD Parts Revenue (million), by Application 2025 & 2033
- Figure 15: Europe Surface Treatment Service for Semiconductor and FPD Parts Revenue Share (%), by Application 2025 & 2033
- Figure 16: Europe Surface Treatment Service for Semiconductor and FPD Parts Revenue (million), by Types 2025 & 2033
- Figure 17: Europe Surface Treatment Service for Semiconductor and FPD Parts Revenue Share (%), by Types 2025 & 2033
- Figure 18: Europe Surface Treatment Service for Semiconductor and FPD Parts Revenue (million), by Country 2025 & 2033
- Figure 19: Europe Surface Treatment Service for Semiconductor and FPD Parts Revenue Share (%), by Country 2025 & 2033
- Figure 20: Middle East & Africa Surface Treatment Service for Semiconductor and FPD Parts Revenue (million), by Application 2025 & 2033
- Figure 21: Middle East & Africa Surface Treatment Service for Semiconductor and FPD Parts Revenue Share (%), by Application 2025 & 2033
- Figure 22: Middle East & Africa Surface Treatment Service for Semiconductor and FPD Parts Revenue (million), by Types 2025 & 2033
- Figure 23: Middle East & Africa Surface Treatment Service for Semiconductor and FPD Parts Revenue Share (%), by Types 2025 & 2033
- Figure 24: Middle East & Africa Surface Treatment Service for Semiconductor and FPD Parts Revenue (million), by Country 2025 & 2033
- Figure 25: Middle East & Africa Surface Treatment Service for Semiconductor and FPD Parts Revenue Share (%), by Country 2025 & 2033
- Figure 26: Asia Pacific Surface Treatment Service for Semiconductor and FPD Parts Revenue (million), by Application 2025 & 2033
- Figure 27: Asia Pacific Surface Treatment Service for Semiconductor and FPD Parts Revenue Share (%), by Application 2025 & 2033
- Figure 28: Asia Pacific Surface Treatment Service for Semiconductor and FPD Parts Revenue (million), by Types 2025 & 2033
- Figure 29: Asia Pacific Surface Treatment Service for Semiconductor and FPD Parts Revenue Share (%), by Types 2025 & 2033
- Figure 30: Asia Pacific Surface Treatment Service for Semiconductor and FPD Parts Revenue (million), by Country 2025 & 2033
- Figure 31: Asia Pacific Surface Treatment Service for Semiconductor and FPD Parts Revenue Share (%), by Country 2025 & 2033
List of Tables
- Table 1: Global Surface Treatment Service for Semiconductor and FPD Parts Revenue million Forecast, by Application 2020 & 2033
- Table 2: Global Surface Treatment Service for Semiconductor and FPD Parts Revenue million Forecast, by Types 2020 & 2033
- Table 3: Global Surface Treatment Service for Semiconductor and FPD Parts Revenue million Forecast, by Region 2020 & 2033
- Table 4: Global Surface Treatment Service for Semiconductor and FPD Parts Revenue million Forecast, by Application 2020 & 2033
- Table 5: Global Surface Treatment Service for Semiconductor and FPD Parts Revenue million Forecast, by Types 2020 & 2033
- Table 6: Global Surface Treatment Service for Semiconductor and FPD Parts Revenue million Forecast, by Country 2020 & 2033
- Table 7: United States Surface Treatment Service for Semiconductor and FPD Parts Revenue (million) Forecast, by Application 2020 & 2033
- Table 8: Canada Surface Treatment Service for Semiconductor and FPD Parts Revenue (million) Forecast, by Application 2020 & 2033
- Table 9: Mexico Surface Treatment Service for Semiconductor and FPD Parts Revenue (million) Forecast, by Application 2020 & 2033
- Table 10: Global Surface Treatment Service for Semiconductor and FPD Parts Revenue million Forecast, by Application 2020 & 2033
- Table 11: Global Surface Treatment Service for Semiconductor and FPD Parts Revenue million Forecast, by Types 2020 & 2033
- Table 12: Global Surface Treatment Service for Semiconductor and FPD Parts Revenue million Forecast, by Country 2020 & 2033
- Table 13: Brazil Surface Treatment Service for Semiconductor and FPD Parts Revenue (million) Forecast, by Application 2020 & 2033
- Table 14: Argentina Surface Treatment Service for Semiconductor and FPD Parts Revenue (million) Forecast, by Application 2020 & 2033
- Table 15: Rest of South America Surface Treatment Service for Semiconductor and FPD Parts Revenue (million) Forecast, by Application 2020 & 2033
- Table 16: Global Surface Treatment Service for Semiconductor and FPD Parts Revenue million Forecast, by Application 2020 & 2033
- Table 17: Global Surface Treatment Service for Semiconductor and FPD Parts Revenue million Forecast, by Types 2020 & 2033
- Table 18: Global Surface Treatment Service for Semiconductor and FPD Parts Revenue million Forecast, by Country 2020 & 2033
- Table 19: United Kingdom Surface Treatment Service for Semiconductor and FPD Parts Revenue (million) Forecast, by Application 2020 & 2033
- Table 20: Germany Surface Treatment Service for Semiconductor and FPD Parts Revenue (million) Forecast, by Application 2020 & 2033
- Table 21: France Surface Treatment Service for Semiconductor and FPD Parts Revenue (million) Forecast, by Application 2020 & 2033
- Table 22: Italy Surface Treatment Service for Semiconductor and FPD Parts Revenue (million) Forecast, by Application 2020 & 2033
- Table 23: Spain Surface Treatment Service for Semiconductor and FPD Parts Revenue (million) Forecast, by Application 2020 & 2033
- Table 24: Russia Surface Treatment Service for Semiconductor and FPD Parts Revenue (million) Forecast, by Application 2020 & 2033
- Table 25: Benelux Surface Treatment Service for Semiconductor and FPD Parts Revenue (million) Forecast, by Application 2020 & 2033
- Table 26: Nordics Surface Treatment Service for Semiconductor and FPD Parts Revenue (million) Forecast, by Application 2020 & 2033
- Table 27: Rest of Europe Surface Treatment Service for Semiconductor and FPD Parts Revenue (million) Forecast, by Application 2020 & 2033
- Table 28: Global Surface Treatment Service for Semiconductor and FPD Parts Revenue million Forecast, by Application 2020 & 2033
- Table 29: Global Surface Treatment Service for Semiconductor and FPD Parts Revenue million Forecast, by Types 2020 & 2033
- Table 30: Global Surface Treatment Service for Semiconductor and FPD Parts Revenue million Forecast, by Country 2020 & 2033
- Table 31: Turkey Surface Treatment Service for Semiconductor and FPD Parts Revenue (million) Forecast, by Application 2020 & 2033
- Table 32: Israel Surface Treatment Service for Semiconductor and FPD Parts Revenue (million) Forecast, by Application 2020 & 2033
- Table 33: GCC Surface Treatment Service for Semiconductor and FPD Parts Revenue (million) Forecast, by Application 2020 & 2033
- Table 34: North Africa Surface Treatment Service for Semiconductor and FPD Parts Revenue (million) Forecast, by Application 2020 & 2033
- Table 35: South Africa Surface Treatment Service for Semiconductor and FPD Parts Revenue (million) Forecast, by Application 2020 & 2033
- Table 36: Rest of Middle East & Africa Surface Treatment Service for Semiconductor and FPD Parts Revenue (million) Forecast, by Application 2020 & 2033
- Table 37: Global Surface Treatment Service for Semiconductor and FPD Parts Revenue million Forecast, by Application 2020 & 2033
- Table 38: Global Surface Treatment Service for Semiconductor and FPD Parts Revenue million Forecast, by Types 2020 & 2033
- Table 39: Global Surface Treatment Service for Semiconductor and FPD Parts Revenue million Forecast, by Country 2020 & 2033
- Table 40: China Surface Treatment Service for Semiconductor and FPD Parts Revenue (million) Forecast, by Application 2020 & 2033
- Table 41: India Surface Treatment Service for Semiconductor and FPD Parts Revenue (million) Forecast, by Application 2020 & 2033
- Table 42: Japan Surface Treatment Service for Semiconductor and FPD Parts Revenue (million) Forecast, by Application 2020 & 2033
- Table 43: South Korea Surface Treatment Service for Semiconductor and FPD Parts Revenue (million) Forecast, by Application 2020 & 2033
- Table 44: ASEAN Surface Treatment Service for Semiconductor and FPD Parts Revenue (million) Forecast, by Application 2020 & 2033
- Table 45: Oceania Surface Treatment Service for Semiconductor and FPD Parts Revenue (million) Forecast, by Application 2020 & 2033
- Table 46: Rest of Asia Pacific Surface Treatment Service for Semiconductor and FPD Parts Revenue (million) Forecast, by Application 2020 & 2033
Frequently Asked Questions
1. What is the projected Compound Annual Growth Rate (CAGR) of the Surface Treatment Service for Semiconductor and FPD Parts?
The projected CAGR is approximately 5.9%.
2. Which companies are prominent players in the Surface Treatment Service for Semiconductor and FPD Parts?
Key companies in the market include UCT (Ultra Clean Holdings, Inc), Pentagon Technologies, Enpro Industries, TOCALO Co., Ltd., Mitsubishi Chemical (Cleanpart), KoMiCo, Cinos, Hansol IONES, WONIK QnC, DFtech, TOPWINTECH, FEMVIX, Heraeus Holding, Frontken Corporation Berhad, Value Engineering Co., Ltd, KERTZ HIGH TECH, Hung Jie Technology Corporation, Oerlikon Balzers, APS Materials, Inc., SilcoTek, Shih Her Technology, HTCSolar, Neutron Technology Enterprise, JST Manufacturing, Jiangsu Kaiweitesi Semiconductor Technology Co., Ltd., HCUT Co., Ltd, Ferrotec (Anhui) Technology Development Co., Ltd, Shanghai Companion, Tolerance Semiconductor Equipment Qidong, Konfoong Materials International, MC Evolve Technologies Corporation, SK enpulse, Kuritec Service Co., Ltd..
3. What are the main segments of the Surface Treatment Service for Semiconductor and FPD Parts?
The market segments include Application, Types.
4. Can you provide details about the market size?
The market size is estimated to be USD 2591.6 million as of 2022.
5. What are some drivers contributing to market growth?
N/A
6. What are the notable trends driving market growth?
N/A
7. Are there any restraints impacting market growth?
N/A
8. Can you provide examples of recent developments in the market?
N/A
9. What pricing options are available for accessing the report?
Pricing options include single-user, multi-user, and enterprise licenses priced at USD 4900.00, USD 7350.00, and USD 9800.00 respectively.
10. Is the market size provided in terms of value or volume?
The market size is provided in terms of value, measured in million.
11. Are there any specific market keywords associated with the report?
Yes, the market keyword associated with the report is "Surface Treatment Service for Semiconductor and FPD Parts," which aids in identifying and referencing the specific market segment covered.
12. How do I determine which pricing option suits my needs best?
The pricing options vary based on user requirements and access needs. Individual users may opt for single-user licenses, while businesses requiring broader access may choose multi-user or enterprise licenses for cost-effective access to the report.
13. Are there any additional resources or data provided in the Surface Treatment Service for Semiconductor and FPD Parts report?
While the report offers comprehensive insights, it's advisable to review the specific contents or supplementary materials provided to ascertain if additional resources or data are available.
14. How can I stay updated on further developments or reports in the Surface Treatment Service for Semiconductor and FPD Parts?
To stay informed about further developments, trends, and reports in the Surface Treatment Service for Semiconductor and FPD Parts, consider subscribing to industry newsletters, following relevant companies and organizations, or regularly checking reputable industry news sources and publications.
Methodology
Step 1 - Identification of Relevant Samples Size from Population Database


Step 2 - Approaches for Defining Global Market Size (Value, Volume* & Price*)

Note*: In applicable scenarios
Step 3 - Data Sources
Primary Research
- Web Analytics
- Survey Reports
- Research Institute
- Latest Research Reports
- Opinion Leaders
Secondary Research
- Annual Reports
- White Paper
- Latest Press Release
- Industry Association
- Paid Database
- Investor Presentations

Step 4 - Data Triangulation
Involves using different sources of information in order to increase the validity of a study
These sources are likely to be stakeholders in a program - participants, other researchers, program staff, other community members, and so on.
Then we put all data in single framework & apply various statistical tools to find out the dynamic on the market.
During the analysis stage, feedback from the stakeholder groups would be compared to determine areas of agreement as well as areas of divergence