Growth Strategies in Supersonic vs Hypersonic Weapons Industry Market: 2025-2033 Outlook

Supersonic vs Hypersonic Weapons Industry by Production Analysis, by Consumption Analysis, by Import Market Analysis (Value & Volume), by Export Market Analysis (Value & Volume), by Price Trend Analysis, by North America (United States, Canada, Mexico), by South America (Brazil, Argentina, Rest of South America), by Europe (United Kingdom, Germany, France, Italy, Spain, Russia, Benelux, Nordics, Rest of Europe), by Middle East & Africa (Turkey, Israel, GCC, North Africa, South Africa, Rest of Middle East & Africa), by Asia Pacific (China, India, Japan, South Korea, ASEAN, Oceania, Rest of Asia Pacific) Forecast 2025-2033

Jul 1 2025
Base Year: 2024

234 Pages
Main Logo

Growth Strategies in Supersonic vs Hypersonic Weapons Industry Market: 2025-2033 Outlook


Home
Industries
Aerospace & Defense
sponsor image
sponsor image
sponsor image
sponsor image

Tailored for you

  • In-depth Analysis Tailored to Specified Regions or Segments
  • Company Profiles Customized to User Preferences
  • Comprehensive Insights Focused on Specific Segments or Regions
  • Customized Evaluation of Competitive Landscape to Meet Your Needs
  • Tailored Customization to Address Other Specific Requirements
Ask for customization


Key Insights

The supersonic and hypersonic weapons market is experiencing robust growth, driven by escalating geopolitical tensions and the ongoing arms race among major global powers. The market's expansion is fueled by continuous technological advancements leading to improved accuracy, speed, and maneuverability of these weapons systems. While supersonic weapons, possessing speeds exceeding the speed of sound, remain a significant part of the market, the segment experiencing the most rapid expansion is hypersonic weapons, capable of exceeding Mach 5. This surge in hypersonic weapon development is primarily due to their enhanced capabilities in penetrating existing air defense systems and their potential for rapid deployment. The market is segmented by speed (supersonic and hypersonic) and type (missiles and hypersonic glide vehicles). Missiles currently dominate the market share, but hypersonic glide vehicles, with their unique trajectory and enhanced survivability, represent a rapidly growing segment poised for significant market share capture in the coming decade. Regional analysis reveals that North America and Asia-Pacific currently hold the largest market shares, owing to significant investments in R&D and defense budgets. However, other regions, particularly in the Middle East and Europe, are witnessing increasing demand for both supersonic and hypersonic technologies, further contributing to the overall market expansion. Factors such as increasing defense budgets, technological advancements, and the need for enhanced national security are key drivers of this expanding market.

Despite the substantial growth, the market faces challenges. The high development and operational costs of hypersonic weapons pose a significant barrier to entry for many nations. Further complicating the landscape are the ethical and political concerns associated with the proliferation of these advanced weapons systems, leading to ongoing international discussions and potential regulatory hurdles. Nonetheless, given the strategic advantage provided by hypersonic capabilities, it's anticipated that market growth will remain strong throughout the forecast period (2025-2033), although at a potentially slightly moderated pace towards the end of the forecast period as the initial wave of technological advancements mature. The competitive landscape is dominated by established defense contractors, including Raytheon Technologies, Lockheed Martin, and Boeing, who are actively involved in R&D and production, further shaping the market dynamics.

Supersonic vs Hypersonic Weapons Industry Research Report - Market Size, Growth & Forecast

Supersonic vs. Hypersonic Weapons Industry: A Comprehensive Market Report (2019-2033)

This comprehensive report provides a detailed analysis of the Supersonic vs. Hypersonic Weapons industry, encompassing market dynamics, growth trends, regional dominance, product landscapes, and future outlooks. The study covers the period from 2019 to 2033, with a focus on the base year 2025 and a forecast period from 2025 to 2033. The report analyzes both the parent market (Weapons Industry) and the child markets (Supersonic and Hypersonic weapons, segmented by speed and type: Missiles and Hypersonic Glide Vehicles). The market size is presented in Million units.

Supersonic vs Hypersonic Weapons Industry Market Dynamics & Structure

This section analyzes the market structure, concentration, and driving forces. We examine technological innovations, regulatory landscapes, competitive substitutes, end-user demographics, and M&A activities within the supersonic and hypersonic weapons sector. The report delves into quantitative data, such as market share percentages and M&A deal volumes, alongside qualitative assessments of innovation barriers and other influencing factors. The global market size in 2025 is estimated at xx Million units.

  • Market Concentration: The market is moderately concentrated, with key players holding significant shares. The top 5 players account for approximately xx% of the market in 2025.
  • Technological Innovation: Continuous advancements in propulsion systems, materials science, and guidance systems are major drivers. Hypersonic technology is particularly dynamic, leading to frequent innovations.
  • Regulatory Frameworks: Strict export controls and international treaties significantly impact market growth and trade dynamics. Regional variations in regulatory frameworks further influence market access.
  • Competitive Substitutes: Existing weapon systems present competition, but the unique capabilities of hypersonic weapons offer a distinct advantage in certain applications.
  • End-User Demographics: Primarily government defense agencies and military forces globally drive demand. Specific requirements vary based on geopolitical factors and national security strategies.
  • M&A Trends: A moderate level of M&A activity is observed, with strategic acquisitions aiming to enhance technological capabilities and expand market reach. The number of deals from 2019-2024 was approximately xx.

Supersonic vs Hypersonic Weapons Industry Growth Trends & Insights

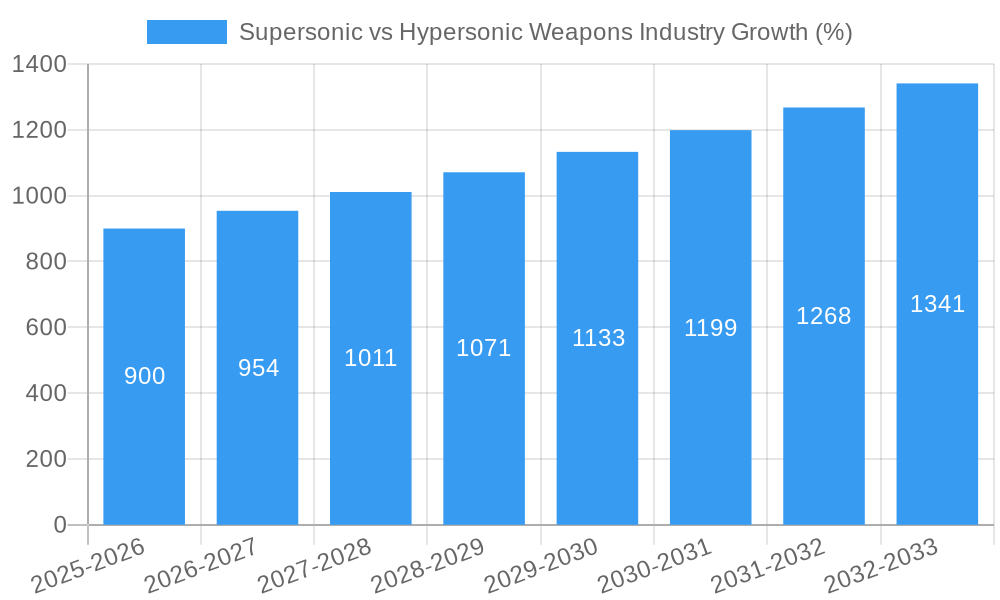
This section provides a detailed analysis of market size evolution, adoption rates, technological disruptions, and consumer behavior shifts in the supersonic and hypersonic weapons markets. It leverages both primary and secondary research data, providing quantitative metrics like CAGR and market penetration rates to illustrate historical and projected growth trajectories. The global market is projected to reach xx Million units by 2033. The CAGR for the forecast period (2025-2033) is estimated at xx%.

Supersonic vs Hypersonic Weapons Industry Growth

Dominant Regions, Countries, or Segments in Supersonic vs Hypersonic Weapons Industry

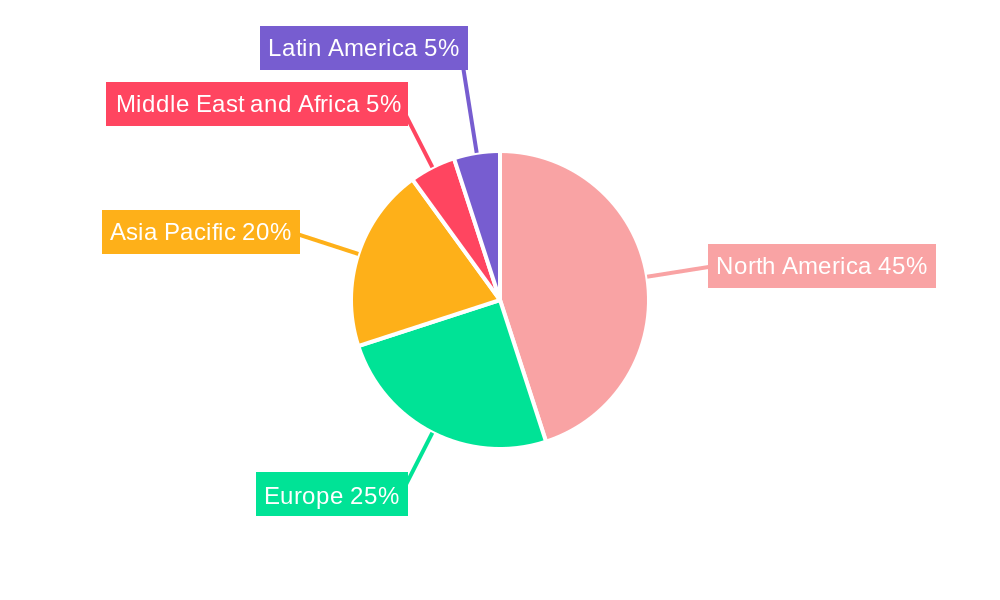
This section identifies the leading geographical regions and segments (by speed and type) driving market growth, analyzing market share, growth potential, and key influencing factors such as economic policies and infrastructure development. North America and Asia-Pacific are expected to dominate the market.

  • North America: High defense budgets, advanced technological capabilities, and a strong presence of key players contribute to North America's leading position. Market share: xx% in 2025.
  • Asia-Pacific: Rapid military modernization programs in several countries fuel significant growth in the region. Market share: xx% in 2025.
  • Europe: Established defense industries and ongoing collaborations among European nations contribute to moderate growth. Market share: xx% in 2025.
  • Missiles Segment: This segment currently dominates the market due to wider adoption and established manufacturing capabilities. Market share: xx% in 2025.
  • Hypersonic Glide Vehicles Segment: This segment demonstrates faster growth due to technological advancements and strategic importance, though it has a smaller current market share. Market share: xx% in 2025.

Supersonic vs Hypersonic Weapons Industry Product Landscape

This section describes the innovative features, applications, and performance metrics of supersonic and hypersonic weapons systems. It highlights the unique selling propositions and technological advancements that differentiate various products in the market.

The product landscape is characterized by a focus on increasing range, speed, maneuverability, and precision strike capabilities. Advanced materials, improved propulsion systems, and sophisticated guidance technologies are driving product innovation. Hypersonic glide vehicles are increasingly integrated with advanced countermeasures to enhance survivability.

Key Drivers, Barriers & Challenges in Supersonic vs Hypersonic Weapons Industry

This section outlines the primary forces driving market expansion, including technological advancements, economic factors, and supportive government policies. Conversely, it also identifies and quantifies key challenges and restraints, such as supply chain disruptions, regulatory hurdles, and competitive pressures.

Key Drivers:

  • Technological advancements in propulsion and guidance systems.
  • Increasing defense budgets globally.
  • Geopolitical instability and regional conflicts.

Key Challenges:

  • High development and production costs.
  • Complex testing and validation procedures.
  • International arms control treaties and export controls. These restrictions impact market access and growth in certain regions, potentially reducing market size by xx Million units by 2033.

Emerging Opportunities in Supersonic vs Hypersonic Weapons Industry

This section focuses on untapped markets, innovative applications, and shifts in consumer (military) preferences, highlighting emerging opportunities for growth and investment.

  • Expansion into emerging markets with growing defense budgets.
  • Development of more affordable and easily deployable hypersonic weapons.
  • Integration of AI and machine learning for improved targeting and autonomous operation.

Growth Accelerators in the Supersonic vs Hypersonic Weapons Industry Industry

This section discusses the catalysts driving long-term growth, focusing on technological breakthroughs, strategic partnerships, and effective market expansion strategies.

Continued technological advancements, coupled with strategic collaborations between defense contractors and government agencies, are key factors in propelling the long-term growth of the supersonic and hypersonic weapons market. The development of advanced materials and propulsion systems, along with increased investment in research and development, are further fueling market expansion.

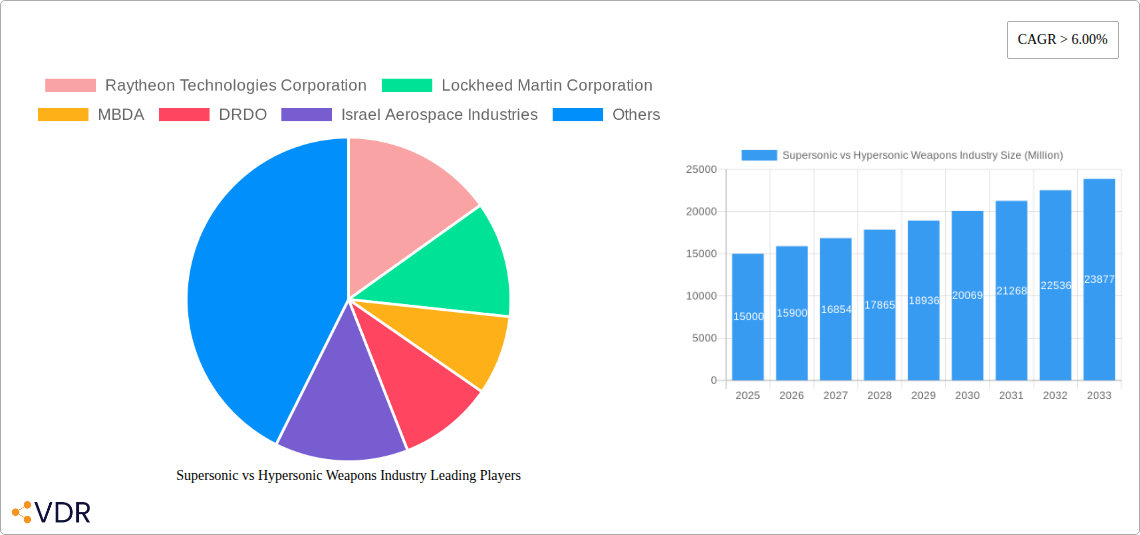
Key Players Shaping the Supersonic vs Hypersonic Weapons Industry Market

  • Raytheon Technologies Corporation
  • Lockheed Martin Corporation
  • MBDA
  • DRDO
  • Israel Aerospace Industries
  • Kongsberg Gruppen AS
  • ArianeGroup
  • Tactical Missiles Corporation
  • Northrop Grumman Corporation
  • The Boeing Company

Notable Milestones in Supersonic vs Hypersonic Weapons Industry Sector

  • 2020: Successful test flight of a hypersonic glide vehicle by [Country/Company].
  • 2021: Announcement of a significant investment in hypersonic weapon development by [Country/Company].
  • 2022: Deployment of a new supersonic missile system by [Country/Company].
  • 2023: Completion of a major M&A deal involving two key players in the hypersonic weapons sector.
  • 2024: Public release of a report detailing advancements in hypersonic weapon technology.

In-Depth Supersonic vs Hypersonic Weapons Industry Market Outlook

The future of the supersonic and hypersonic weapons market is promising, driven by continuous technological advancements and the increasing strategic importance of these weapon systems in modern warfare. The market is poised for substantial growth, driven by ongoing investments in research and development, strategic collaborations among major players, and the growing demand for advanced military capabilities. Continued innovation in propulsion systems, guidance technologies, and materials science will further propel market growth.

Supersonic vs Hypersonic Weapons Industry Segmentation

  • 1. Production Analysis
  • 2. Consumption Analysis
  • 3. Import Market Analysis (Value & Volume)
  • 4. Export Market Analysis (Value & Volume)
  • 5. Price Trend Analysis

Supersonic vs Hypersonic Weapons Industry Segmentation By Geography

  • 1. North America
    • 1.1. United States
    • 1.2. Canada
    • 1.3. Mexico
  • 2. South America
    • 2.1. Brazil
    • 2.2. Argentina
    • 2.3. Rest of South America
  • 3. Europe
    • 3.1. United Kingdom
    • 3.2. Germany
    • 3.3. France
    • 3.4. Italy
    • 3.5. Spain
    • 3.6. Russia
    • 3.7. Benelux
    • 3.8. Nordics
    • 3.9. Rest of Europe
  • 4. Middle East & Africa
    • 4.1. Turkey
    • 4.2. Israel
    • 4.3. GCC
    • 4.4. North Africa
    • 4.5. South Africa
    • 4.6. Rest of Middle East & Africa
  • 5. Asia Pacific
    • 5.1. China
    • 5.2. India
    • 5.3. Japan
    • 5.4. South Korea
    • 5.5. ASEAN
    • 5.6. Oceania
    • 5.7. Rest of Asia Pacific
Supersonic vs Hypersonic Weapons Industry Regional Share


Supersonic vs Hypersonic Weapons Industry REPORT HIGHLIGHTS

AspectsDetails
Study Period 2019-2033
Base Year 2024
Estimated Year 2025
Forecast Period2025-2033
Historical Period2019-2024
Growth RateCAGR of > 6.00% from 2019-2033
Segmentation
    • By Production Analysis
    • By Consumption Analysis
    • By Import Market Analysis (Value & Volume)
    • By Export Market Analysis (Value & Volume)
    • By Price Trend Analysis
  • By Geography
    • North America
      • United States
      • Canada
      • Mexico
    • South America
      • Brazil
      • Argentina
      • Rest of South America
    • Europe
      • United Kingdom
      • Germany
      • France
      • Italy
      • Spain
      • Russia
      • Benelux
      • Nordics
      • Rest of Europe
    • Middle East & Africa
      • Turkey
      • Israel
      • GCC
      • North Africa
      • South Africa
      • Rest of Middle East & Africa
    • Asia Pacific
      • China
      • India
      • Japan
      • South Korea
      • ASEAN
      • Oceania
      • Rest of Asia Pacific


Table of Contents

  1. 1. Introduction
    • 1.1. Research Scope
    • 1.2. Market Segmentation
    • 1.3. Research Methodology
    • 1.4. Definitions and Assumptions
  2. 2. Executive Summary
    • 2.1. Introduction
  3. 3. Market Dynamics
    • 3.1. Introduction
      • 3.2. Market Drivers
        • 3.2.1. Increase in Internet of Things (IoT) and Autonomous Systems; Rise in Demand for Military and Defense Satellite Communication Solutions
      • 3.3. Market Restrains
        • 3.3.1. Cybersecurity Threats to Satellite Communication; Interference in Transmission of Data
      • 3.4. Market Trends
        • 3.4.1. Missile Segment Registered the Highest Revenue Share in 2020
  4. 4. Market Factor Analysis
    • 4.1. Porters Five Forces
    • 4.2. Supply/Value Chain
    • 4.3. PESTEL analysis
    • 4.4. Market Entropy
    • 4.5. Patent/Trademark Analysis
  5. 5. Global Supersonic vs Hypersonic Weapons Industry Analysis, Insights and Forecast, 2019-2031
    • 5.1. Market Analysis, Insights and Forecast - by Production Analysis
      • 5.2. Market Analysis, Insights and Forecast - by Consumption Analysis
        • 5.3. Market Analysis, Insights and Forecast - by Import Market Analysis (Value & Volume)
          • 5.4. Market Analysis, Insights and Forecast - by Export Market Analysis (Value & Volume)
            • 5.5. Market Analysis, Insights and Forecast - by Price Trend Analysis
              • 5.6. Market Analysis, Insights and Forecast - by Region
                • 5.6.1. North America
                • 5.6.2. South America
                • 5.6.3. Europe
                • 5.6.4. Middle East & Africa
                • 5.6.5. Asia Pacific
            • 6. North America Supersonic vs Hypersonic Weapons Industry Analysis, Insights and Forecast, 2019-2031
              • 6.1. Market Analysis, Insights and Forecast - by Production Analysis
                • 6.2. Market Analysis, Insights and Forecast - by Consumption Analysis
                  • 6.3. Market Analysis, Insights and Forecast - by Import Market Analysis (Value & Volume)
                    • 6.4. Market Analysis, Insights and Forecast - by Export Market Analysis (Value & Volume)
                      • 6.5. Market Analysis, Insights and Forecast - by Price Trend Analysis
                      • 7. South America Supersonic vs Hypersonic Weapons Industry Analysis, Insights and Forecast, 2019-2031
                        • 7.1. Market Analysis, Insights and Forecast - by Production Analysis
                          • 7.2. Market Analysis, Insights and Forecast - by Consumption Analysis
                            • 7.3. Market Analysis, Insights and Forecast - by Import Market Analysis (Value & Volume)
                              • 7.4. Market Analysis, Insights and Forecast - by Export Market Analysis (Value & Volume)
                                • 7.5. Market Analysis, Insights and Forecast - by Price Trend Analysis
                                • 8. Europe Supersonic vs Hypersonic Weapons Industry Analysis, Insights and Forecast, 2019-2031
                                  • 8.1. Market Analysis, Insights and Forecast - by Production Analysis
                                    • 8.2. Market Analysis, Insights and Forecast - by Consumption Analysis
                                      • 8.3. Market Analysis, Insights and Forecast - by Import Market Analysis (Value & Volume)
                                        • 8.4. Market Analysis, Insights and Forecast - by Export Market Analysis (Value & Volume)
                                          • 8.5. Market Analysis, Insights and Forecast - by Price Trend Analysis
                                          • 9. Middle East & Africa Supersonic vs Hypersonic Weapons Industry Analysis, Insights and Forecast, 2019-2031
                                            • 9.1. Market Analysis, Insights and Forecast - by Production Analysis
                                              • 9.2. Market Analysis, Insights and Forecast - by Consumption Analysis
                                                • 9.3. Market Analysis, Insights and Forecast - by Import Market Analysis (Value & Volume)
                                                  • 9.4. Market Analysis, Insights and Forecast - by Export Market Analysis (Value & Volume)
                                                    • 9.5. Market Analysis, Insights and Forecast - by Price Trend Analysis
                                                    • 10. Asia Pacific Supersonic vs Hypersonic Weapons Industry Analysis, Insights and Forecast, 2019-2031
                                                      • 10.1. Market Analysis, Insights and Forecast - by Production Analysis
                                                        • 10.2. Market Analysis, Insights and Forecast - by Consumption Analysis
                                                          • 10.3. Market Analysis, Insights and Forecast - by Import Market Analysis (Value & Volume)
                                                            • 10.4. Market Analysis, Insights and Forecast - by Export Market Analysis (Value & Volume)
                                                              • 10.5. Market Analysis, Insights and Forecast - by Price Trend Analysis
                                                              • 11. North America Supersonic vs Hypersonic Weapons Industry Analysis, Insights and Forecast, 2019-2031
                                                                  • 11.1. Market Analysis, Insights and Forecast - By Country/Sub-region
                                                                    • 11.1.1 United States
                                                                    • 11.1.2 Canada
                                                              • 12. Europe Supersonic vs Hypersonic Weapons Industry Analysis, Insights and Forecast, 2019-2031
                                                                  • 12.1. Market Analysis, Insights and Forecast - By Country/Sub-region
                                                                    • 12.1.1 Germany
                                                                    • 12.1.2 United Kingdom
                                                                    • 12.1.3 France
                                                                    • 12.1.4 Russia
                                                                    • 12.1.5 Rest of Europe
                                                              • 13. Asia Pacific Supersonic vs Hypersonic Weapons Industry Analysis, Insights and Forecast, 2019-2031
                                                                  • 13.1. Market Analysis, Insights and Forecast - By Country/Sub-region
                                                                    • 13.1.1 China
                                                                    • 13.1.2 Japan
                                                                    • 13.1.3 India
                                                                    • 13.1.4 South Korea
                                                                    • 13.1.5 Rest of Asia Pacific
                                                              • 14. Latin America Supersonic vs Hypersonic Weapons Industry Analysis, Insights and Forecast, 2019-2031
                                                                  • 14.1. Market Analysis, Insights and Forecast - By Country/Sub-region
                                                                    • 14.1.1 Brazil
                                                                    • 14.1.2 Rest of Latin America
                                                              • 15. Middle East and Africa Supersonic vs Hypersonic Weapons Industry Analysis, Insights and Forecast, 2019-2031
                                                                  • 15.1. Market Analysis, Insights and Forecast - By Country/Sub-region
                                                                    • 15.1.1 Saudi Arabia
                                                                    • 15.1.2 Israel
                                                                    • 15.1.3 Rest of Middle East and Africa
                                                              • 16. Competitive Analysis
                                                                • 16.1. Global Market Share Analysis 2024
                                                                  • 16.2. Company Profiles
                                                                    • 16.2.1 Raytheon Technologies Corporation
                                                                      • 16.2.1.1. Overview
                                                                      • 16.2.1.2. Products
                                                                      • 16.2.1.3. SWOT Analysis
                                                                      • 16.2.1.4. Recent Developments
                                                                      • 16.2.1.5. Financials (Based on Availability)
                                                                    • 16.2.2 Lockheed Martin Corporation
                                                                      • 16.2.2.1. Overview
                                                                      • 16.2.2.2. Products
                                                                      • 16.2.2.3. SWOT Analysis
                                                                      • 16.2.2.4. Recent Developments
                                                                      • 16.2.2.5. Financials (Based on Availability)
                                                                    • 16.2.3 MBDA
                                                                      • 16.2.3.1. Overview
                                                                      • 16.2.3.2. Products
                                                                      • 16.2.3.3. SWOT Analysis
                                                                      • 16.2.3.4. Recent Developments
                                                                      • 16.2.3.5. Financials (Based on Availability)
                                                                    • 16.2.4 DRDO
                                                                      • 16.2.4.1. Overview
                                                                      • 16.2.4.2. Products
                                                                      • 16.2.4.3. SWOT Analysis
                                                                      • 16.2.4.4. Recent Developments
                                                                      • 16.2.4.5. Financials (Based on Availability)
                                                                    • 16.2.5 Israel Aerospace Industries
                                                                      • 16.2.5.1. Overview
                                                                      • 16.2.5.2. Products
                                                                      • 16.2.5.3. SWOT Analysis
                                                                      • 16.2.5.4. Recent Developments
                                                                      • 16.2.5.5. Financials (Based on Availability)
                                                                    • 16.2.6 Kongsberg Gruppen AS
                                                                      • 16.2.6.1. Overview
                                                                      • 16.2.6.2. Products
                                                                      • 16.2.6.3. SWOT Analysis
                                                                      • 16.2.6.4. Recent Developments
                                                                      • 16.2.6.5. Financials (Based on Availability)
                                                                    • 16.2.7 ArianeGrou
                                                                      • 16.2.7.1. Overview
                                                                      • 16.2.7.2. Products
                                                                      • 16.2.7.3. SWOT Analysis
                                                                      • 16.2.7.4. Recent Developments
                                                                      • 16.2.7.5. Financials (Based on Availability)
                                                                    • 16.2.8 Tactical Missiles Corporation
                                                                      • 16.2.8.1. Overview
                                                                      • 16.2.8.2. Products
                                                                      • 16.2.8.3. SWOT Analysis
                                                                      • 16.2.8.4. Recent Developments
                                                                      • 16.2.8.5. Financials (Based on Availability)
                                                                    • 16.2.9 Northrop Grumman Corporation
                                                                      • 16.2.9.1. Overview
                                                                      • 16.2.9.2. Products
                                                                      • 16.2.9.3. SWOT Analysis
                                                                      • 16.2.9.4. Recent Developments
                                                                      • 16.2.9.5. Financials (Based on Availability)
                                                                    • 16.2.10 The Boeing Company
                                                                      • 16.2.10.1. Overview
                                                                      • 16.2.10.2. Products
                                                                      • 16.2.10.3. SWOT Analysis
                                                                      • 16.2.10.4. Recent Developments
                                                                      • 16.2.10.5. Financials (Based on Availability)

                                                              List of Figures

                                                              1. Figure 1: Global Supersonic vs Hypersonic Weapons Industry Revenue Breakdown (Million, %) by Region 2024 & 2032
                                                              2. Figure 2: North America Supersonic vs Hypersonic Weapons Industry Revenue (Million), by Country 2024 & 2032
                                                              3. Figure 3: North America Supersonic vs Hypersonic Weapons Industry Revenue Share (%), by Country 2024 & 2032
                                                              4. Figure 4: Europe Supersonic vs Hypersonic Weapons Industry Revenue (Million), by Country 2024 & 2032
                                                              5. Figure 5: Europe Supersonic vs Hypersonic Weapons Industry Revenue Share (%), by Country 2024 & 2032
                                                              6. Figure 6: Asia Pacific Supersonic vs Hypersonic Weapons Industry Revenue (Million), by Country 2024 & 2032
                                                              7. Figure 7: Asia Pacific Supersonic vs Hypersonic Weapons Industry Revenue Share (%), by Country 2024 & 2032
                                                              8. Figure 8: Latin America Supersonic vs Hypersonic Weapons Industry Revenue (Million), by Country 2024 & 2032
                                                              9. Figure 9: Latin America Supersonic vs Hypersonic Weapons Industry Revenue Share (%), by Country 2024 & 2032
                                                              10. Figure 10: Middle East and Africa Supersonic vs Hypersonic Weapons Industry Revenue (Million), by Country 2024 & 2032
                                                              11. Figure 11: Middle East and Africa Supersonic vs Hypersonic Weapons Industry Revenue Share (%), by Country 2024 & 2032
                                                              12. Figure 12: North America Supersonic vs Hypersonic Weapons Industry Revenue (Million), by Production Analysis 2024 & 2032
                                                              13. Figure 13: North America Supersonic vs Hypersonic Weapons Industry Revenue Share (%), by Production Analysis 2024 & 2032
                                                              14. Figure 14: North America Supersonic vs Hypersonic Weapons Industry Revenue (Million), by Consumption Analysis 2024 & 2032
                                                              15. Figure 15: North America Supersonic vs Hypersonic Weapons Industry Revenue Share (%), by Consumption Analysis 2024 & 2032
                                                              16. Figure 16: North America Supersonic vs Hypersonic Weapons Industry Revenue (Million), by Import Market Analysis (Value & Volume) 2024 & 2032
                                                              17. Figure 17: North America Supersonic vs Hypersonic Weapons Industry Revenue Share (%), by Import Market Analysis (Value & Volume) 2024 & 2032
                                                              18. Figure 18: North America Supersonic vs Hypersonic Weapons Industry Revenue (Million), by Export Market Analysis (Value & Volume) 2024 & 2032
                                                              19. Figure 19: North America Supersonic vs Hypersonic Weapons Industry Revenue Share (%), by Export Market Analysis (Value & Volume) 2024 & 2032
                                                              20. Figure 20: North America Supersonic vs Hypersonic Weapons Industry Revenue (Million), by Price Trend Analysis 2024 & 2032
                                                              21. Figure 21: North America Supersonic vs Hypersonic Weapons Industry Revenue Share (%), by Price Trend Analysis 2024 & 2032
                                                              22. Figure 22: North America Supersonic vs Hypersonic Weapons Industry Revenue (Million), by Country 2024 & 2032
                                                              23. Figure 23: North America Supersonic vs Hypersonic Weapons Industry Revenue Share (%), by Country 2024 & 2032
                                                              24. Figure 24: South America Supersonic vs Hypersonic Weapons Industry Revenue (Million), by Production Analysis 2024 & 2032
                                                              25. Figure 25: South America Supersonic vs Hypersonic Weapons Industry Revenue Share (%), by Production Analysis 2024 & 2032
                                                              26. Figure 26: South America Supersonic vs Hypersonic Weapons Industry Revenue (Million), by Consumption Analysis 2024 & 2032
                                                              27. Figure 27: South America Supersonic vs Hypersonic Weapons Industry Revenue Share (%), by Consumption Analysis 2024 & 2032
                                                              28. Figure 28: South America Supersonic vs Hypersonic Weapons Industry Revenue (Million), by Import Market Analysis (Value & Volume) 2024 & 2032
                                                              29. Figure 29: South America Supersonic vs Hypersonic Weapons Industry Revenue Share (%), by Import Market Analysis (Value & Volume) 2024 & 2032
                                                              30. Figure 30: South America Supersonic vs Hypersonic Weapons Industry Revenue (Million), by Export Market Analysis (Value & Volume) 2024 & 2032
                                                              31. Figure 31: South America Supersonic vs Hypersonic Weapons Industry Revenue Share (%), by Export Market Analysis (Value & Volume) 2024 & 2032
                                                              32. Figure 32: South America Supersonic vs Hypersonic Weapons Industry Revenue (Million), by Price Trend Analysis 2024 & 2032
                                                              33. Figure 33: South America Supersonic vs Hypersonic Weapons Industry Revenue Share (%), by Price Trend Analysis 2024 & 2032
                                                              34. Figure 34: South America Supersonic vs Hypersonic Weapons Industry Revenue (Million), by Country 2024 & 2032
                                                              35. Figure 35: South America Supersonic vs Hypersonic Weapons Industry Revenue Share (%), by Country 2024 & 2032
                                                              36. Figure 36: Europe Supersonic vs Hypersonic Weapons Industry Revenue (Million), by Production Analysis 2024 & 2032
                                                              37. Figure 37: Europe Supersonic vs Hypersonic Weapons Industry Revenue Share (%), by Production Analysis 2024 & 2032
                                                              38. Figure 38: Europe Supersonic vs Hypersonic Weapons Industry Revenue (Million), by Consumption Analysis 2024 & 2032
                                                              39. Figure 39: Europe Supersonic vs Hypersonic Weapons Industry Revenue Share (%), by Consumption Analysis 2024 & 2032
                                                              40. Figure 40: Europe Supersonic vs Hypersonic Weapons Industry Revenue (Million), by Import Market Analysis (Value & Volume) 2024 & 2032
                                                              41. Figure 41: Europe Supersonic vs Hypersonic Weapons Industry Revenue Share (%), by Import Market Analysis (Value & Volume) 2024 & 2032
                                                              42. Figure 42: Europe Supersonic vs Hypersonic Weapons Industry Revenue (Million), by Export Market Analysis (Value & Volume) 2024 & 2032
                                                              43. Figure 43: Europe Supersonic vs Hypersonic Weapons Industry Revenue Share (%), by Export Market Analysis (Value & Volume) 2024 & 2032
                                                              44. Figure 44: Europe Supersonic vs Hypersonic Weapons Industry Revenue (Million), by Price Trend Analysis 2024 & 2032
                                                              45. Figure 45: Europe Supersonic vs Hypersonic Weapons Industry Revenue Share (%), by Price Trend Analysis 2024 & 2032
                                                              46. Figure 46: Europe Supersonic vs Hypersonic Weapons Industry Revenue (Million), by Country 2024 & 2032
                                                              47. Figure 47: Europe Supersonic vs Hypersonic Weapons Industry Revenue Share (%), by Country 2024 & 2032
                                                              48. Figure 48: Middle East & Africa Supersonic vs Hypersonic Weapons Industry Revenue (Million), by Production Analysis 2024 & 2032
                                                              49. Figure 49: Middle East & Africa Supersonic vs Hypersonic Weapons Industry Revenue Share (%), by Production Analysis 2024 & 2032
                                                              50. Figure 50: Middle East & Africa Supersonic vs Hypersonic Weapons Industry Revenue (Million), by Consumption Analysis 2024 & 2032
                                                              51. Figure 51: Middle East & Africa Supersonic vs Hypersonic Weapons Industry Revenue Share (%), by Consumption Analysis 2024 & 2032
                                                              52. Figure 52: Middle East & Africa Supersonic vs Hypersonic Weapons Industry Revenue (Million), by Import Market Analysis (Value & Volume) 2024 & 2032
                                                              53. Figure 53: Middle East & Africa Supersonic vs Hypersonic Weapons Industry Revenue Share (%), by Import Market Analysis (Value & Volume) 2024 & 2032
                                                              54. Figure 54: Middle East & Africa Supersonic vs Hypersonic Weapons Industry Revenue (Million), by Export Market Analysis (Value & Volume) 2024 & 2032
                                                              55. Figure 55: Middle East & Africa Supersonic vs Hypersonic Weapons Industry Revenue Share (%), by Export Market Analysis (Value & Volume) 2024 & 2032
                                                              56. Figure 56: Middle East & Africa Supersonic vs Hypersonic Weapons Industry Revenue (Million), by Price Trend Analysis 2024 & 2032
                                                              57. Figure 57: Middle East & Africa Supersonic vs Hypersonic Weapons Industry Revenue Share (%), by Price Trend Analysis 2024 & 2032
                                                              58. Figure 58: Middle East & Africa Supersonic vs Hypersonic Weapons Industry Revenue (Million), by Country 2024 & 2032
                                                              59. Figure 59: Middle East & Africa Supersonic vs Hypersonic Weapons Industry Revenue Share (%), by Country 2024 & 2032
                                                              60. Figure 60: Asia Pacific Supersonic vs Hypersonic Weapons Industry Revenue (Million), by Production Analysis 2024 & 2032
                                                              61. Figure 61: Asia Pacific Supersonic vs Hypersonic Weapons Industry Revenue Share (%), by Production Analysis 2024 & 2032
                                                              62. Figure 62: Asia Pacific Supersonic vs Hypersonic Weapons Industry Revenue (Million), by Consumption Analysis 2024 & 2032
                                                              63. Figure 63: Asia Pacific Supersonic vs Hypersonic Weapons Industry Revenue Share (%), by Consumption Analysis 2024 & 2032
                                                              64. Figure 64: Asia Pacific Supersonic vs Hypersonic Weapons Industry Revenue (Million), by Import Market Analysis (Value & Volume) 2024 & 2032
                                                              65. Figure 65: Asia Pacific Supersonic vs Hypersonic Weapons Industry Revenue Share (%), by Import Market Analysis (Value & Volume) 2024 & 2032
                                                              66. Figure 66: Asia Pacific Supersonic vs Hypersonic Weapons Industry Revenue (Million), by Export Market Analysis (Value & Volume) 2024 & 2032
                                                              67. Figure 67: Asia Pacific Supersonic vs Hypersonic Weapons Industry Revenue Share (%), by Export Market Analysis (Value & Volume) 2024 & 2032
                                                              68. Figure 68: Asia Pacific Supersonic vs Hypersonic Weapons Industry Revenue (Million), by Price Trend Analysis 2024 & 2032
                                                              69. Figure 69: Asia Pacific Supersonic vs Hypersonic Weapons Industry Revenue Share (%), by Price Trend Analysis 2024 & 2032
                                                              70. Figure 70: Asia Pacific Supersonic vs Hypersonic Weapons Industry Revenue (Million), by Country 2024 & 2032
                                                              71. Figure 71: Asia Pacific Supersonic vs Hypersonic Weapons Industry Revenue Share (%), by Country 2024 & 2032

                                                              List of Tables

                                                              1. Table 1: Global Supersonic vs Hypersonic Weapons Industry Revenue Million Forecast, by Region 2019 & 2032
                                                              2. Table 2: Global Supersonic vs Hypersonic Weapons Industry Revenue Million Forecast, by Production Analysis 2019 & 2032
                                                              3. Table 3: Global Supersonic vs Hypersonic Weapons Industry Revenue Million Forecast, by Consumption Analysis 2019 & 2032
                                                              4. Table 4: Global Supersonic vs Hypersonic Weapons Industry Revenue Million Forecast, by Import Market Analysis (Value & Volume) 2019 & 2032
                                                              5. Table 5: Global Supersonic vs Hypersonic Weapons Industry Revenue Million Forecast, by Export Market Analysis (Value & Volume) 2019 & 2032
                                                              6. Table 6: Global Supersonic vs Hypersonic Weapons Industry Revenue Million Forecast, by Price Trend Analysis 2019 & 2032
                                                              7. Table 7: Global Supersonic vs Hypersonic Weapons Industry Revenue Million Forecast, by Region 2019 & 2032
                                                              8. Table 8: Global Supersonic vs Hypersonic Weapons Industry Revenue Million Forecast, by Country 2019 & 2032
                                                              9. Table 9: United States Supersonic vs Hypersonic Weapons Industry Revenue (Million) Forecast, by Application 2019 & 2032
                                                              10. Table 10: Canada Supersonic vs Hypersonic Weapons Industry Revenue (Million) Forecast, by Application 2019 & 2032
                                                              11. Table 11: Global Supersonic vs Hypersonic Weapons Industry Revenue Million Forecast, by Country 2019 & 2032
                                                              12. Table 12: Germany Supersonic vs Hypersonic Weapons Industry Revenue (Million) Forecast, by Application 2019 & 2032
                                                              13. Table 13: United Kingdom Supersonic vs Hypersonic Weapons Industry Revenue (Million) Forecast, by Application 2019 & 2032
                                                              14. Table 14: France Supersonic vs Hypersonic Weapons Industry Revenue (Million) Forecast, by Application 2019 & 2032
                                                              15. Table 15: Russia Supersonic vs Hypersonic Weapons Industry Revenue (Million) Forecast, by Application 2019 & 2032
                                                              16. Table 16: Rest of Europe Supersonic vs Hypersonic Weapons Industry Revenue (Million) Forecast, by Application 2019 & 2032
                                                              17. Table 17: Global Supersonic vs Hypersonic Weapons Industry Revenue Million Forecast, by Country 2019 & 2032
                                                              18. Table 18: China Supersonic vs Hypersonic Weapons Industry Revenue (Million) Forecast, by Application 2019 & 2032
                                                              19. Table 19: Japan Supersonic vs Hypersonic Weapons Industry Revenue (Million) Forecast, by Application 2019 & 2032
                                                              20. Table 20: India Supersonic vs Hypersonic Weapons Industry Revenue (Million) Forecast, by Application 2019 & 2032
                                                              21. Table 21: South Korea Supersonic vs Hypersonic Weapons Industry Revenue (Million) Forecast, by Application 2019 & 2032
                                                              22. Table 22: Rest of Asia Pacific Supersonic vs Hypersonic Weapons Industry Revenue (Million) Forecast, by Application 2019 & 2032
                                                              23. Table 23: Global Supersonic vs Hypersonic Weapons Industry Revenue Million Forecast, by Country 2019 & 2032
                                                              24. Table 24: Brazil Supersonic vs Hypersonic Weapons Industry Revenue (Million) Forecast, by Application 2019 & 2032
                                                              25. Table 25: Rest of Latin America Supersonic vs Hypersonic Weapons Industry Revenue (Million) Forecast, by Application 2019 & 2032
                                                              26. Table 26: Global Supersonic vs Hypersonic Weapons Industry Revenue Million Forecast, by Country 2019 & 2032
                                                              27. Table 27: Saudi Arabia Supersonic vs Hypersonic Weapons Industry Revenue (Million) Forecast, by Application 2019 & 2032
                                                              28. Table 28: Israel Supersonic vs Hypersonic Weapons Industry Revenue (Million) Forecast, by Application 2019 & 2032
                                                              29. Table 29: Rest of Middle East and Africa Supersonic vs Hypersonic Weapons Industry Revenue (Million) Forecast, by Application 2019 & 2032
                                                              30. Table 30: Global Supersonic vs Hypersonic Weapons Industry Revenue Million Forecast, by Production Analysis 2019 & 2032
                                                              31. Table 31: Global Supersonic vs Hypersonic Weapons Industry Revenue Million Forecast, by Consumption Analysis 2019 & 2032
                                                              32. Table 32: Global Supersonic vs Hypersonic Weapons Industry Revenue Million Forecast, by Import Market Analysis (Value & Volume) 2019 & 2032
                                                              33. Table 33: Global Supersonic vs Hypersonic Weapons Industry Revenue Million Forecast, by Export Market Analysis (Value & Volume) 2019 & 2032
                                                              34. Table 34: Global Supersonic vs Hypersonic Weapons Industry Revenue Million Forecast, by Price Trend Analysis 2019 & 2032
                                                              35. Table 35: Global Supersonic vs Hypersonic Weapons Industry Revenue Million Forecast, by Country 2019 & 2032
                                                              36. Table 36: United States Supersonic vs Hypersonic Weapons Industry Revenue (Million) Forecast, by Application 2019 & 2032
                                                              37. Table 37: Canada Supersonic vs Hypersonic Weapons Industry Revenue (Million) Forecast, by Application 2019 & 2032
                                                              38. Table 38: Mexico Supersonic vs Hypersonic Weapons Industry Revenue (Million) Forecast, by Application 2019 & 2032
                                                              39. Table 39: Global Supersonic vs Hypersonic Weapons Industry Revenue Million Forecast, by Production Analysis 2019 & 2032
                                                              40. Table 40: Global Supersonic vs Hypersonic Weapons Industry Revenue Million Forecast, by Consumption Analysis 2019 & 2032
                                                              41. Table 41: Global Supersonic vs Hypersonic Weapons Industry Revenue Million Forecast, by Import Market Analysis (Value & Volume) 2019 & 2032
                                                              42. Table 42: Global Supersonic vs Hypersonic Weapons Industry Revenue Million Forecast, by Export Market Analysis (Value & Volume) 2019 & 2032
                                                              43. Table 43: Global Supersonic vs Hypersonic Weapons Industry Revenue Million Forecast, by Price Trend Analysis 2019 & 2032
                                                              44. Table 44: Global Supersonic vs Hypersonic Weapons Industry Revenue Million Forecast, by Country 2019 & 2032
                                                              45. Table 45: Brazil Supersonic vs Hypersonic Weapons Industry Revenue (Million) Forecast, by Application 2019 & 2032
                                                              46. Table 46: Argentina Supersonic vs Hypersonic Weapons Industry Revenue (Million) Forecast, by Application 2019 & 2032
                                                              47. Table 47: Rest of South America Supersonic vs Hypersonic Weapons Industry Revenue (Million) Forecast, by Application 2019 & 2032
                                                              48. Table 48: Global Supersonic vs Hypersonic Weapons Industry Revenue Million Forecast, by Production Analysis 2019 & 2032
                                                              49. Table 49: Global Supersonic vs Hypersonic Weapons Industry Revenue Million Forecast, by Consumption Analysis 2019 & 2032
                                                              50. Table 50: Global Supersonic vs Hypersonic Weapons Industry Revenue Million Forecast, by Import Market Analysis (Value & Volume) 2019 & 2032
                                                              51. Table 51: Global Supersonic vs Hypersonic Weapons Industry Revenue Million Forecast, by Export Market Analysis (Value & Volume) 2019 & 2032
                                                              52. Table 52: Global Supersonic vs Hypersonic Weapons Industry Revenue Million Forecast, by Price Trend Analysis 2019 & 2032
                                                              53. Table 53: Global Supersonic vs Hypersonic Weapons Industry Revenue Million Forecast, by Country 2019 & 2032
                                                              54. Table 54: United Kingdom Supersonic vs Hypersonic Weapons Industry Revenue (Million) Forecast, by Application 2019 & 2032
                                                              55. Table 55: Germany Supersonic vs Hypersonic Weapons Industry Revenue (Million) Forecast, by Application 2019 & 2032
                                                              56. Table 56: France Supersonic vs Hypersonic Weapons Industry Revenue (Million) Forecast, by Application 2019 & 2032
                                                              57. Table 57: Italy Supersonic vs Hypersonic Weapons Industry Revenue (Million) Forecast, by Application 2019 & 2032
                                                              58. Table 58: Spain Supersonic vs Hypersonic Weapons Industry Revenue (Million) Forecast, by Application 2019 & 2032
                                                              59. Table 59: Russia Supersonic vs Hypersonic Weapons Industry Revenue (Million) Forecast, by Application 2019 & 2032
                                                              60. Table 60: Benelux Supersonic vs Hypersonic Weapons Industry Revenue (Million) Forecast, by Application 2019 & 2032
                                                              61. Table 61: Nordics Supersonic vs Hypersonic Weapons Industry Revenue (Million) Forecast, by Application 2019 & 2032
                                                              62. Table 62: Rest of Europe Supersonic vs Hypersonic Weapons Industry Revenue (Million) Forecast, by Application 2019 & 2032
                                                              63. Table 63: Global Supersonic vs Hypersonic Weapons Industry Revenue Million Forecast, by Production Analysis 2019 & 2032
                                                              64. Table 64: Global Supersonic vs Hypersonic Weapons Industry Revenue Million Forecast, by Consumption Analysis 2019 & 2032
                                                              65. Table 65: Global Supersonic vs Hypersonic Weapons Industry Revenue Million Forecast, by Import Market Analysis (Value & Volume) 2019 & 2032
                                                              66. Table 66: Global Supersonic vs Hypersonic Weapons Industry Revenue Million Forecast, by Export Market Analysis (Value & Volume) 2019 & 2032
                                                              67. Table 67: Global Supersonic vs Hypersonic Weapons Industry Revenue Million Forecast, by Price Trend Analysis 2019 & 2032
                                                              68. Table 68: Global Supersonic vs Hypersonic Weapons Industry Revenue Million Forecast, by Country 2019 & 2032
                                                              69. Table 69: Turkey Supersonic vs Hypersonic Weapons Industry Revenue (Million) Forecast, by Application 2019 & 2032
                                                              70. Table 70: Israel Supersonic vs Hypersonic Weapons Industry Revenue (Million) Forecast, by Application 2019 & 2032
                                                              71. Table 71: GCC Supersonic vs Hypersonic Weapons Industry Revenue (Million) Forecast, by Application 2019 & 2032
                                                              72. Table 72: North Africa Supersonic vs Hypersonic Weapons Industry Revenue (Million) Forecast, by Application 2019 & 2032
                                                              73. Table 73: South Africa Supersonic vs Hypersonic Weapons Industry Revenue (Million) Forecast, by Application 2019 & 2032
                                                              74. Table 74: Rest of Middle East & Africa Supersonic vs Hypersonic Weapons Industry Revenue (Million) Forecast, by Application 2019 & 2032
                                                              75. Table 75: Global Supersonic vs Hypersonic Weapons Industry Revenue Million Forecast, by Production Analysis 2019 & 2032
                                                              76. Table 76: Global Supersonic vs Hypersonic Weapons Industry Revenue Million Forecast, by Consumption Analysis 2019 & 2032
                                                              77. Table 77: Global Supersonic vs Hypersonic Weapons Industry Revenue Million Forecast, by Import Market Analysis (Value & Volume) 2019 & 2032
                                                              78. Table 78: Global Supersonic vs Hypersonic Weapons Industry Revenue Million Forecast, by Export Market Analysis (Value & Volume) 2019 & 2032
                                                              79. Table 79: Global Supersonic vs Hypersonic Weapons Industry Revenue Million Forecast, by Price Trend Analysis 2019 & 2032
                                                              80. Table 80: Global Supersonic vs Hypersonic Weapons Industry Revenue Million Forecast, by Country 2019 & 2032
                                                              81. Table 81: China Supersonic vs Hypersonic Weapons Industry Revenue (Million) Forecast, by Application 2019 & 2032
                                                              82. Table 82: India Supersonic vs Hypersonic Weapons Industry Revenue (Million) Forecast, by Application 2019 & 2032
                                                              83. Table 83: Japan Supersonic vs Hypersonic Weapons Industry Revenue (Million) Forecast, by Application 2019 & 2032
                                                              84. Table 84: South Korea Supersonic vs Hypersonic Weapons Industry Revenue (Million) Forecast, by Application 2019 & 2032
                                                              85. Table 85: ASEAN Supersonic vs Hypersonic Weapons Industry Revenue (Million) Forecast, by Application 2019 & 2032
                                                              86. Table 86: Oceania Supersonic vs Hypersonic Weapons Industry Revenue (Million) Forecast, by Application 2019 & 2032
                                                              87. Table 87: Rest of Asia Pacific Supersonic vs Hypersonic Weapons Industry Revenue (Million) Forecast, by Application 2019 & 2032


                                                              Frequently Asked Questions

                                                              1. What is the projected Compound Annual Growth Rate (CAGR) of the Supersonic vs Hypersonic Weapons Industry?

                                                              The projected CAGR is approximately > 6.00%.

                                                              2. Which companies are prominent players in the Supersonic vs Hypersonic Weapons Industry?

                                                              Key companies in the market include Raytheon Technologies Corporation, Lockheed Martin Corporation, MBDA, DRDO, Israel Aerospace Industries, Kongsberg Gruppen AS, ArianeGrou, Tactical Missiles Corporation, Northrop Grumman Corporation, The Boeing Company.

                                                              3. What are the main segments of the Supersonic vs Hypersonic Weapons Industry?

                                                              The market segments include Production Analysis, Consumption Analysis, Import Market Analysis (Value & Volume), Export Market Analysis (Value & Volume), Price Trend Analysis.

                                                              4. Can you provide details about the market size?

                                                              The market size is estimated to be USD XX Million as of 2022.

                                                              5. What are some drivers contributing to market growth?

                                                              Increase in Internet of Things (IoT) and Autonomous Systems; Rise in Demand for Military and Defense Satellite Communication Solutions.

                                                              6. What are the notable trends driving market growth?

                                                              Missile Segment Registered the Highest Revenue Share in 2020.

                                                              7. Are there any restraints impacting market growth?

                                                              Cybersecurity Threats to Satellite Communication; Interference in Transmission of Data.

                                                              8. Can you provide examples of recent developments in the market?

                                                              N/A

                                                              9. What pricing options are available for accessing the report?

                                                              Pricing options include single-user, multi-user, and enterprise licenses priced at USD 4750, USD 5250, and USD 8750 respectively.

                                                              10. Is the market size provided in terms of value or volume?

                                                              The market size is provided in terms of value, measured in Million.

                                                              11. Are there any specific market keywords associated with the report?

                                                              Yes, the market keyword associated with the report is "Supersonic vs Hypersonic Weapons Industry," which aids in identifying and referencing the specific market segment covered.

                                                              12. How do I determine which pricing option suits my needs best?

                                                              The pricing options vary based on user requirements and access needs. Individual users may opt for single-user licenses, while businesses requiring broader access may choose multi-user or enterprise licenses for cost-effective access to the report.

                                                              13. Are there any additional resources or data provided in the Supersonic vs Hypersonic Weapons Industry report?

                                                              While the report offers comprehensive insights, it's advisable to review the specific contents or supplementary materials provided to ascertain if additional resources or data are available.

                                                              14. How can I stay updated on further developments or reports in the Supersonic vs Hypersonic Weapons Industry?

                                                              To stay informed about further developments, trends, and reports in the Supersonic vs Hypersonic Weapons Industry, consider subscribing to industry newsletters, following relevant companies and organizations, or regularly checking reputable industry news sources and publications.


                                                              Methodology

                                                              Step 1 - Identification of Relevant Samples Size from Population Database

                                                              Step Chart
                                                              Bar Chart
                                                              Method Chart

                                                              Step 2 - Approaches for Defining Global Market Size (Value, Volume* & Price*)

                                                              Approach Chart
                                                              Top-down and bottom-up approaches are used to validate the global market size and estimate the market size for manufactures, regional segments, product, and application.

                                                              Note*: In applicable scenarios

                                                              Step 3 - Data Sources

                                                              Primary Research

                                                              • Web Analytics
                                                              • Survey Reports
                                                              • Research Institute
                                                              • Latest Research Reports
                                                              • Opinion Leaders

                                                              Secondary Research

                                                              • Annual Reports
                                                              • White Paper
                                                              • Latest Press Release
                                                              • Industry Association
                                                              • Paid Database
                                                              • Investor Presentations
                                                              Analyst Chart

                                                              Step 4 - Data Triangulation

                                                              Involves using different sources of information in order to increase the validity of a study

                                                              These sources are likely to be stakeholders in a program - participants, other researchers, program staff, other community members, and so on.

                                                              Then we put all data in single framework & apply various statistical tools to find out the dynamic on the market.

                                                              During the analysis stage, feedback from the stakeholder groups would be compared to determine areas of agreement as well as areas of divergence

                                                              Additionally, after gathering mixed and scattered data from a wide range of sources, data is triangulated and correlated to come up with estimated figures which are further validated through primary mediums or industry experts, opinion leaders.

                                                              About Visionary Data Reports

                                                              Visionary Data Reports provides future-focused market research, advanced analytics, and strategic insights for technology, healthcare, green energy, and finance. Our reports help you anticipate trends, innovate, and lead in your industry. Our expert team combines primary research, data science, and industry knowledge to deliver actionable intelligence. We offer syndicated reports, custom analytics, and consulting services tailored to your business needs. At Visionary Data Reports, we are committed to quality, transparency, and client satisfaction. Every report is rigorously validated to ensure accuracy and relevance. Our global perspective and forward-thinking approach help you understand both current and emerging market dynamics.

                                                              Stay ahead with Visionary Data Reports. Subscribe to our newsletter for the latest insights and research highlights, and follow us on social media for real-time updates. Visionary Data Reports – Your Guide to Tomorrow’s Opportunities.

                                                              artwork spiralartwork spiralRelated Reports
                                                              artwork underline

                                                              Consumer Trends Driving Private Jet Charter Services Market Market Growth

                                                              Discover the booming private jet charter services market! This comprehensive analysis reveals a $15.27B market (2025) expanding at a 13.92% CAGR, driven by HNWIs, personalized travel, and tech advancements. Explore regional breakdowns, key players, and future trends.

                                                              July 2025
                                                              Base Year: 2024
                                                              No Of Pages: 234
                                                              Price: $4750

                                                              Analyzing MEA Armored Personnel Carrier Market: Opportunities and Growth Patterns 2025-2033

                                                              The MEA Armored Personnel Carrier (APC) market is booming, driven by regional conflicts and military modernization. Discover key market trends, leading players (NIMR, BMC Otomotiv, Oshkosh), and growth projections to 2033 in this comprehensive market analysis. Explore segmentations by APC type (MBT, IFV, APC) and regional breakdowns.

                                                              July 2025
                                                              Base Year: 2024
                                                              No Of Pages: 234
                                                              Price: $4750

                                                              Firearm Sight Market Market Expansion: Growth Outlook 2025-2033

                                                              The global firearm sight market is booming, projected to reach \$2.37 billion by 2033 with a CAGR of 4.62%. Driven by military spending, hunting, and law enforcement needs, this market is segmented by sight type (telescopic, reflex, laser) and weapon type. Key players like EOTECH, Holosun, and Aimpoint are shaping this dynamic industry. Explore market trends and growth projections now!

                                                              July 2025
                                                              Base Year: 2024
                                                              No Of Pages: 234
                                                              Price: $4750

                                                              Analyzing the Future of Aircraft Fire Protection System Industry: Key Trends to 2033

                                                              The Aircraft Fire Protection System market is booming, projected to reach $2.145 billion by 2033 with a 5.45% CAGR. Discover key drivers, trends, restraints, and leading companies shaping this crucial aviation safety sector. Explore market segmentation by aircraft type and application.

                                                              July 2025
                                                              Base Year: 2024
                                                              No Of Pages: 234
                                                              Price: $4750

                                                              C4ISR Systems Industry Future Pathways: Strategic Insights to 2033

                                                              The C4ISR Systems market is booming, projected to reach [estimated 2033 market size] by 2033, driven by escalating geopolitical tensions and defense modernization. Explore market trends, key players (Lockheed Martin, Boeing, Thales), and regional growth forecasts in this comprehensive analysis.

                                                              July 2025
                                                              Base Year: 2024
                                                              No Of Pages: 234
                                                              Price: $4750

                                                              Defense Market in Colombia Decoded: Comprehensive Analysis and Forecasts 2025-2033

                                                              Discover the growth trajectory of Colombia's defense market, projected to reach [Value in 2033, calculated from CAGR] by 2033. This in-depth analysis explores market drivers, trends, restraints, and key players including Textron, Lockheed Martin, and Boeing, highlighting lucrative opportunities in this dynamic sector.

                                                              July 2025
                                                              Base Year: 2024
                                                              No Of Pages: 197
                                                              Price: $3800

                                                              Asia-Pacific Border Security Market Future-Proofing Growth: Strategic Insights and Analysis 2025-2033

                                                              The Asia-Pacific border security market is booming, projected to reach \$30.27 billion by 2033, driven by rising geopolitical tensions and technological advancements in C4ISR, radar, and biometric systems. Explore market trends, key players, and regional insights in this comprehensive analysis.

                                                              July 2025
                                                              Base Year: 2024
                                                              No Of Pages: 234
                                                              Price: $4750

                                                              Challenges to Overcome in Attack Helicopter Market Market Growth: Analysis 2025-2033

                                                              The global attack helicopter market is booming, projected to exceed $XX million by 2033 with a CAGR of over 4%. Driven by geopolitical tensions and technological advancements, this report analyzes market trends, key players (Lockheed Martin, Boeing, Airbus), regional growth (North America, Asia-Pacific), and future forecasts. Learn more about this dynamic sector.

                                                              July 2025
                                                              Base Year: 2024
                                                              No Of Pages: 234
                                                              Price: $4750

                                                              Military Aircraft Collision Avoidance Systems Market in North America: Market Dynamics and Forecasts 2025-2033

                                                              The Military Aircraft Collision Avoidance Systems (MACAS) market is booming, projected to surpass $3.4 billion by 2033 with a CAGR exceeding 4%. Driven by advanced technologies like TCAS, TAWS, and SVS, this market offers lucrative opportunities for key players like L3Harris and Honeywell. Explore market trends, regional insights, and key segments in this detailed analysis.

                                                              July 2025
                                                              Base Year: 2024
                                                              No Of Pages: 234
                                                              Price: $4750

                                                              Charting Rocket Propulsion Market Growth: CAGR Projections for 2025-2033

                                                              The Rocket Propulsion Market is booming, projected to reach \$XX Billion by 2033 with a CAGR exceeding 8.5%! Explore market trends, key players (SpaceX, Blue Origin, etc.), segment analysis (solid, liquid, hybrid), and regional insights in this comprehensive report. Discover investment opportunities in this dynamic industry.

                                                              July 2025
                                                              Base Year: 2024
                                                              No Of Pages: 234
                                                              Price: $4750

                                                              Strategic Insights into Maritime Security Market Market Trends

                                                              The global maritime security market is experiencing steady growth driven by heightened security concerns and technological advancements. Explore market size, trends, key players (BAE Systems, Saab, Honeywell), and regional insights for the period 2019-2033. Discover the future of maritime surveillance and security.

                                                              July 2025
                                                              Base Year: 2024
                                                              No Of Pages: 197
                                                              Price: $3800

                                                              Military Aircraft Digital Glass Cockpit Systems Market Insights: Growth at XX CAGR Through 2033

                                                              The Military Aircraft Digital Glass Cockpit Systems market is booming, exceeding a 3% CAGR. Explore key drivers, trends, and restraints shaping this sector, including leading companies like L3Harris and Honeywell. Discover regional market shares and future growth projections through 2033.

                                                              July 2025
                                                              Base Year: 2024
                                                              No Of Pages: 234
                                                              Price: $4750

                                                              North America Commercial Aircraft In-Flight Entertainment System Market 2025-2033 Overview: Trends, Competitor Dynamics, and Opportunities

                                                              The North America Commercial Aircraft In-Flight Entertainment System market is booming, with a 7.11% CAGR. Discover key trends, market size projections (2025-2033), leading companies (Thales, Panasonic), and regional breakdowns. Learn how advanced connectivity and personalized content are shaping passenger experience.

                                                              July 2025
                                                              Base Year: 2024
                                                              No Of Pages: 197
                                                              Price: $3800

                                                              Satellite Payload Market’s Role in Shaping Industry Trends 2025-2033

                                                              The global satellite payload market is booming, projected to reach $31.4 billion by 2033 with an 8.54% CAGR. Driven by increased demand for communication, navigation, and surveillance, this report analyzes market segments (GEO, MEO, LEO, commercial, military), key players (SpaceX, Lockheed Martin, Airbus), and regional growth. Discover key trends and investment opportunities in this rapidly expanding sector.

                                                              July 2025
                                                              Base Year: 2024
                                                              No Of Pages: 234
                                                              Price: $4750

                                                              Passenger Emergency Oxygen Deployment Systems Market Market Demand Dynamics: Insights 2025-2033

                                                              The Passenger Emergency Oxygen Deployment Systems market is booming, projected to reach $3.24 billion by 2033 with a 7.42% CAGR. Driven by safety regulations and air travel growth, this market analysis reveals key trends, regional insights, and leading companies like Safran and RTX Corporation. Explore market segmentation, growth drivers, and competitive landscape.

                                                              July 2025
                                                              Base Year: 2024
                                                              No Of Pages: 234
                                                              Price: $4750

                                                              Regional Growth Projections for C5ISR Industry Industry

                                                              The C5ISR market is booming, driven by geopolitical tensions and technological advancements. This analysis reveals key market trends, growth projections, regional breakdowns, and leading companies in the industry, providing insights for investors and stakeholders. Explore the future of command, control, communications, computers, intelligence, surveillance, and reconnaissance.

                                                              July 2025
                                                              Base Year: 2024
                                                              No Of Pages: 234
                                                              Price: $4750

                                                              Europe Inflight Systems Market Growth Opportunities and Market Forecast 2025-2033: A Strategic Analysis

                                                              The European Inflight Systems Market is booming, projected to reach €242.5 million by 2033 with a CAGR of 2.67%. Discover key trends, growth drivers, and leading companies shaping the future of in-flight entertainment and connectivity in Europe. Explore market segmentation by class, country, and product type.

                                                              July 2025
                                                              Base Year: 2024
                                                              No Of Pages: 197
                                                              Price: $3800

                                                              Ammunition Market in NATO Market’s Decade-Long Growth Trends and Future Projections 2025-2033

                                                              The NATO Ammunition Market is booming, projected to reach over $12 billion by 2033, fueled by geopolitical tensions and defense modernization. Explore market trends, key players (RUAG, Rheinmetall, General Dynamics), and regional insights in this comprehensive analysis. Discover growth opportunities in precision-guided munitions and smart ammunition.

                                                              July 2025
                                                              Base Year: 2024
                                                              No Of Pages: 234
                                                              Price: $4750

                                                              Smart Textiles For Military Market Market’s Consumer Insights and Trends

                                                              Discover the explosive growth of the Smart Textiles for Military market, projected at a 15.37% CAGR. This in-depth analysis explores key drivers, trends, and challenges, including applications in camouflage, health monitoring, and energy harvesting. Learn about leading companies and regional market shares for strategic insights.

                                                              July 2025
                                                              Base Year: 2024
                                                              No Of Pages: 234
                                                              Price: $4750

                                                              Strategic Vision for Japan Defense Market Industry Trends

                                                              The Japan Defense Market is booming, projected to reach ¥62.65 billion by 2033 with a 3.4% CAGR. This in-depth analysis covers market size, key players (Thales, Lockheed Martin, Mitsubishi Heavy Industries), regional trends (Kanto, Kansai), and growth drivers. Discover the latest insights into Japan's defense spending and technological advancements.

                                                              July 2025
                                                              Base Year: 2024
                                                              No Of Pages: 197
                                                              Price: $3800
                                                              • Home
                                                              • About Us
                                                              • Industries
                                                                • Aerospace & Defense
                                                                • Agriculture
                                                                • Animal Nutrition & Wellness
                                                                • Automotive
                                                                • Chemicals & Materials
                                                                • Consumer Goods and Services
                                                                • Energy & Power
                                                                • Financial Services and Investment Intelligence
                                                                • Food & Beverage
                                                                • Home and Property Improvement
                                                                • Hospitality and Tourism
                                                                • Logistics
                                                                • Manufacturing Products and Services
                                                                • Packaging
                                                                • Professional and Commercial Services
                                                                • Real Estate and Construction
                                                                • Retail
                                                                • Technology, Media and Telecom
                                                                • Healthcare
                                                              • Services
                                                              • Contact
                                                              Main Logo
                                                              • Home
                                                              • About Us
                                                              • Industries
                                                                • Aerospace & Defense
                                                                • Agriculture
                                                                • Animal Nutrition & Wellness
                                                                • Automotive
                                                                • Chemicals & Materials
                                                                • Consumer Goods and Services
                                                                • Energy & Power
                                                                • Financial Services and Investment Intelligence
                                                                • Food & Beverage
                                                                • Home and Property Improvement
                                                                • Hospitality and Tourism
                                                                • Logistics
                                                                • Manufacturing Products and Services
                                                                • Packaging
                                                                • Professional and Commercial Services
                                                                • Real Estate and Construction
                                                                • Retail
                                                                • Technology, Media and Telecom
                                                                • Healthcare
                                                              • Services
                                                              • Contact
                                                              +17162654855
                                                              [email protected]

                                                              +17162654855

                                                              [email protected]

                                                              Business Address

                                                              Head Office

                                                              Office no. A 5010, fifth floor, Solitaire Business Hub, Near Phoenix mall, Pune, Maharashtra 411014

                                                              Contact Information

                                                              Craig Francis

                                                              Business Development Head

                                                              +17162654855

                                                              [email protected]

                                                              Connect With Us

                                                              Secure Payment Partners

                                                              payment image
                                                              RetailLogisticsPackagingAutomotiveHealthcareAgricultureEnergy & PowerFood & BeverageAerospace & DefenseChemicals & MaterialsHospitality and TourismAnimal Nutrition & WellnessConsumer Goods and ServicesReal Estate and ConstructionHome and Property ImprovementTechnology, Media and TelecomManufacturing Products and ServicesFinancial Services and Investment Intelligence

                                                              © 2025 All rights reserved


                                                              Privacy Policy
                                                              Terms and Conditions
                                                              FAQ