
Key Insights
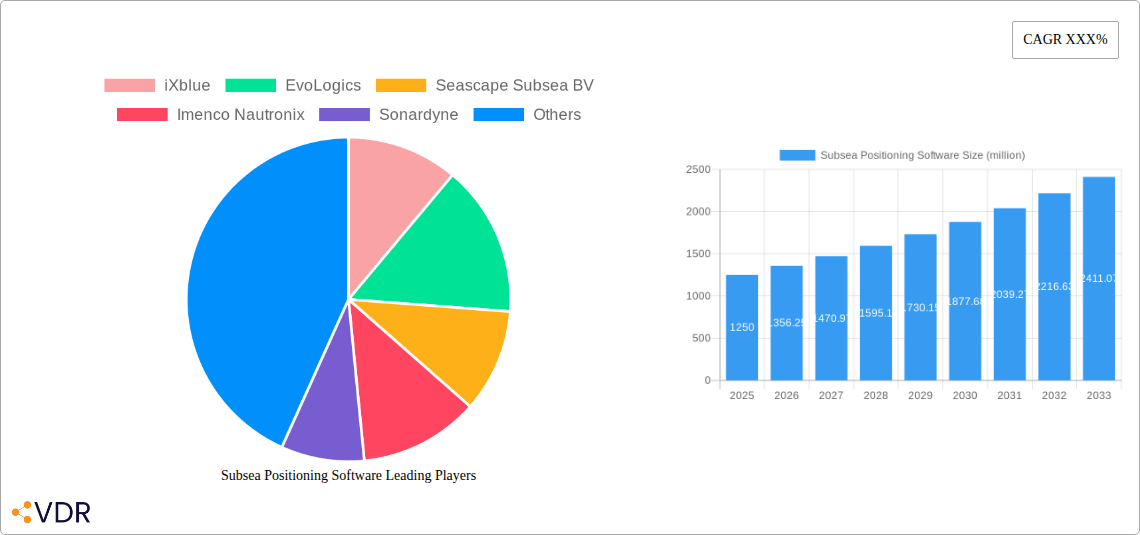
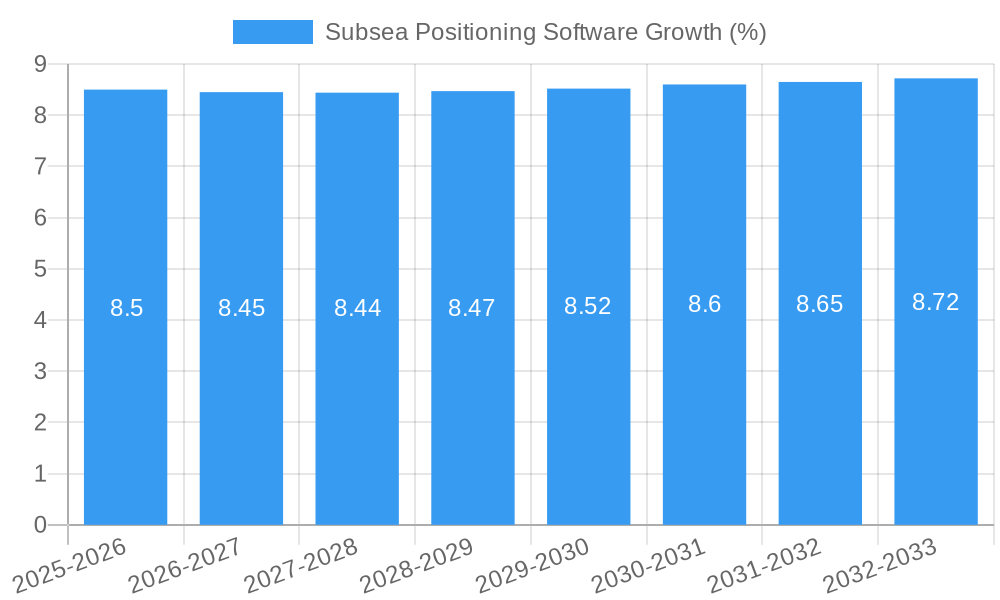
The global Subsea Positioning Software market is poised for significant expansion, projected to reach an estimated \$1,250 million by 2025, and is expected to grow at a Compound Annual Growth Rate (CAGR) of approximately 8.5% through 2033. This robust growth is primarily fueled by escalating investments in offshore energy exploration and production, particularly in deep-water environments. The increasing complexity and scale of undersea infrastructure, including oil and gas platforms, wind farms, and telecommunication cables, necessitate highly accurate and reliable subsea positioning for installation, maintenance, and inspection. Furthermore, advancements in sensor technology, autonomous underwater vehicles (AUVs), and remotely operated vehicles (ROVs) are driving the demand for sophisticated software solutions that can integrate and process vast amounts of data for precise navigation and operation. The expanding scope of subsea architecture, coupled with the critical need for efficient cable surveys and salvage operations, further underscores the market's upward trajectory.
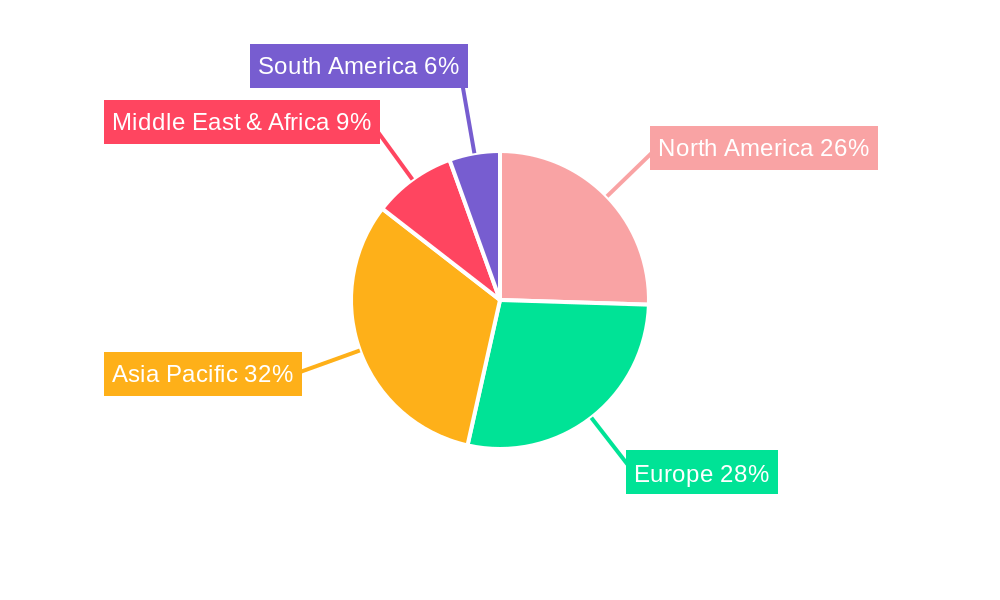
The market segmentation reveals a diverse application landscape, with Underwater Inspection and Undersea Architecture emerging as key growth areas. The demand for Long Baseline (LBL) systems is expected to remain strong due to their inherent accuracy in controlled environments, while Short Baseline (SBL) and Ultra-Short Baseline (USBL) systems will cater to more dynamic and varied operational needs. Geographically, the Asia Pacific region, led by China and India, is anticipated to exhibit the fastest growth, driven by substantial government initiatives for offshore resource development and expansion of subsea infrastructure. North America and Europe, with their established offshore industries and continuous technological innovation, will continue to hold significant market share. While the market benefits from strong drivers, potential restraints such as high initial investment costs for advanced systems and the need for skilled personnel may present challenges, though these are likely to be mitigated by ongoing technological advancements and increasing adoption rates.
This report provides a comprehensive analysis of the global Subsea Positioning Software market, offering critical insights into its dynamics, growth trajectories, and future outlook. The study encompasses the period from 2019 to 2033, with a base year of 2025 and a detailed forecast for 2025–2033.
Subsea Positioning Software Market Dynamics & Structure
The Subsea Positioning Software market is characterized by a moderately concentrated structure, with key players like Kongsberg Gruppen, Hexagon, and Teledyne Marine holding significant market shares. Technological innovation is a primary driver, fueled by advancements in acoustic and inertial navigation systems, contributing to an estimated market size of $650 million in 2025. Regulatory frameworks, particularly those concerning offshore exploration and environmental safety, influence software development and deployment. Competitive product substitutes, such as traditional survey methods, are gradually being displaced by more advanced digital solutions. End-user demographics are shifting towards a greater demand for integrated, real-time data solutions from offshore energy, defense, and scientific research sectors. Mergers and acquisitions (M&A) are a notable trend, with an anticipated 12 deals in the forecast period, indicating consolidation and strategic expansion. Innovation barriers include the high cost of R&D, the specialized nature of subsea environments, and the need for highly skilled personnel.
- Market Concentration: Moderate, with top players dominating a significant portion of the market.
- Technological Innovation Drivers: Advancements in acoustic, INS, and hybrid positioning technologies.
- Regulatory Frameworks: Evolving standards for offshore operations and data integrity.
- Competitive Product Substitutes: Traditional survey methods vs. advanced digital solutions.
- End-User Demographics: Growing demand from offshore energy, defense, and research.
- M&A Trends: Anticipated 12 deals in the forecast period, signifying consolidation.
- Innovation Barriers: High R&D costs, specialized environments, and skill shortages.
Subsea Positioning Software Growth Trends & Insights
The Subsea Positioning Software market is poised for robust growth, projected to expand from approximately $550 million in 2024 to an estimated $980 million by 2033, demonstrating a Compound Annual Growth Rate (CAGR) of 6.8% during the forecast period. Adoption rates are accelerating, driven by the increasing complexity and scale of offshore projects, including deepwater exploration, renewable energy installations, and critical infrastructure development. Technological disruptions are centered on the integration of AI and machine learning for enhanced data processing and predictive analytics, as well as the development of more robust and interoperable positioning systems. Consumer behavior shifts are evident in the growing preference for cloud-based software solutions, offering scalability, accessibility, and streamlined collaboration. The market penetration of advanced subsea positioning software is expected to reach 60% by 2033, up from approximately 40% in 2024. This growth is further propelled by the rising demand for precision in underwater navigation and mapping, essential for efficient operational planning and risk mitigation. The increasing focus on autonomous underwater vehicles (AUVs) and remotely operated vehicles (ROVs) further necessitates sophisticated positioning software for their autonomous operations and data acquisition. The need for real-time situational awareness in dynamic subsea environments is also a significant factor driving adoption. Furthermore, the development of novel applications in areas like subsea archaeology and resource management is expanding the market's scope. The drive for improved operational efficiency and safety in harsh subsea conditions directly translates to increased investment in cutting-edge positioning technologies. The global push towards sustainable energy sources, such as offshore wind farms, also creates substantial opportunities for subsea positioning software in their installation and maintenance.
Dominant Regions, Countries, or Segments in Subsea Positioning Software
The Application Segment of Cable Survey is emerging as a dominant force in the global Subsea Positioning Software market, projected to account for 30% of the total market share by 2025, valued at approximately $195 million. This dominance is fueled by the burgeoning demand for subsea telecommunication and power cables, driven by global digitalization and the expansion of renewable energy grids. Countries with extensive coastlines and significant investments in subsea infrastructure, such as the United States, China, and Norway, are leading this growth. The Type Segment of Long Baseline System (LBS) is also a significant contributor, accounting for an estimated 35% of the market by 2025, valued at $227.5 million. LBS offers high accuracy for static or slow-moving platforms, making it ideal for precise positioning during cable laying and inspection.
Dominant Application Segment: Cable Survey, driven by global digitalization and renewable energy infrastructure expansion.
- Estimated market share: 30% by 2025 ($195 million).
- Key drivers: Increased deployment of subsea telecommunication and power cables.
- Leading countries: United States, China, Norway.
Dominant Type Segment: Long Baseline System (LBS), favored for its high accuracy in static and slow-moving applications.
- Estimated market share: 35% by 2025 ($227.5 million).
- Key drivers: Precision requirements for cable laying, installation, and inspection.
Undersea Architecture & Underwater Inspection: These segments are also experiencing substantial growth, driven by offshore construction projects and the need for regular structural integrity checks.
- Undersea Architecture: Driven by the development of offshore platforms, wind farms, and subsea pipelines.
- Underwater Inspection: Crucial for maintaining the safety and longevity of existing subsea assets.
Salvage & Others: While smaller, these segments represent niche markets with specialized positioning needs, contributing to market diversification.
The growth in these segments is underpinned by favorable economic policies promoting offshore development, significant investments in maritime infrastructure, and advancements in surveying technologies that enhance efficiency and reduce operational risks. The increasing adoption of advanced positioning systems in these applications directly contributes to the overall market expansion.
Subsea Positioning Software Product Landscape
The Subsea Positioning Software market is characterized by a dynamic product landscape featuring innovative solutions designed for unparalleled accuracy and efficiency. Companies are actively developing integrated software platforms that leverage advanced algorithms for acoustic positioning, inertial navigation, and sensor fusion. These products offer real-time data visualization, automated quality control, and seamless integration with AUVs, ROVs, and survey vessels. Unique selling propositions often lie in enhanced performance metrics, such as cm-level accuracy, extended operational ranges, and resilience in challenging subsea environments. Technological advancements are focused on miniaturization, increased processing power, and improved user interfaces for intuitive operation.
Key Drivers, Barriers & Challenges in Subsea Positioning Software
Key Drivers:
- Technological Advancements: Continuous innovation in acoustic, INS, and GNSS integration for higher accuracy and reliability.
- Growing Offshore Activities: Expansion in offshore oil and gas, renewable energy (wind, tidal), and telecommunications fuels demand.
- Increased Demand for Precision: Critical for complex installations, surveys, and autonomous operations.
- Safety and Efficiency Imperatives: Minimizing risks and optimizing operational timelines in hazardous environments.
Barriers & Challenges:
- High Initial Investment Costs: The expense of advanced hardware and software solutions can be a deterrent.
- Complex Operating Environments: Harsh subsea conditions (pressure, currents, visibility) pose technical challenges.
- Interoperability Issues: Ensuring compatibility between different hardware and software systems.
- Shortage of Skilled Personnel: A lack of trained professionals for operating and maintaining sophisticated subsea systems.
- Supply Chain Disruptions: Global events can impact the availability of specialized components, potentially leading to project delays. The estimated impact of these disruptions can range from a 5% to 10% increase in project costs.
Emerging Opportunities in Subsea Positioning Software
Emerging opportunities lie in the expanding use of AI and machine learning for predictive maintenance of subsea assets and autonomous decision-making for AUVs and ROVs. The growing interest in subsea resource mapping, including mineral exploration and carbon capture storage site verification, presents a significant untapped market. Furthermore, the development of wireless subsea communication and positioning technologies promises to streamline operations and reduce deployment complexities, opening new avenues for growth and innovation in this sector. The integration of cloud-based solutions for enhanced data accessibility and collaboration among offshore stakeholders also represents a key growth area.
Growth Accelerators in the Subsea Positioning Software Industry
Catalysts driving long-term growth include breakthroughs in quantum positioning technologies, offering unprecedented accuracy, and the increasing adoption of standardized data protocols to improve interoperability. Strategic partnerships between software providers and hardware manufacturers are essential for developing integrated solutions. Market expansion strategies focusing on emerging economies with developing offshore sectors, alongside dedicated R&D investments in solutions for harsh environments and autonomous operations, will further accelerate industry growth. The development of compact, energy-efficient positioning systems suitable for swarms of smaller underwater vehicles is also a significant growth accelerator.
Key Players Shaping the Subsea Positioning Software Market
- iXblue
- EvoLogics
- Seascape Subsea BV
- Imenco Nautronix
- Sonardyne
- EIVA
- Blueprint Subsea
- Hexagon
- Kongsberg Gruppen
- Teledyne Marine
- AAE Technologies
- DiveNET Subsea Wireless
- Subsea Technologies
- Tritech International
- Water Linked
- Impact Subsea
- Fugro
Notable Milestones in Subsea Positioning Software Sector
- 2021: iXblue launches a new generation of inertial navigation systems with enhanced accuracy for subsea applications.
- 2022: EvoLogics introduces its advanced acoustic modems, enabling faster and more reliable underwater communication.
- 2022: Sonardyne expands its SPRINT INS family with new configurations for increased versatility.
- 2023: Kongsberg Gruppen acquires a leading AUV manufacturer, strengthening its integrated subsea solutions portfolio.
- 2023: Hexagon develops new software modules for real-time subsea data processing and analysis.
- 2024: Teledyne Marine announces advancements in its subsea acoustic positioning systems, offering improved performance in challenging environments.
- 2024: EIVA enhances its survey software with improved integration capabilities for various subsea sensors.
- 2024: Blueprint Subsea introduces a compact and cost-effective USBL system for shallow water applications.
- 2024: DiveNET Subsea Wireless develops innovative wireless communication solutions for improved subsea data transfer.
In-Depth Subsea Positioning Software Market Outlook
The future market outlook for Subsea Positioning Software is exceptionally positive, driven by sustained investment in offshore infrastructure and the relentless pursuit of operational efficiency and safety. Growth accelerators, including technological breakthroughs in quantum positioning and AI-driven analytics, combined with strategic market expansion into emerging regions, will propel the market forward. The increasing demand for integrated, autonomous systems will foster innovation and create new revenue streams. Companies that can offer robust, adaptable, and user-friendly solutions, particularly those leveraging cloud computing and advanced sensor fusion, are best positioned to capitalize on future market potential and strategic opportunities in the subsea domain. The market is projected to exceed $1.2 billion by 2030.
Subsea Positioning Software Segmentation
-
1. Application
- 1.1. Underwater Inspection
- 1.2. Undersea Architecture
- 1.3. Cable Survey
- 1.4. Salvage
- 1.5. Others
-
2. Type
- 2.1. Long Baseline System
- 2.2. Short Baseline System
- 2.3. Ultra Short Baseline System
Subsea Positioning Software Segmentation By Geography
-
1. North America
- 1.1. United States
- 1.2. Canada
- 1.3. Mexico
-
2. South America
- 2.1. Brazil
- 2.2. Argentina
- 2.3. Rest of South America
-
3. Europe
- 3.1. United Kingdom
- 3.2. Germany
- 3.3. France
- 3.4. Italy
- 3.5. Spain
- 3.6. Russia
- 3.7. Benelux
- 3.8. Nordics
- 3.9. Rest of Europe
-
4. Middle East & Africa
- 4.1. Turkey
- 4.2. Israel
- 4.3. GCC
- 4.4. North Africa
- 4.5. South Africa
- 4.6. Rest of Middle East & Africa
-
5. Asia Pacific
- 5.1. China
- 5.2. India
- 5.3. Japan
- 5.4. South Korea
- 5.5. ASEAN
- 5.6. Oceania
- 5.7. Rest of Asia Pacific
Subsea Positioning Software REPORT HIGHLIGHTS
| Aspects | Details |
|---|---|
| Study Period | 2019-2033 |
| Base Year | 2024 |
| Estimated Year | 2025 |
| Forecast Period | 2025-2033 |
| Historical Period | 2019-2024 |
| Growth Rate | CAGR of XXX% from 2019-2033 |
| Segmentation |
|
Table of Contents
- 1. Introduction
- 1.1. Research Scope
- 1.2. Market Segmentation
- 1.3. Research Methodology
- 1.4. Definitions and Assumptions
- 2. Executive Summary
- 2.1. Introduction
- 3. Market Dynamics
- 3.1. Introduction
- 3.2. Market Drivers
- 3.3. Market Restrains
- 3.4. Market Trends
- 4. Market Factor Analysis
- 4.1. Porters Five Forces
- 4.2. Supply/Value Chain
- 4.3. PESTEL analysis
- 4.4. Market Entropy
- 4.5. Patent/Trademark Analysis
- 5. Global Subsea Positioning Software Analysis, Insights and Forecast, 2019-2031
- 5.1. Market Analysis, Insights and Forecast - by Application
- 5.1.1. Underwater Inspection
- 5.1.2. Undersea Architecture
- 5.1.3. Cable Survey
- 5.1.4. Salvage
- 5.1.5. Others
- 5.2. Market Analysis, Insights and Forecast - by Type
- 5.2.1. Long Baseline System
- 5.2.2. Short Baseline System
- 5.2.3. Ultra Short Baseline System
- 5.3. Market Analysis, Insights and Forecast - by Region
- 5.3.1. North America
- 5.3.2. South America
- 5.3.3. Europe
- 5.3.4. Middle East & Africa
- 5.3.5. Asia Pacific
- 5.1. Market Analysis, Insights and Forecast - by Application
- 6. North America Subsea Positioning Software Analysis, Insights and Forecast, 2019-2031
- 6.1. Market Analysis, Insights and Forecast - by Application
- 6.1.1. Underwater Inspection
- 6.1.2. Undersea Architecture
- 6.1.3. Cable Survey
- 6.1.4. Salvage
- 6.1.5. Others
- 6.2. Market Analysis, Insights and Forecast - by Type
- 6.2.1. Long Baseline System
- 6.2.2. Short Baseline System
- 6.2.3. Ultra Short Baseline System
- 6.1. Market Analysis, Insights and Forecast - by Application
- 7. South America Subsea Positioning Software Analysis, Insights and Forecast, 2019-2031
- 7.1. Market Analysis, Insights and Forecast - by Application
- 7.1.1. Underwater Inspection
- 7.1.2. Undersea Architecture
- 7.1.3. Cable Survey
- 7.1.4. Salvage
- 7.1.5. Others
- 7.2. Market Analysis, Insights and Forecast - by Type
- 7.2.1. Long Baseline System
- 7.2.2. Short Baseline System
- 7.2.3. Ultra Short Baseline System
- 7.1. Market Analysis, Insights and Forecast - by Application
- 8. Europe Subsea Positioning Software Analysis, Insights and Forecast, 2019-2031
- 8.1. Market Analysis, Insights and Forecast - by Application
- 8.1.1. Underwater Inspection
- 8.1.2. Undersea Architecture
- 8.1.3. Cable Survey
- 8.1.4. Salvage
- 8.1.5. Others
- 8.2. Market Analysis, Insights and Forecast - by Type
- 8.2.1. Long Baseline System
- 8.2.2. Short Baseline System
- 8.2.3. Ultra Short Baseline System
- 8.1. Market Analysis, Insights and Forecast - by Application
- 9. Middle East & Africa Subsea Positioning Software Analysis, Insights and Forecast, 2019-2031
- 9.1. Market Analysis, Insights and Forecast - by Application
- 9.1.1. Underwater Inspection
- 9.1.2. Undersea Architecture
- 9.1.3. Cable Survey
- 9.1.4. Salvage
- 9.1.5. Others
- 9.2. Market Analysis, Insights and Forecast - by Type
- 9.2.1. Long Baseline System
- 9.2.2. Short Baseline System
- 9.2.3. Ultra Short Baseline System
- 9.1. Market Analysis, Insights and Forecast - by Application
- 10. Asia Pacific Subsea Positioning Software Analysis, Insights and Forecast, 2019-2031
- 10.1. Market Analysis, Insights and Forecast - by Application
- 10.1.1. Underwater Inspection
- 10.1.2. Undersea Architecture
- 10.1.3. Cable Survey
- 10.1.4. Salvage
- 10.1.5. Others
- 10.2. Market Analysis, Insights and Forecast - by Type
- 10.2.1. Long Baseline System
- 10.2.2. Short Baseline System
- 10.2.3. Ultra Short Baseline System
- 10.1. Market Analysis, Insights and Forecast - by Application
- 11. Competitive Analysis
- 11.1. Global Market Share Analysis 2024
- 11.2. Company Profiles
- 11.2.1 iXblue
- 11.2.1.1. Overview
- 11.2.1.2. Products
- 11.2.1.3. SWOT Analysis
- 11.2.1.4. Recent Developments
- 11.2.1.5. Financials (Based on Availability)
- 11.2.2 EvoLogics
- 11.2.2.1. Overview
- 11.2.2.2. Products
- 11.2.2.3. SWOT Analysis
- 11.2.2.4. Recent Developments
- 11.2.2.5. Financials (Based on Availability)
- 11.2.3 Seascape Subsea BV
- 11.2.3.1. Overview
- 11.2.3.2. Products
- 11.2.3.3. SWOT Analysis
- 11.2.3.4. Recent Developments
- 11.2.3.5. Financials (Based on Availability)
- 11.2.4 Imenco Nautronix
- 11.2.4.1. Overview
- 11.2.4.2. Products
- 11.2.4.3. SWOT Analysis
- 11.2.4.4. Recent Developments
- 11.2.4.5. Financials (Based on Availability)
- 11.2.5 Sonardyne
- 11.2.5.1. Overview
- 11.2.5.2. Products
- 11.2.5.3. SWOT Analysis
- 11.2.5.4. Recent Developments
- 11.2.5.5. Financials (Based on Availability)
- 11.2.6 EIVA
- 11.2.6.1. Overview
- 11.2.6.2. Products
- 11.2.6.3. SWOT Analysis
- 11.2.6.4. Recent Developments
- 11.2.6.5. Financials (Based on Availability)
- 11.2.7 Blueprint Subsea
- 11.2.7.1. Overview
- 11.2.7.2. Products
- 11.2.7.3. SWOT Analysis
- 11.2.7.4. Recent Developments
- 11.2.7.5. Financials (Based on Availability)
- 11.2.8 Hexagon
- 11.2.8.1. Overview
- 11.2.8.2. Products
- 11.2.8.3. SWOT Analysis
- 11.2.8.4. Recent Developments
- 11.2.8.5. Financials (Based on Availability)
- 11.2.9 Kongsberg Gruppen
- 11.2.9.1. Overview
- 11.2.9.2. Products
- 11.2.9.3. SWOT Analysis
- 11.2.9.4. Recent Developments
- 11.2.9.5. Financials (Based on Availability)
- 11.2.10 Teledyne Marine
- 11.2.10.1. Overview
- 11.2.10.2. Products
- 11.2.10.3. SWOT Analysis
- 11.2.10.4. Recent Developments
- 11.2.10.5. Financials (Based on Availability)
- 11.2.11 AAE Technologies
- 11.2.11.1. Overview
- 11.2.11.2. Products
- 11.2.11.3. SWOT Analysis
- 11.2.11.4. Recent Developments
- 11.2.11.5. Financials (Based on Availability)
- 11.2.12 DiveNET Subsea Wireless
- 11.2.12.1. Overview
- 11.2.12.2. Products
- 11.2.12.3. SWOT Analysis
- 11.2.12.4. Recent Developments
- 11.2.12.5. Financials (Based on Availability)
- 11.2.13 Subsea Technologies
- 11.2.13.1. Overview
- 11.2.13.2. Products
- 11.2.13.3. SWOT Analysis
- 11.2.13.4. Recent Developments
- 11.2.13.5. Financials (Based on Availability)
- 11.2.14 Tritech International
- 11.2.14.1. Overview
- 11.2.14.2. Products
- 11.2.14.3. SWOT Analysis
- 11.2.14.4. Recent Developments
- 11.2.14.5. Financials (Based on Availability)
- 11.2.15 Water Linked
- 11.2.15.1. Overview
- 11.2.15.2. Products
- 11.2.15.3. SWOT Analysis
- 11.2.15.4. Recent Developments
- 11.2.15.5. Financials (Based on Availability)
- 11.2.16 Impact Subsea
- 11.2.16.1. Overview
- 11.2.16.2. Products
- 11.2.16.3. SWOT Analysis
- 11.2.16.4. Recent Developments
- 11.2.16.5. Financials (Based on Availability)
- 11.2.17 Fugro
- 11.2.17.1. Overview
- 11.2.17.2. Products
- 11.2.17.3. SWOT Analysis
- 11.2.17.4. Recent Developments
- 11.2.17.5. Financials (Based on Availability)
- 11.2.1 iXblue
List of Figures
- Figure 1: Global Subsea Positioning Software Revenue Breakdown (million, %) by Region 2024 & 2032
- Figure 2: North America Subsea Positioning Software Revenue (million), by Application 2024 & 2032
- Figure 3: North America Subsea Positioning Software Revenue Share (%), by Application 2024 & 2032
- Figure 4: North America Subsea Positioning Software Revenue (million), by Type 2024 & 2032
- Figure 5: North America Subsea Positioning Software Revenue Share (%), by Type 2024 & 2032
- Figure 6: North America Subsea Positioning Software Revenue (million), by Country 2024 & 2032
- Figure 7: North America Subsea Positioning Software Revenue Share (%), by Country 2024 & 2032
- Figure 8: South America Subsea Positioning Software Revenue (million), by Application 2024 & 2032
- Figure 9: South America Subsea Positioning Software Revenue Share (%), by Application 2024 & 2032
- Figure 10: South America Subsea Positioning Software Revenue (million), by Type 2024 & 2032
- Figure 11: South America Subsea Positioning Software Revenue Share (%), by Type 2024 & 2032
- Figure 12: South America Subsea Positioning Software Revenue (million), by Country 2024 & 2032
- Figure 13: South America Subsea Positioning Software Revenue Share (%), by Country 2024 & 2032
- Figure 14: Europe Subsea Positioning Software Revenue (million), by Application 2024 & 2032
- Figure 15: Europe Subsea Positioning Software Revenue Share (%), by Application 2024 & 2032
- Figure 16: Europe Subsea Positioning Software Revenue (million), by Type 2024 & 2032
- Figure 17: Europe Subsea Positioning Software Revenue Share (%), by Type 2024 & 2032
- Figure 18: Europe Subsea Positioning Software Revenue (million), by Country 2024 & 2032
- Figure 19: Europe Subsea Positioning Software Revenue Share (%), by Country 2024 & 2032
- Figure 20: Middle East & Africa Subsea Positioning Software Revenue (million), by Application 2024 & 2032
- Figure 21: Middle East & Africa Subsea Positioning Software Revenue Share (%), by Application 2024 & 2032
- Figure 22: Middle East & Africa Subsea Positioning Software Revenue (million), by Type 2024 & 2032
- Figure 23: Middle East & Africa Subsea Positioning Software Revenue Share (%), by Type 2024 & 2032
- Figure 24: Middle East & Africa Subsea Positioning Software Revenue (million), by Country 2024 & 2032
- Figure 25: Middle East & Africa Subsea Positioning Software Revenue Share (%), by Country 2024 & 2032
- Figure 26: Asia Pacific Subsea Positioning Software Revenue (million), by Application 2024 & 2032
- Figure 27: Asia Pacific Subsea Positioning Software Revenue Share (%), by Application 2024 & 2032
- Figure 28: Asia Pacific Subsea Positioning Software Revenue (million), by Type 2024 & 2032
- Figure 29: Asia Pacific Subsea Positioning Software Revenue Share (%), by Type 2024 & 2032
- Figure 30: Asia Pacific Subsea Positioning Software Revenue (million), by Country 2024 & 2032
- Figure 31: Asia Pacific Subsea Positioning Software Revenue Share (%), by Country 2024 & 2032
List of Tables
- Table 1: Global Subsea Positioning Software Revenue million Forecast, by Region 2019 & 2032
- Table 2: Global Subsea Positioning Software Revenue million Forecast, by Application 2019 & 2032
- Table 3: Global Subsea Positioning Software Revenue million Forecast, by Type 2019 & 2032
- Table 4: Global Subsea Positioning Software Revenue million Forecast, by Region 2019 & 2032
- Table 5: Global Subsea Positioning Software Revenue million Forecast, by Application 2019 & 2032
- Table 6: Global Subsea Positioning Software Revenue million Forecast, by Type 2019 & 2032
- Table 7: Global Subsea Positioning Software Revenue million Forecast, by Country 2019 & 2032
- Table 8: United States Subsea Positioning Software Revenue (million) Forecast, by Application 2019 & 2032
- Table 9: Canada Subsea Positioning Software Revenue (million) Forecast, by Application 2019 & 2032
- Table 10: Mexico Subsea Positioning Software Revenue (million) Forecast, by Application 2019 & 2032
- Table 11: Global Subsea Positioning Software Revenue million Forecast, by Application 2019 & 2032
- Table 12: Global Subsea Positioning Software Revenue million Forecast, by Type 2019 & 2032
- Table 13: Global Subsea Positioning Software Revenue million Forecast, by Country 2019 & 2032
- Table 14: Brazil Subsea Positioning Software Revenue (million) Forecast, by Application 2019 & 2032
- Table 15: Argentina Subsea Positioning Software Revenue (million) Forecast, by Application 2019 & 2032
- Table 16: Rest of South America Subsea Positioning Software Revenue (million) Forecast, by Application 2019 & 2032
- Table 17: Global Subsea Positioning Software Revenue million Forecast, by Application 2019 & 2032
- Table 18: Global Subsea Positioning Software Revenue million Forecast, by Type 2019 & 2032
- Table 19: Global Subsea Positioning Software Revenue million Forecast, by Country 2019 & 2032
- Table 20: United Kingdom Subsea Positioning Software Revenue (million) Forecast, by Application 2019 & 2032
- Table 21: Germany Subsea Positioning Software Revenue (million) Forecast, by Application 2019 & 2032
- Table 22: France Subsea Positioning Software Revenue (million) Forecast, by Application 2019 & 2032
- Table 23: Italy Subsea Positioning Software Revenue (million) Forecast, by Application 2019 & 2032
- Table 24: Spain Subsea Positioning Software Revenue (million) Forecast, by Application 2019 & 2032
- Table 25: Russia Subsea Positioning Software Revenue (million) Forecast, by Application 2019 & 2032
- Table 26: Benelux Subsea Positioning Software Revenue (million) Forecast, by Application 2019 & 2032
- Table 27: Nordics Subsea Positioning Software Revenue (million) Forecast, by Application 2019 & 2032
- Table 28: Rest of Europe Subsea Positioning Software Revenue (million) Forecast, by Application 2019 & 2032
- Table 29: Global Subsea Positioning Software Revenue million Forecast, by Application 2019 & 2032
- Table 30: Global Subsea Positioning Software Revenue million Forecast, by Type 2019 & 2032
- Table 31: Global Subsea Positioning Software Revenue million Forecast, by Country 2019 & 2032
- Table 32: Turkey Subsea Positioning Software Revenue (million) Forecast, by Application 2019 & 2032
- Table 33: Israel Subsea Positioning Software Revenue (million) Forecast, by Application 2019 & 2032
- Table 34: GCC Subsea Positioning Software Revenue (million) Forecast, by Application 2019 & 2032
- Table 35: North Africa Subsea Positioning Software Revenue (million) Forecast, by Application 2019 & 2032
- Table 36: South Africa Subsea Positioning Software Revenue (million) Forecast, by Application 2019 & 2032
- Table 37: Rest of Middle East & Africa Subsea Positioning Software Revenue (million) Forecast, by Application 2019 & 2032
- Table 38: Global Subsea Positioning Software Revenue million Forecast, by Application 2019 & 2032
- Table 39: Global Subsea Positioning Software Revenue million Forecast, by Type 2019 & 2032
- Table 40: Global Subsea Positioning Software Revenue million Forecast, by Country 2019 & 2032
- Table 41: China Subsea Positioning Software Revenue (million) Forecast, by Application 2019 & 2032
- Table 42: India Subsea Positioning Software Revenue (million) Forecast, by Application 2019 & 2032
- Table 43: Japan Subsea Positioning Software Revenue (million) Forecast, by Application 2019 & 2032
- Table 44: South Korea Subsea Positioning Software Revenue (million) Forecast, by Application 2019 & 2032
- Table 45: ASEAN Subsea Positioning Software Revenue (million) Forecast, by Application 2019 & 2032
- Table 46: Oceania Subsea Positioning Software Revenue (million) Forecast, by Application 2019 & 2032
- Table 47: Rest of Asia Pacific Subsea Positioning Software Revenue (million) Forecast, by Application 2019 & 2032
Frequently Asked Questions
1. What is the projected Compound Annual Growth Rate (CAGR) of the Subsea Positioning Software?
The projected CAGR is approximately XXX%.
2. Which companies are prominent players in the Subsea Positioning Software?
Key companies in the market include iXblue, EvoLogics, Seascape Subsea BV, Imenco Nautronix, Sonardyne, EIVA, Blueprint Subsea, Hexagon, Kongsberg Gruppen, Teledyne Marine, AAE Technologies, DiveNET Subsea Wireless, Subsea Technologies, Tritech International, Water Linked, Impact Subsea, Fugro.
3. What are the main segments of the Subsea Positioning Software?
The market segments include Application, Type.
4. Can you provide details about the market size?
The market size is estimated to be USD XXX million as of 2022.
5. What are some drivers contributing to market growth?
N/A
6. What are the notable trends driving market growth?
N/A
7. Are there any restraints impacting market growth?
N/A
8. Can you provide examples of recent developments in the market?
N/A
9. What pricing options are available for accessing the report?
Pricing options include single-user, multi-user, and enterprise licenses priced at USD 2900.00, USD 4350.00, and USD 5800.00 respectively.
10. Is the market size provided in terms of value or volume?
The market size is provided in terms of value, measured in million.
11. Are there any specific market keywords associated with the report?
Yes, the market keyword associated with the report is "Subsea Positioning Software," which aids in identifying and referencing the specific market segment covered.
12. How do I determine which pricing option suits my needs best?
The pricing options vary based on user requirements and access needs. Individual users may opt for single-user licenses, while businesses requiring broader access may choose multi-user or enterprise licenses for cost-effective access to the report.
13. Are there any additional resources or data provided in the Subsea Positioning Software report?
While the report offers comprehensive insights, it's advisable to review the specific contents or supplementary materials provided to ascertain if additional resources or data are available.
14. How can I stay updated on further developments or reports in the Subsea Positioning Software?
To stay informed about further developments, trends, and reports in the Subsea Positioning Software, consider subscribing to industry newsletters, following relevant companies and organizations, or regularly checking reputable industry news sources and publications.
Methodology
Step 1 - Identification of Relevant Samples Size from Population Database


Step 2 - Approaches for Defining Global Market Size (Value, Volume* & Price*)

Note*: In applicable scenarios
Step 3 - Data Sources
Primary Research
- Web Analytics
- Survey Reports
- Research Institute
- Latest Research Reports
- Opinion Leaders
Secondary Research
- Annual Reports
- White Paper
- Latest Press Release
- Industry Association
- Paid Database
- Investor Presentations

Step 4 - Data Triangulation
Involves using different sources of information in order to increase the validity of a study
These sources are likely to be stakeholders in a program - participants, other researchers, program staff, other community members, and so on.
Then we put all data in single framework & apply various statistical tools to find out the dynamic on the market.
During the analysis stage, feedback from the stakeholder groups would be compared to determine areas of agreement as well as areas of divergence


