
Key Insights
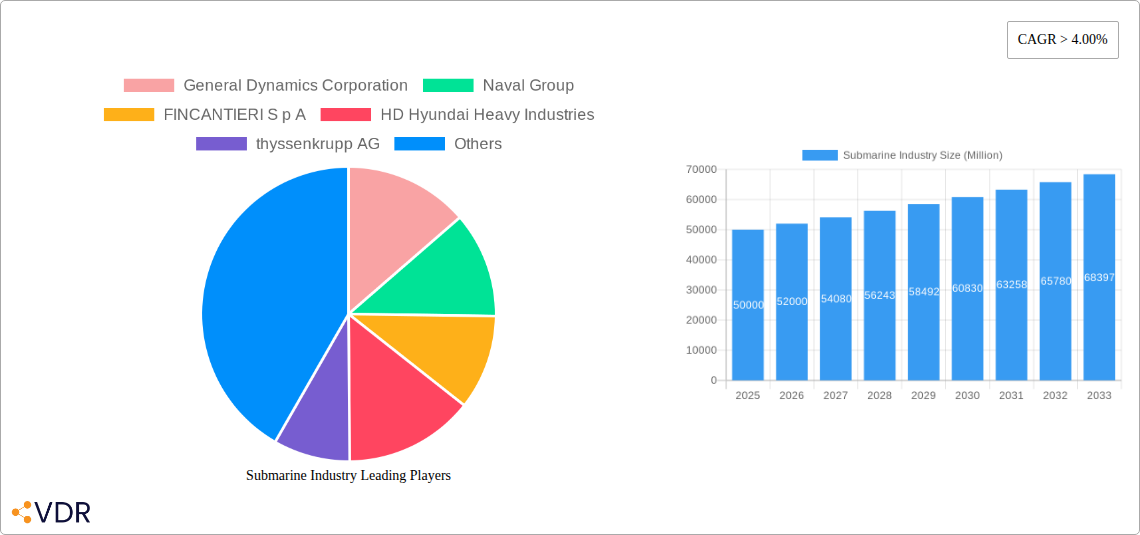
The global submarine industry, valued at approximately $XX million in 2025, is projected to experience robust growth, exceeding a 4% CAGR from 2025 to 2033. This expansion is fueled by escalating geopolitical tensions and the increasing need for advanced naval capabilities among major world powers. Technological advancements, such as the development of quieter propulsion systems, improved sensor technology, and autonomous underwater vehicles (AUVs) integration, are further driving market growth. The market is segmented into Nuclear-Powered Submarines (SSNs), Ballistic Missile Submarines (SSBNs), Guided-Missile Nuclear Submarines (SSGNs), and Diesel-Electric Submarines (SSKs), with nuclear submarines commanding a significant share due to their strategic importance and long-range capabilities. The Asia-Pacific region, particularly China and India, is expected to witness substantial growth, driven by significant investments in naval modernization and expansion programs. Conversely, budget constraints in certain regions and the high cost of submarine development and maintenance pose challenges to the market's expansion.
Competition within the submarine industry is intense, with key players such as General Dynamics, Naval Group, Fincantieri, HD Hyundai Heavy Industries, and others vying for market share. Success in this market hinges on technological innovation, strategic partnerships, and the ability to meet the specific requirements of individual navies. The future of the submarine industry will likely see a greater focus on unmanned and autonomous underwater systems, enhancing operational efficiency and reducing risks to human crews. Furthermore, the integration of advanced weaponry and communication systems will be crucial for maintaining a competitive edge in this sophisticated sector. The continued rise of anti-submarine warfare (ASW) capabilities could also influence the design and deployment of future submarine fleets, prompting further technological innovation to ensure effective countermeasures.
Submarine Industry Market Report: 2019-2033
This comprehensive report provides a detailed analysis of the global submarine industry, encompassing market dynamics, growth trends, regional performance, and key players. The study period covers 2019-2033, with 2025 as the base and estimated year. The report offers invaluable insights for industry professionals, investors, and policymakers seeking to understand and navigate this complex and strategically vital sector. The report segments the market by type: Nuclear-Powered Submarines (SSNs), Ballistic Missile Submarines (SSBNs), Guided-Missile Nuclear Submarines (SSGNs), and Diesel-Electric Submarines (SSKs).
Submarine Industry Market Dynamics & Structure
The global submarine market is characterized by a high degree of concentration among a limited number of major players, primarily driven by substantial capital investment requirements, stringent technological expertise, and geopolitical considerations. The market's structure is influenced by government procurement policies, international arms trade regulations, and the continuous technological advancements in submarine design and capabilities. This report analyzes market concentration through market share calculations for key players, assessing the impact of mergers and acquisitions (M&A) activities. The analysis considers technological innovation, including advancements in propulsion systems, sensor technologies, and autonomous underwater vehicles (AUVs), alongside the regulatory frameworks governing submarine construction, operation, and export. Substitute products are limited, mainly confined to alternative surveillance technologies, but their impact is considered in this report, alongside end-user demographics (primarily naval forces).
- Market Concentration: High, with top 10 players holding approximately xx% of market share in 2025 (estimated).
- M&A Activity: xx deals recorded between 2019 and 2024, with a predicted xx deals in the forecast period.
- Technological Innovation Drivers: Advancements in AI, automation, and energy efficiency are key drivers.
- Regulatory Frameworks: Stringent international regulations regarding nuclear materials and weapons proliferation significantly impact the market.
- Innovation Barriers: High capital expenditure, long development cycles, and stringent quality control are major barriers.
Submarine Industry Growth Trends & Insights
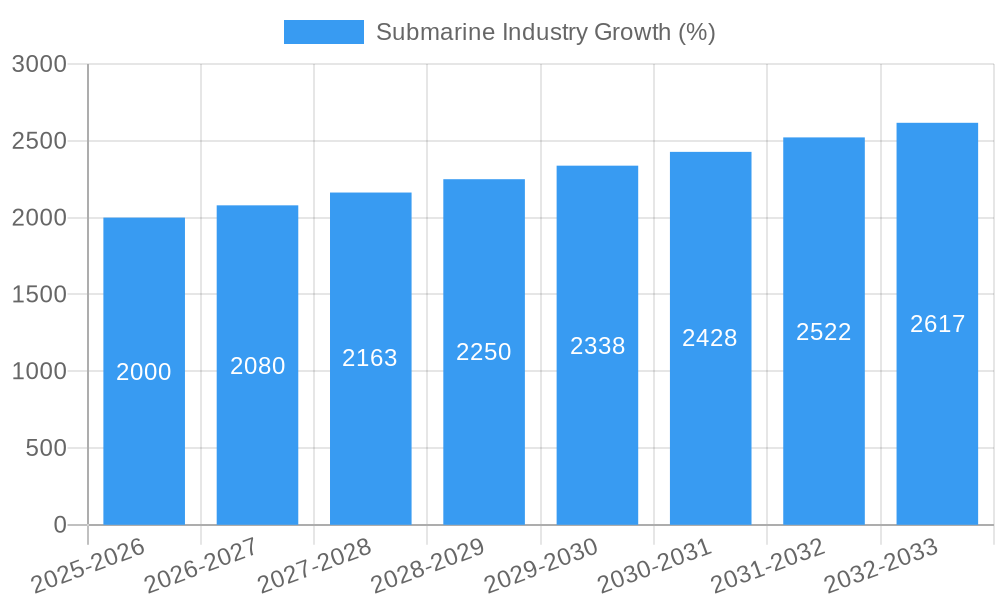
The global submarine market is projected to experience substantial growth throughout the forecast period (2025-2033). Driven by increasing geopolitical tensions, modernization of naval fleets, and the development of advanced submarine technologies, the market is expected to exhibit a Compound Annual Growth Rate (CAGR) of xx% from 2025 to 2033. This growth will be influenced by various factors, including the adoption of new submarine designs incorporating advanced capabilities such as improved stealth technology, enhanced sensor systems, and autonomous features. Changes in global power dynamics and defense budgets will also play a critical role. Furthermore, the report assesses the impact of technological disruptions, such as the introduction of unmanned underwater vehicles (UUVs) and artificial intelligence (AI)-powered systems, on market adoption rates and consumer behavior (primarily governmental naval forces). Market penetration rates for specific submarine types will be analyzed and presented within the full report. The analysis considers historical market data (2019-2024) to establish a robust baseline for future projections.
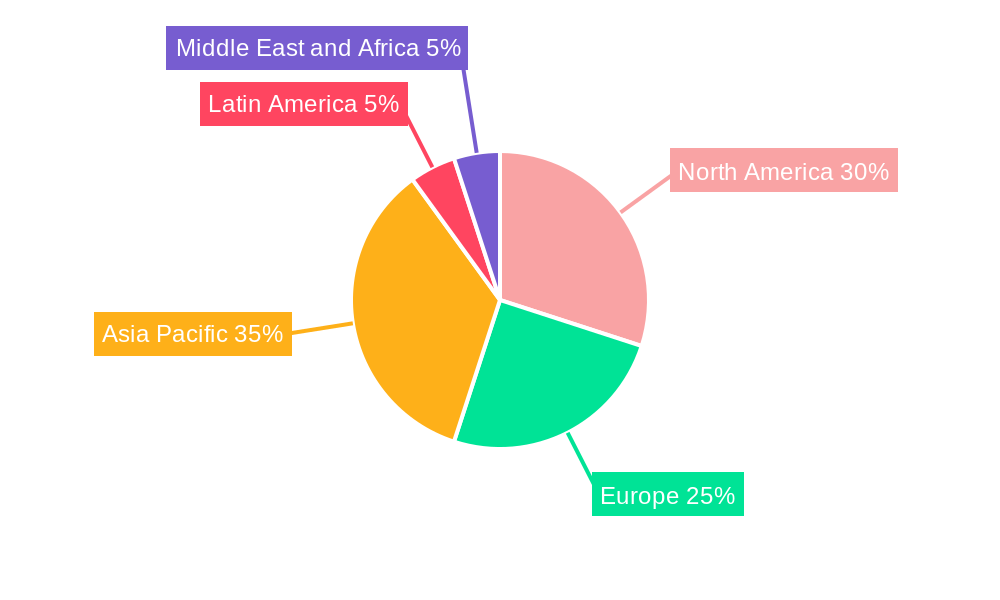
Dominant Regions, Countries, or Segments in Submarine Industry
The submarine industry is geographically concentrated, with key regions and countries driving market growth. North America and Europe currently hold a significant market share, driven by robust defense budgets and technologically advanced submarine programs. However, Asia-Pacific is poised for significant growth, fueled by increasing military spending and a surge in demand from countries like India, China, and South Korea. Specific submarine types also exhibit regional dominance: Nuclear-powered submarines (SSNs) are more common in developed nations, while diesel-electric submarines (SSKs) are popular in developing countries.
- Leading Region: North America and Europe (combined market share xx% in 2025).
- Fastest-Growing Region: Asia-Pacific, driven by increased defense expenditure and modernization programs.
- Dominant Segment: Diesel-Electric Submarines (SSKs), representing xx% of the market in 2025 due to lower cost and wider global demand.
- Key Drivers (Asia-Pacific): Rising geopolitical tensions, expanding naval forces, and economic growth enabling increased military investment.
- Key Drivers (North America & Europe): Strong defense budgets, technological leadership, and advanced submarine programs.
Submarine Industry Product Landscape
The submarine product landscape is constantly evolving, with a focus on improved stealth capabilities, enhanced sensor technology, and greater autonomy. Manufacturers are integrating advanced materials, AI-powered systems, and sophisticated propulsion systems to enhance performance and operational effectiveness. Unique selling propositions include increased range, improved survivability, and enhanced mission capabilities. Technological advancements such as advanced sonar systems and improved underwater communication technologies are driving product innovation.
Key Drivers, Barriers & Challenges in Submarine Industry
Key Drivers:
- Increasing geopolitical tensions and the need for naval modernization.
- Technological advancements in submarine design and capabilities.
- Rising defense budgets in several regions globally.
Key Challenges:
- High development and manufacturing costs, resulting in limited affordability for some nations.
- Stringent export control regulations and the need for international collaboration.
- Supply chain vulnerabilities and the need for secure material sourcing. (Estimated xx% increase in material costs from 2024 to 2025 due to global supply issues).
Emerging Opportunities in Submarine Industry
Emerging opportunities are driven by increased demand for unmanned underwater vehicles (UUVs), the development of AI-powered submarine systems, and the exploration of new applications, such as deep-sea exploration and underwater infrastructure monitoring. Focus on developing cost-effective submarine solutions for smaller naval forces presents a promising opportunity. Moreover, the integration of renewable energy technologies in submarine propulsion systems is an area of growing interest.
Growth Accelerators in the Submarine Industry Industry
Technological advancements such as next-generation propulsion systems and advanced sensor technologies will drive industry growth. Strategic partnerships between defense contractors and technology companies will lead to the development of cutting-edge submarine capabilities. Expansion into new markets and the development of specialized submarine designs for specific tasks will further stimulate market growth.
Key Players Shaping the Submarine Industry Market
- General Dynamics Corporation
- Naval Group
- FINCANTIERI S p A
- HD Hyundai Heavy Industries
- thyssenkrupp AG
- Daewoo Shipbuilding & Marine Engineering Co Ltd
- Huntington Ingalls Industries Inc
- Navantia S A SM E
- BAE Systems plc
- United Shipbuilding Corporation
- Saab AB
- Mitsubishi Heavy Industries Ltd
Notable Milestones in Submarine Industry Sector
- December 2022: Indian shipbuilder Mazagon Dock Limited (MDL) delivered "Vagir," the fifth Scorpene-type submarine to the Indian Navy. This demonstrates growing demand in the Asia-Pacific region.
- December 2022: Russia commissioned the Generalissimus Suvorov, a nuclear-powered ballistic missile submarine, signaling continued investment in advanced submarine technology.
- December 2022: The UK Royal Navy ordered its first unmanned submarine, the Cetus, signifying the growing importance of autonomous underwater vehicles in naval operations.
In-Depth Submarine Industry Market Outlook
The submarine industry is poised for continued growth, driven by technological innovation, increasing geopolitical instability, and sustained investment in naval modernization programs. Strategic partnerships, technological breakthroughs in areas such as AI and autonomous systems, and the expansion into new niche markets will shape future market potential and unlock significant strategic opportunities for key players. The market's long-term prospects are strong, with a projected market size of xx Million by 2033.
Submarine Industry Segmentation
- 1. Production Analysis
- 2. Consumption Analysis
- 3. Import Market Analysis (Value & Volume)
- 4. Export Market Analysis (Value & Volume)
- 5. Price Trend Analysis
Submarine Industry Segmentation By Geography
-
1. North America
- 1.1. United States
- 1.2. Canada
- 1.3. Mexico
-
2. South America
- 2.1. Brazil
- 2.2. Argentina
- 2.3. Rest of South America
-
3. Europe
- 3.1. United Kingdom
- 3.2. Germany
- 3.3. France
- 3.4. Italy
- 3.5. Spain
- 3.6. Russia
- 3.7. Benelux
- 3.8. Nordics
- 3.9. Rest of Europe
-
4. Middle East & Africa
- 4.1. Turkey
- 4.2. Israel
- 4.3. GCC
- 4.4. North Africa
- 4.5. South Africa
- 4.6. Rest of Middle East & Africa
-
5. Asia Pacific
- 5.1. China
- 5.2. India
- 5.3. Japan
- 5.4. South Korea
- 5.5. ASEAN
- 5.6. Oceania
- 5.7. Rest of Asia Pacific
Submarine Industry REPORT HIGHLIGHTS
| Aspects | Details |
|---|---|
| Study Period | 2019-2033 |
| Base Year | 2024 |
| Estimated Year | 2025 |
| Forecast Period | 2025-2033 |
| Historical Period | 2019-2024 |
| Growth Rate | CAGR of > 4.00% from 2019-2033 |
| Segmentation |
|
Table of Contents
- 1. Introduction
- 1.1. Research Scope
- 1.2. Market Segmentation
- 1.3. Research Methodology
- 1.4. Definitions and Assumptions
- 2. Executive Summary
- 2.1. Introduction
- 3. Market Dynamics
- 3.1. Introduction
- 3.2. Market Drivers
- 3.2.1. Increase in Internet of Things (IoT) and Autonomous Systems; Rise in Demand for Military and Defense Satellite Communication Solutions
- 3.3. Market Restrains
- 3.3.1. Cybersecurity Threats to Satellite Communication; Interference in Transmission of Data
- 3.4. Market Trends
- 3.4.1. Nuclear-Powered Submarines (SSN) Segment Is Anticipated to Grow with the Highest CAGR During the Forecast Period
- 4. Market Factor Analysis
- 4.1. Porters Five Forces
- 4.2. Supply/Value Chain
- 4.3. PESTEL analysis
- 4.4. Market Entropy
- 4.5. Patent/Trademark Analysis
- 5. Global Submarine Industry Analysis, Insights and Forecast, 2019-2031
- 5.1. Market Analysis, Insights and Forecast - by Production Analysis
- 5.2. Market Analysis, Insights and Forecast - by Consumption Analysis
- 5.3. Market Analysis, Insights and Forecast - by Import Market Analysis (Value & Volume)
- 5.4. Market Analysis, Insights and Forecast - by Export Market Analysis (Value & Volume)
- 5.5. Market Analysis, Insights and Forecast - by Price Trend Analysis
- 5.6. Market Analysis, Insights and Forecast - by Region
- 5.6.1. North America
- 5.6.2. South America
- 5.6.3. Europe
- 5.6.4. Middle East & Africa
- 5.6.5. Asia Pacific
- 5.1. Market Analysis, Insights and Forecast - by Production Analysis
- 6. North America Submarine Industry Analysis, Insights and Forecast, 2019-2031
- 6.1. Market Analysis, Insights and Forecast - by Production Analysis
- 6.2. Market Analysis, Insights and Forecast - by Consumption Analysis
- 6.3. Market Analysis, Insights and Forecast - by Import Market Analysis (Value & Volume)
- 6.4. Market Analysis, Insights and Forecast - by Export Market Analysis (Value & Volume)
- 6.5. Market Analysis, Insights and Forecast - by Price Trend Analysis
- 6.1. Market Analysis, Insights and Forecast - by Production Analysis
- 7. South America Submarine Industry Analysis, Insights and Forecast, 2019-2031
- 7.1. Market Analysis, Insights and Forecast - by Production Analysis
- 7.2. Market Analysis, Insights and Forecast - by Consumption Analysis
- 7.3. Market Analysis, Insights and Forecast - by Import Market Analysis (Value & Volume)
- 7.4. Market Analysis, Insights and Forecast - by Export Market Analysis (Value & Volume)
- 7.5. Market Analysis, Insights and Forecast - by Price Trend Analysis
- 7.1. Market Analysis, Insights and Forecast - by Production Analysis
- 8. Europe Submarine Industry Analysis, Insights and Forecast, 2019-2031
- 8.1. Market Analysis, Insights and Forecast - by Production Analysis
- 8.2. Market Analysis, Insights and Forecast - by Consumption Analysis
- 8.3. Market Analysis, Insights and Forecast - by Import Market Analysis (Value & Volume)
- 8.4. Market Analysis, Insights and Forecast - by Export Market Analysis (Value & Volume)
- 8.5. Market Analysis, Insights and Forecast - by Price Trend Analysis
- 8.1. Market Analysis, Insights and Forecast - by Production Analysis
- 9. Middle East & Africa Submarine Industry Analysis, Insights and Forecast, 2019-2031
- 9.1. Market Analysis, Insights and Forecast - by Production Analysis
- 9.2. Market Analysis, Insights and Forecast - by Consumption Analysis
- 9.3. Market Analysis, Insights and Forecast - by Import Market Analysis (Value & Volume)
- 9.4. Market Analysis, Insights and Forecast - by Export Market Analysis (Value & Volume)
- 9.5. Market Analysis, Insights and Forecast - by Price Trend Analysis
- 9.1. Market Analysis, Insights and Forecast - by Production Analysis
- 10. Asia Pacific Submarine Industry Analysis, Insights and Forecast, 2019-2031
- 10.1. Market Analysis, Insights and Forecast - by Production Analysis
- 10.2. Market Analysis, Insights and Forecast - by Consumption Analysis
- 10.3. Market Analysis, Insights and Forecast - by Import Market Analysis (Value & Volume)
- 10.4. Market Analysis, Insights and Forecast - by Export Market Analysis (Value & Volume)
- 10.5. Market Analysis, Insights and Forecast - by Price Trend Analysis
- 10.1. Market Analysis, Insights and Forecast - by Production Analysis
- 11. North America Submarine Industry Analysis, Insights and Forecast, 2019-2031
- 11.1. Market Analysis, Insights and Forecast - By Country/Sub-region
- 11.1.1 United States
- 11.1.2 Canada
- 12. Europe Submarine Industry Analysis, Insights and Forecast, 2019-2031
- 12.1. Market Analysis, Insights and Forecast - By Country/Sub-region
- 12.1.1 Germany
- 12.1.2 United Kingdom
- 12.1.3 France
- 12.1.4 Rest of Europe
- 13. Asia Pacific Submarine Industry Analysis, Insights and Forecast, 2019-2031
- 13.1. Market Analysis, Insights and Forecast - By Country/Sub-region
- 13.1.1 China
- 13.1.2 India
- 13.1.3 Japan
- 13.1.4 Australia
- 13.1.5 Rest of Asia Pacific
- 14. Latin America Submarine Industry Analysis, Insights and Forecast, 2019-2031
- 14.1. Market Analysis, Insights and Forecast - By Country/Sub-region
- 14.1.1 Brazil
- 14.1.2 Rest of Latin America
- 15. Middle East and Africa Submarine Industry Analysis, Insights and Forecast, 2019-2031
- 15.1. Market Analysis, Insights and Forecast - By Country/Sub-region
- 15.1.1 South Africa
- 15.1.2 Rest of Middle East and Africa
- 16. Competitive Analysis
- 16.1. Global Market Share Analysis 2024
- 16.2. Company Profiles
- 16.2.1 General Dynamics Corporation
- 16.2.1.1. Overview
- 16.2.1.2. Products
- 16.2.1.3. SWOT Analysis
- 16.2.1.4. Recent Developments
- 16.2.1.5. Financials (Based on Availability)
- 16.2.2 Naval Group
- 16.2.2.1. Overview
- 16.2.2.2. Products
- 16.2.2.3. SWOT Analysis
- 16.2.2.4. Recent Developments
- 16.2.2.5. Financials (Based on Availability)
- 16.2.3 FINCANTIERI S p A
- 16.2.3.1. Overview
- 16.2.3.2. Products
- 16.2.3.3. SWOT Analysis
- 16.2.3.4. Recent Developments
- 16.2.3.5. Financials (Based on Availability)
- 16.2.4 HD Hyundai Heavy Industries
- 16.2.4.1. Overview
- 16.2.4.2. Products
- 16.2.4.3. SWOT Analysis
- 16.2.4.4. Recent Developments
- 16.2.4.5. Financials (Based on Availability)
- 16.2.5 thyssenkrupp AG
- 16.2.5.1. Overview
- 16.2.5.2. Products
- 16.2.5.3. SWOT Analysis
- 16.2.5.4. Recent Developments
- 16.2.5.5. Financials (Based on Availability)
- 16.2.6 Daewoo Shipbuilding & Marine Engineering Co Ltd
- 16.2.6.1. Overview
- 16.2.6.2. Products
- 16.2.6.3. SWOT Analysis
- 16.2.6.4. Recent Developments
- 16.2.6.5. Financials (Based on Availability)
- 16.2.7 Huntington Ingalls Industries Inc
- 16.2.7.1. Overview
- 16.2.7.2. Products
- 16.2.7.3. SWOT Analysis
- 16.2.7.4. Recent Developments
- 16.2.7.5. Financials (Based on Availability)
- 16.2.8 Navantia S A SM E
- 16.2.8.1. Overview
- 16.2.8.2. Products
- 16.2.8.3. SWOT Analysis
- 16.2.8.4. Recent Developments
- 16.2.8.5. Financials (Based on Availability)
- 16.2.9 BAE Systems plc
- 16.2.9.1. Overview
- 16.2.9.2. Products
- 16.2.9.3. SWOT Analysis
- 16.2.9.4. Recent Developments
- 16.2.9.5. Financials (Based on Availability)
- 16.2.10 United Shipbuilding Corporation
- 16.2.10.1. Overview
- 16.2.10.2. Products
- 16.2.10.3. SWOT Analysis
- 16.2.10.4. Recent Developments
- 16.2.10.5. Financials (Based on Availability)
- 16.2.11 Saab AB
- 16.2.11.1. Overview
- 16.2.11.2. Products
- 16.2.11.3. SWOT Analysis
- 16.2.11.4. Recent Developments
- 16.2.11.5. Financials (Based on Availability)
- 16.2.12 Mitsubishi Heavy Industries Ltd
- 16.2.12.1. Overview
- 16.2.12.2. Products
- 16.2.12.3. SWOT Analysis
- 16.2.12.4. Recent Developments
- 16.2.12.5. Financials (Based on Availability)
- 16.2.1 General Dynamics Corporation
List of Figures
- Figure 1: Global Submarine Industry Revenue Breakdown (Million, %) by Region 2024 & 2032
- Figure 2: North America Submarine Industry Revenue (Million), by Country 2024 & 2032
- Figure 3: North America Submarine Industry Revenue Share (%), by Country 2024 & 2032
- Figure 4: Europe Submarine Industry Revenue (Million), by Country 2024 & 2032
- Figure 5: Europe Submarine Industry Revenue Share (%), by Country 2024 & 2032
- Figure 6: Asia Pacific Submarine Industry Revenue (Million), by Country 2024 & 2032
- Figure 7: Asia Pacific Submarine Industry Revenue Share (%), by Country 2024 & 2032
- Figure 8: Latin America Submarine Industry Revenue (Million), by Country 2024 & 2032
- Figure 9: Latin America Submarine Industry Revenue Share (%), by Country 2024 & 2032
- Figure 10: Middle East and Africa Submarine Industry Revenue (Million), by Country 2024 & 2032
- Figure 11: Middle East and Africa Submarine Industry Revenue Share (%), by Country 2024 & 2032
- Figure 12: North America Submarine Industry Revenue (Million), by Production Analysis 2024 & 2032
- Figure 13: North America Submarine Industry Revenue Share (%), by Production Analysis 2024 & 2032
- Figure 14: North America Submarine Industry Revenue (Million), by Consumption Analysis 2024 & 2032
- Figure 15: North America Submarine Industry Revenue Share (%), by Consumption Analysis 2024 & 2032
- Figure 16: North America Submarine Industry Revenue (Million), by Import Market Analysis (Value & Volume) 2024 & 2032
- Figure 17: North America Submarine Industry Revenue Share (%), by Import Market Analysis (Value & Volume) 2024 & 2032
- Figure 18: North America Submarine Industry Revenue (Million), by Export Market Analysis (Value & Volume) 2024 & 2032
- Figure 19: North America Submarine Industry Revenue Share (%), by Export Market Analysis (Value & Volume) 2024 & 2032
- Figure 20: North America Submarine Industry Revenue (Million), by Price Trend Analysis 2024 & 2032
- Figure 21: North America Submarine Industry Revenue Share (%), by Price Trend Analysis 2024 & 2032
- Figure 22: North America Submarine Industry Revenue (Million), by Country 2024 & 2032
- Figure 23: North America Submarine Industry Revenue Share (%), by Country 2024 & 2032
- Figure 24: South America Submarine Industry Revenue (Million), by Production Analysis 2024 & 2032
- Figure 25: South America Submarine Industry Revenue Share (%), by Production Analysis 2024 & 2032
- Figure 26: South America Submarine Industry Revenue (Million), by Consumption Analysis 2024 & 2032
- Figure 27: South America Submarine Industry Revenue Share (%), by Consumption Analysis 2024 & 2032
- Figure 28: South America Submarine Industry Revenue (Million), by Import Market Analysis (Value & Volume) 2024 & 2032
- Figure 29: South America Submarine Industry Revenue Share (%), by Import Market Analysis (Value & Volume) 2024 & 2032
- Figure 30: South America Submarine Industry Revenue (Million), by Export Market Analysis (Value & Volume) 2024 & 2032
- Figure 31: South America Submarine Industry Revenue Share (%), by Export Market Analysis (Value & Volume) 2024 & 2032
- Figure 32: South America Submarine Industry Revenue (Million), by Price Trend Analysis 2024 & 2032
- Figure 33: South America Submarine Industry Revenue Share (%), by Price Trend Analysis 2024 & 2032
- Figure 34: South America Submarine Industry Revenue (Million), by Country 2024 & 2032
- Figure 35: South America Submarine Industry Revenue Share (%), by Country 2024 & 2032
- Figure 36: Europe Submarine Industry Revenue (Million), by Production Analysis 2024 & 2032
- Figure 37: Europe Submarine Industry Revenue Share (%), by Production Analysis 2024 & 2032
- Figure 38: Europe Submarine Industry Revenue (Million), by Consumption Analysis 2024 & 2032
- Figure 39: Europe Submarine Industry Revenue Share (%), by Consumption Analysis 2024 & 2032
- Figure 40: Europe Submarine Industry Revenue (Million), by Import Market Analysis (Value & Volume) 2024 & 2032
- Figure 41: Europe Submarine Industry Revenue Share (%), by Import Market Analysis (Value & Volume) 2024 & 2032
- Figure 42: Europe Submarine Industry Revenue (Million), by Export Market Analysis (Value & Volume) 2024 & 2032
- Figure 43: Europe Submarine Industry Revenue Share (%), by Export Market Analysis (Value & Volume) 2024 & 2032
- Figure 44: Europe Submarine Industry Revenue (Million), by Price Trend Analysis 2024 & 2032
- Figure 45: Europe Submarine Industry Revenue Share (%), by Price Trend Analysis 2024 & 2032
- Figure 46: Europe Submarine Industry Revenue (Million), by Country 2024 & 2032
- Figure 47: Europe Submarine Industry Revenue Share (%), by Country 2024 & 2032
- Figure 48: Middle East & Africa Submarine Industry Revenue (Million), by Production Analysis 2024 & 2032
- Figure 49: Middle East & Africa Submarine Industry Revenue Share (%), by Production Analysis 2024 & 2032
- Figure 50: Middle East & Africa Submarine Industry Revenue (Million), by Consumption Analysis 2024 & 2032
- Figure 51: Middle East & Africa Submarine Industry Revenue Share (%), by Consumption Analysis 2024 & 2032
- Figure 52: Middle East & Africa Submarine Industry Revenue (Million), by Import Market Analysis (Value & Volume) 2024 & 2032
- Figure 53: Middle East & Africa Submarine Industry Revenue Share (%), by Import Market Analysis (Value & Volume) 2024 & 2032
- Figure 54: Middle East & Africa Submarine Industry Revenue (Million), by Export Market Analysis (Value & Volume) 2024 & 2032
- Figure 55: Middle East & Africa Submarine Industry Revenue Share (%), by Export Market Analysis (Value & Volume) 2024 & 2032
- Figure 56: Middle East & Africa Submarine Industry Revenue (Million), by Price Trend Analysis 2024 & 2032
- Figure 57: Middle East & Africa Submarine Industry Revenue Share (%), by Price Trend Analysis 2024 & 2032
- Figure 58: Middle East & Africa Submarine Industry Revenue (Million), by Country 2024 & 2032
- Figure 59: Middle East & Africa Submarine Industry Revenue Share (%), by Country 2024 & 2032
- Figure 60: Asia Pacific Submarine Industry Revenue (Million), by Production Analysis 2024 & 2032
- Figure 61: Asia Pacific Submarine Industry Revenue Share (%), by Production Analysis 2024 & 2032
- Figure 62: Asia Pacific Submarine Industry Revenue (Million), by Consumption Analysis 2024 & 2032
- Figure 63: Asia Pacific Submarine Industry Revenue Share (%), by Consumption Analysis 2024 & 2032
- Figure 64: Asia Pacific Submarine Industry Revenue (Million), by Import Market Analysis (Value & Volume) 2024 & 2032
- Figure 65: Asia Pacific Submarine Industry Revenue Share (%), by Import Market Analysis (Value & Volume) 2024 & 2032
- Figure 66: Asia Pacific Submarine Industry Revenue (Million), by Export Market Analysis (Value & Volume) 2024 & 2032
- Figure 67: Asia Pacific Submarine Industry Revenue Share (%), by Export Market Analysis (Value & Volume) 2024 & 2032
- Figure 68: Asia Pacific Submarine Industry Revenue (Million), by Price Trend Analysis 2024 & 2032
- Figure 69: Asia Pacific Submarine Industry Revenue Share (%), by Price Trend Analysis 2024 & 2032
- Figure 70: Asia Pacific Submarine Industry Revenue (Million), by Country 2024 & 2032
- Figure 71: Asia Pacific Submarine Industry Revenue Share (%), by Country 2024 & 2032
List of Tables
- Table 1: Global Submarine Industry Revenue Million Forecast, by Region 2019 & 2032
- Table 2: Global Submarine Industry Revenue Million Forecast, by Production Analysis 2019 & 2032
- Table 3: Global Submarine Industry Revenue Million Forecast, by Consumption Analysis 2019 & 2032
- Table 4: Global Submarine Industry Revenue Million Forecast, by Import Market Analysis (Value & Volume) 2019 & 2032
- Table 5: Global Submarine Industry Revenue Million Forecast, by Export Market Analysis (Value & Volume) 2019 & 2032
- Table 6: Global Submarine Industry Revenue Million Forecast, by Price Trend Analysis 2019 & 2032
- Table 7: Global Submarine Industry Revenue Million Forecast, by Region 2019 & 2032
- Table 8: Global Submarine Industry Revenue Million Forecast, by Country 2019 & 2032
- Table 9: United States Submarine Industry Revenue (Million) Forecast, by Application 2019 & 2032
- Table 10: Canada Submarine Industry Revenue (Million) Forecast, by Application 2019 & 2032
- Table 11: Global Submarine Industry Revenue Million Forecast, by Country 2019 & 2032
- Table 12: Germany Submarine Industry Revenue (Million) Forecast, by Application 2019 & 2032
- Table 13: United Kingdom Submarine Industry Revenue (Million) Forecast, by Application 2019 & 2032
- Table 14: France Submarine Industry Revenue (Million) Forecast, by Application 2019 & 2032
- Table 15: Rest of Europe Submarine Industry Revenue (Million) Forecast, by Application 2019 & 2032
- Table 16: Global Submarine Industry Revenue Million Forecast, by Country 2019 & 2032
- Table 17: China Submarine Industry Revenue (Million) Forecast, by Application 2019 & 2032
- Table 18: India Submarine Industry Revenue (Million) Forecast, by Application 2019 & 2032
- Table 19: Japan Submarine Industry Revenue (Million) Forecast, by Application 2019 & 2032
- Table 20: Australia Submarine Industry Revenue (Million) Forecast, by Application 2019 & 2032
- Table 21: Rest of Asia Pacific Submarine Industry Revenue (Million) Forecast, by Application 2019 & 2032
- Table 22: Global Submarine Industry Revenue Million Forecast, by Country 2019 & 2032
- Table 23: Brazil Submarine Industry Revenue (Million) Forecast, by Application 2019 & 2032
- Table 24: Rest of Latin America Submarine Industry Revenue (Million) Forecast, by Application 2019 & 2032
- Table 25: Global Submarine Industry Revenue Million Forecast, by Country 2019 & 2032
- Table 26: South Africa Submarine Industry Revenue (Million) Forecast, by Application 2019 & 2032
- Table 27: Rest of Middle East and Africa Submarine Industry Revenue (Million) Forecast, by Application 2019 & 2032
- Table 28: Global Submarine Industry Revenue Million Forecast, by Production Analysis 2019 & 2032
- Table 29: Global Submarine Industry Revenue Million Forecast, by Consumption Analysis 2019 & 2032
- Table 30: Global Submarine Industry Revenue Million Forecast, by Import Market Analysis (Value & Volume) 2019 & 2032
- Table 31: Global Submarine Industry Revenue Million Forecast, by Export Market Analysis (Value & Volume) 2019 & 2032
- Table 32: Global Submarine Industry Revenue Million Forecast, by Price Trend Analysis 2019 & 2032
- Table 33: Global Submarine Industry Revenue Million Forecast, by Country 2019 & 2032
- Table 34: United States Submarine Industry Revenue (Million) Forecast, by Application 2019 & 2032
- Table 35: Canada Submarine Industry Revenue (Million) Forecast, by Application 2019 & 2032
- Table 36: Mexico Submarine Industry Revenue (Million) Forecast, by Application 2019 & 2032
- Table 37: Global Submarine Industry Revenue Million Forecast, by Production Analysis 2019 & 2032
- Table 38: Global Submarine Industry Revenue Million Forecast, by Consumption Analysis 2019 & 2032
- Table 39: Global Submarine Industry Revenue Million Forecast, by Import Market Analysis (Value & Volume) 2019 & 2032
- Table 40: Global Submarine Industry Revenue Million Forecast, by Export Market Analysis (Value & Volume) 2019 & 2032
- Table 41: Global Submarine Industry Revenue Million Forecast, by Price Trend Analysis 2019 & 2032
- Table 42: Global Submarine Industry Revenue Million Forecast, by Country 2019 & 2032
- Table 43: Brazil Submarine Industry Revenue (Million) Forecast, by Application 2019 & 2032
- Table 44: Argentina Submarine Industry Revenue (Million) Forecast, by Application 2019 & 2032
- Table 45: Rest of South America Submarine Industry Revenue (Million) Forecast, by Application 2019 & 2032
- Table 46: Global Submarine Industry Revenue Million Forecast, by Production Analysis 2019 & 2032
- Table 47: Global Submarine Industry Revenue Million Forecast, by Consumption Analysis 2019 & 2032
- Table 48: Global Submarine Industry Revenue Million Forecast, by Import Market Analysis (Value & Volume) 2019 & 2032
- Table 49: Global Submarine Industry Revenue Million Forecast, by Export Market Analysis (Value & Volume) 2019 & 2032
- Table 50: Global Submarine Industry Revenue Million Forecast, by Price Trend Analysis 2019 & 2032
- Table 51: Global Submarine Industry Revenue Million Forecast, by Country 2019 & 2032
- Table 52: United Kingdom Submarine Industry Revenue (Million) Forecast, by Application 2019 & 2032
- Table 53: Germany Submarine Industry Revenue (Million) Forecast, by Application 2019 & 2032
- Table 54: France Submarine Industry Revenue (Million) Forecast, by Application 2019 & 2032
- Table 55: Italy Submarine Industry Revenue (Million) Forecast, by Application 2019 & 2032
- Table 56: Spain Submarine Industry Revenue (Million) Forecast, by Application 2019 & 2032
- Table 57: Russia Submarine Industry Revenue (Million) Forecast, by Application 2019 & 2032
- Table 58: Benelux Submarine Industry Revenue (Million) Forecast, by Application 2019 & 2032
- Table 59: Nordics Submarine Industry Revenue (Million) Forecast, by Application 2019 & 2032
- Table 60: Rest of Europe Submarine Industry Revenue (Million) Forecast, by Application 2019 & 2032
- Table 61: Global Submarine Industry Revenue Million Forecast, by Production Analysis 2019 & 2032
- Table 62: Global Submarine Industry Revenue Million Forecast, by Consumption Analysis 2019 & 2032
- Table 63: Global Submarine Industry Revenue Million Forecast, by Import Market Analysis (Value & Volume) 2019 & 2032
- Table 64: Global Submarine Industry Revenue Million Forecast, by Export Market Analysis (Value & Volume) 2019 & 2032
- Table 65: Global Submarine Industry Revenue Million Forecast, by Price Trend Analysis 2019 & 2032
- Table 66: Global Submarine Industry Revenue Million Forecast, by Country 2019 & 2032
- Table 67: Turkey Submarine Industry Revenue (Million) Forecast, by Application 2019 & 2032
- Table 68: Israel Submarine Industry Revenue (Million) Forecast, by Application 2019 & 2032
- Table 69: GCC Submarine Industry Revenue (Million) Forecast, by Application 2019 & 2032
- Table 70: North Africa Submarine Industry Revenue (Million) Forecast, by Application 2019 & 2032
- Table 71: South Africa Submarine Industry Revenue (Million) Forecast, by Application 2019 & 2032
- Table 72: Rest of Middle East & Africa Submarine Industry Revenue (Million) Forecast, by Application 2019 & 2032
- Table 73: Global Submarine Industry Revenue Million Forecast, by Production Analysis 2019 & 2032
- Table 74: Global Submarine Industry Revenue Million Forecast, by Consumption Analysis 2019 & 2032
- Table 75: Global Submarine Industry Revenue Million Forecast, by Import Market Analysis (Value & Volume) 2019 & 2032
- Table 76: Global Submarine Industry Revenue Million Forecast, by Export Market Analysis (Value & Volume) 2019 & 2032
- Table 77: Global Submarine Industry Revenue Million Forecast, by Price Trend Analysis 2019 & 2032
- Table 78: Global Submarine Industry Revenue Million Forecast, by Country 2019 & 2032
- Table 79: China Submarine Industry Revenue (Million) Forecast, by Application 2019 & 2032
- Table 80: India Submarine Industry Revenue (Million) Forecast, by Application 2019 & 2032
- Table 81: Japan Submarine Industry Revenue (Million) Forecast, by Application 2019 & 2032
- Table 82: South Korea Submarine Industry Revenue (Million) Forecast, by Application 2019 & 2032
- Table 83: ASEAN Submarine Industry Revenue (Million) Forecast, by Application 2019 & 2032
- Table 84: Oceania Submarine Industry Revenue (Million) Forecast, by Application 2019 & 2032
- Table 85: Rest of Asia Pacific Submarine Industry Revenue (Million) Forecast, by Application 2019 & 2032
Frequently Asked Questions
1. What is the projected Compound Annual Growth Rate (CAGR) of the Submarine Industry?
The projected CAGR is approximately > 4.00%.
2. Which companies are prominent players in the Submarine Industry?
Key companies in the market include General Dynamics Corporation, Naval Group, FINCANTIERI S p A, HD Hyundai Heavy Industries, thyssenkrupp AG, Daewoo Shipbuilding & Marine Engineering Co Ltd, Huntington Ingalls Industries Inc, Navantia S A SM E, BAE Systems plc, United Shipbuilding Corporation, Saab AB, Mitsubishi Heavy Industries Ltd.
3. What are the main segments of the Submarine Industry?
The market segments include Production Analysis, Consumption Analysis, Import Market Analysis (Value & Volume), Export Market Analysis (Value & Volume), Price Trend Analysis.
4. Can you provide details about the market size?
The market size is estimated to be USD XX Million as of 2022.
5. What are some drivers contributing to market growth?
Increase in Internet of Things (IoT) and Autonomous Systems; Rise in Demand for Military and Defense Satellite Communication Solutions.
6. What are the notable trends driving market growth?
Nuclear-Powered Submarines (SSN) Segment Is Anticipated to Grow with the Highest CAGR During the Forecast Period.
7. Are there any restraints impacting market growth?
Cybersecurity Threats to Satellite Communication; Interference in Transmission of Data.
8. Can you provide examples of recent developments in the market?
December 2022: Indian shipbuilder Mazagon Dock Limited (MDL) announced that they delivered "Vagir," the fifth Scorpene-type submarine (Kalvari-class), to the Indian Navy.
9. What pricing options are available for accessing the report?
Pricing options include single-user, multi-user, and enterprise licenses priced at USD 4750, USD 5250, and USD 8750 respectively.
10. Is the market size provided in terms of value or volume?
The market size is provided in terms of value, measured in Million.
11. Are there any specific market keywords associated with the report?
Yes, the market keyword associated with the report is "Submarine Industry," which aids in identifying and referencing the specific market segment covered.
12. How do I determine which pricing option suits my needs best?
The pricing options vary based on user requirements and access needs. Individual users may opt for single-user licenses, while businesses requiring broader access may choose multi-user or enterprise licenses for cost-effective access to the report.
13. Are there any additional resources or data provided in the Submarine Industry report?
While the report offers comprehensive insights, it's advisable to review the specific contents or supplementary materials provided to ascertain if additional resources or data are available.
14. How can I stay updated on further developments or reports in the Submarine Industry?
To stay informed about further developments, trends, and reports in the Submarine Industry, consider subscribing to industry newsletters, following relevant companies and organizations, or regularly checking reputable industry news sources and publications.
Methodology
Step 1 - Identification of Relevant Samples Size from Population Database


Step 2 - Approaches for Defining Global Market Size (Value, Volume* & Price*)

Note*: In applicable scenarios
Step 3 - Data Sources
Primary Research
- Web Analytics
- Survey Reports
- Research Institute
- Latest Research Reports
- Opinion Leaders
Secondary Research
- Annual Reports
- White Paper
- Latest Press Release
- Industry Association
- Paid Database
- Investor Presentations

Step 4 - Data Triangulation
Involves using different sources of information in order to increase the validity of a study
These sources are likely to be stakeholders in a program - participants, other researchers, program staff, other community members, and so on.
Then we put all data in single framework & apply various statistical tools to find out the dynamic on the market.
During the analysis stage, feedback from the stakeholder groups would be compared to determine areas of agreement as well as areas of divergence


