

Key Insights
The strategic mineral materials market is projected to reach $8.9 billion by 2025, with an anticipated Compound Annual Growth Rate (CAGR) of 6.3% between 2025 and 2033. This robust growth is driven by escalating demand from the electric vehicle (EV) sector for battery minerals such as cobalt and rare earth elements, essential for electric motors and energy storage. The expanding renewable energy landscape, encompassing solar and wind power, further fuels demand for minerals like manganese for efficient energy generation and transmission. Technological progress in aerospace and medical applications also necessitates high-purity materials. While supply chain vulnerabilities and geopolitical factors present challenges, innovations in exploration, extraction, and recycling are mitigating these risks. Market segmentation indicates the dominance of specific minerals, like rare earth elements, and high-purity materials, aligning with technological requirements. Key industry players are strategically investing in exploration, processing, and refining to capitalize on these trends.
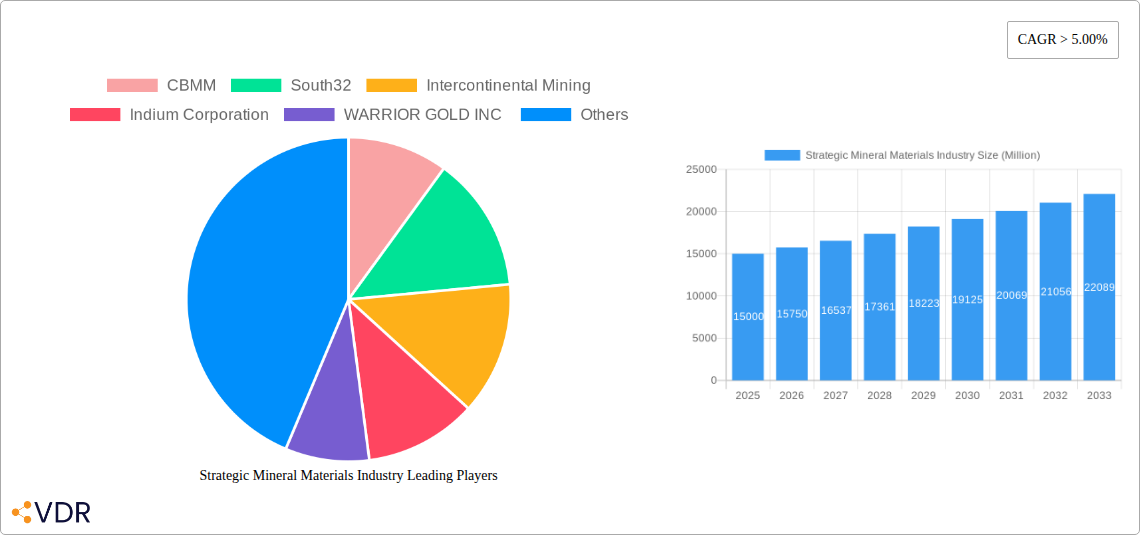
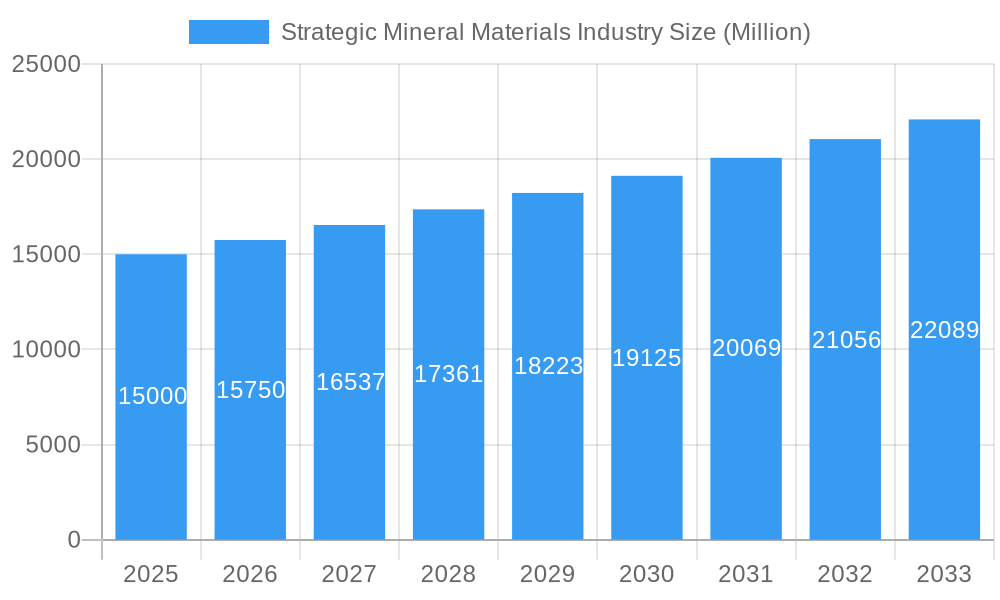
Strategic Mineral Materials Industry Market Size (In Billion)
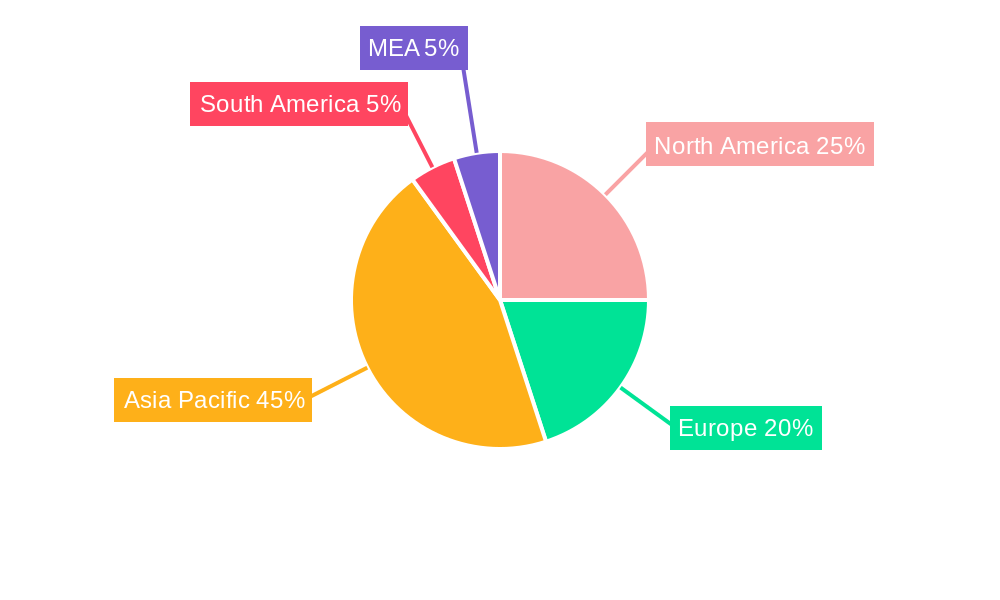
Geographically, the Asia-Pacific region, led by China, is expected to maintain its dominance due to a strong manufacturing base and increasing mineral consumption. North America and Europe are also demonstrating significant growth, driven by investments in renewable energy and advanced technologies. Diverse end-use industries, including aerospace, automotive, medical, electronics, and energy, underscore the broad demand for strategic mineral materials. The preference for specialized forms, such as high-purity powders and ingots, highlights the need for tailored material solutions. Future market expansion will be contingent on sustained technological advancements, sustainable mining practices, and effective supply chain risk management throughout the 2025-2033 forecast period.
Strategic Mineral Materials Industry Company Market Share
Strategic Mineral Materials Industry Market Report: 2019-2033
This comprehensive report provides an in-depth analysis of the Strategic Mineral Materials industry, encompassing market dynamics, growth trends, regional insights, product landscapes, and key players. The study period covers 2019-2033, with 2025 as the base and estimated year. This report is crucial for industry professionals, investors, and strategic decision-makers seeking a clear understanding of this evolving sector. We delve into parent markets like mining and metallurgy and child markets such as specific mineral applications in various end-use industries.
Strategic Mineral Materials Industry Market Dynamics & Structure
The strategic mineral materials market is characterized by moderate concentration, with a few dominant players alongside numerous smaller, specialized firms. Technological innovation, particularly in materials science and processing techniques, is a key driver, alongside evolving regulatory frameworks concerning environmental sustainability and resource management. Competition from substitute materials and the ongoing shift towards environmentally friendly alternatives are significant factors influencing market dynamics. Mergers and acquisitions (M&A) activity is steadily increasing, driven by the pursuit of scale, diversification, and access to crucial resources.
- Market Concentration: Moderately concentrated, with top 5 players holding approximately xx% market share in 2025.
- Technological Innovation: Significant advancements in extraction, processing, and refinement techniques.
- Regulatory Landscape: Increasingly stringent environmental regulations and resource management policies.
- Competitive Substitutes: Growing competition from advanced materials and recycled alternatives.
- M&A Activity: A steady rise in M&A deals, with an estimated xx deals in 2024, valued at xx million.
- Innovation Barriers: High capital expenditure requirements and lengthy development cycles for new technologies.
Strategic Mineral Materials Industry Growth Trends & Insights
The strategic mineral materials market is projected to experience robust growth over the forecast period (2025-2033). Driven by increasing demand from key end-use sectors like electric vehicles, renewable energy, and electronics, the market is expected to achieve a Compound Annual Growth Rate (CAGR) of xx% between 2025 and 2033. This growth is further fueled by technological advancements leading to the development of high-performance materials with improved properties. Consumer behavior shifts towards sustainable and environmentally friendly products also contribute to market expansion. Market penetration of new materials is expected to increase by xx% by 2033.
Dominant Regions, Countries, or Segments in Strategic Mineral Materials Industry
The dominant regions in the strategic mineral materials market include China, North America, and Europe, largely owing to established industries, substantial resource reserves, and supportive government policies. Within specific minerals, certain countries and segments emerge as leaders.
- Minerals: Rare Earth Elements (China), Cobalt (Democratic Republic of Congo), Niobium (Brazil), Platinum Group Elements (South Africa) show significant dominance.
- Grade: High-purity grades like Optical Grade, Vacuum Grade, and Reactor Grade are witnessing higher growth due to their specialized applications in advanced technologies. The market size for Optical Grade materials is estimated at xx million in 2025.
- Form: Powder and Fines dominate the market due to their versatility in various applications.
- End-Use Industry: The Electricals & Electronics, Energy & Power, and Aerospace sectors are the key drivers for growth, with the Electricals & Electronics sector projected to be worth xx million in 2025.
Key Drivers:
- Strong government support for strategic mineral development
- Robust growth of end-use sectors
- Expanding infrastructure projects
- Rising adoption of high-performance materials
Strategic Mineral Materials Industry Product Landscape
The strategic mineral materials landscape is characterized by continuous innovation focused on enhancing material properties, developing new applications, and improving processing efficiency. Recent advancements include the development of novel alloys and composites with improved strength, durability, and thermal stability. Companies are increasingly focusing on sustainability by developing environmentally friendly extraction and processing techniques. Unique selling propositions revolve around performance enhancement, cost-effectiveness, and sustainable practices.
Key Drivers, Barriers & Challenges in Strategic Mineral Materials Industry
Key Drivers:
- Growing demand from emerging technologies (e.g., EVs, renewable energy)
- Government initiatives promoting domestic production of strategic minerals
- Technological advancements leading to superior material properties
Key Challenges:
- Supply chain disruptions caused by geopolitical instability and resource scarcity
- Environmental regulations and sustainability concerns
- Price volatility of raw materials
- Intense competition among industry players
Emerging Opportunities in Strategic Mineral Materials Industry
The Strategic Mineral Materials industry presents several emerging opportunities. Untapped markets in developing economies, growing demand for sustainable and recycled materials, and the development of innovative applications in advanced technologies are creating new avenues for growth. This includes exploring new mineral resources, developing next-generation materials, and expanding into new geographical markets.
Growth Accelerators in the Strategic Mineral Materials Industry Industry
Long-term growth will be accelerated by technological breakthroughs in extraction and processing, strategic partnerships fostering collaboration in R&D, and expansion into high-growth markets such as electric vehicles and renewable energy. Continued investments in research and development, particularly in sustainability aspects, are vital for market expansion.
Key Players Shaping the Strategic Mineral Materials Industry Market
- CBMM
- South32
- Intercontinental Mining
- Indium Corporation
- WARRIOR GOLD INC
- Anglo American plc
- Glencore
- Vale
- Materion Corporation
Notable Milestones in Strategic Mineral Materials Industry Sector
- 2022-Q4: CBMM announced a significant expansion of its niobium production capacity.
- 2023-Q1: Anglo American plc invested in a new rare earth elements processing facility.
- 2024-Q2: A major merger between two smaller players consolidated market share. (Specific details not available - xx)
In-Depth Strategic Mineral Materials Industry Market Outlook
The strategic mineral materials market exhibits significant long-term growth potential, driven by technological advancements, increasing demand from key end-use sectors, and government support for the development of these crucial materials. Strategic partnerships, focused R&D, and a commitment to sustainable practices will be key success factors for companies operating in this dynamic market. The market is expected to reach xx million by 2033.
Strategic Mineral Materials Industry Segmentation
-
1. Mineral
-
1.1. Antimony
- 1.1.1. Flame Retardants
- 1.1.2. Batteries
- 1.1.3. Ceramics and Glass
- 1.1.4. Catalyst
- 1.1.5. Alloys
-
1.2. Barite
- 1.2.1. Oil and Gas
- 1.2.2. Other Ap
-
1.3. Beryllium
- 1.3.1. Electronics
- 1.3.2. Aerospace
- 1.3.3. Automotive
- 1.3.4. Energy
-
1.4. Cobalt
- 1.4.1. Superalloys
- 1.4.2. Cemented Carbides and Diamond Tools
- 1.4.3. Catalysts
-
1.5. Fluorspar
- 1.5.1. Chemicals
- 1.5.2. Steel
- 1.5.3. Aluminum
-
1.6. Gallium
- 1.6.1. Integrated Circuits
- 1.6.2. Laser diodes
- 1.6.3. Photodetectors
- 1.6.4. Solar Cells
-
1.7. Germanium
- 1.7.1. Fiber Optics
- 1.7.2. Infrared Optics
- 1.7.3. Electrical and Solar Equipment
-
1.8. Indium
- 1.8.1. Flat-Panel Display Screens and Touchscreens
- 1.8.2. Low Melting Alloys and Solders
- 1.8.3. Semiconductors
- 1.8.4. Transparent Heat Reflectors
-
1.9. Manganese
- 1.9.1. Casting Alloys
- 1.9.2. Packaging
- 1.9.3. Transportation
- 1.9.4. Construction
-
1.10. Niobium
- 1.10.1. Super Alloys
- 1.10.2. Superconducting Magnets
- 1.10.3. Capacitors
-
1.11. Platinum Group Elements
- 1.11.1. Autocatalyst
- 1.11.2. Jewelry
- 1.11.3. Electrical & Electronics
-
1.12. Rare Earth Elements
- 1.12.1. Magnetic Alloys
- 1.12.2. Metallurgy
-
1.13. Tantalum
- 1.13.1. Medical
-
1.1. Antimony
Strategic Mineral Materials Industry Segmentation By Geography
-
1. Asia Pacific
- 1.1. China
- 1.2. India
- 1.3. Japan
- 1.4. South Korea
- 1.5. ASEAN Countries
- 1.6. Rest of Asia Pacific
-
2. North America
- 2.1. United States
- 2.2. Canada
- 2.3. Mexico
-
3. Europe
- 3.1. Germany
- 3.2. United Kingdom
- 3.3. Italy
- 3.4. France
- 3.5. Spain
- 3.6. Rest of Europe
-
4. South America
- 4.1. Brazil
- 4.2. Argentina
- 4.3. Rest of South America
-
5. Middle East and Africa
- 5.1. Saudi Arabia
- 5.2. South Africa
- 5.3. Rest of Middle East and Africa
Strategic Mineral Materials Industry Regional Market Share
Geographic Coverage of Strategic Mineral Materials Industry
Strategic Mineral Materials Industry REPORT HIGHLIGHTS
| Aspects | Details |
|---|---|
| Study Period | 2020-2034 |
| Base Year | 2025 |
| Estimated Year | 2026 |
| Forecast Period | 2026-2034 |
| Historical Period | 2020-2025 |
| Growth Rate | CAGR of 6.3% from 2020-2034 |
| Segmentation |
|
Table of Contents
- 1. Introduction
- 1.1. Research Scope
- 1.2. Market Segmentation
- 1.3. Research Objective
- 1.4. Definitions and Assumptions
- 2. Executive Summary
- 2.1. Market Snapshot
- 3. Market Dynamics
- 3.1. Market Drivers
- 3.2. Market Restrains
- 3.3. Market Trends
- 3.4. Market Opportunities
- 4. Market Factor Analysis
- 4.1. Porters Five Forces
- 4.1.1. Bargaining Power of Suppliers
- 4.1.2. Bargaining Power of Buyers
- 4.1.3. Threat of New Entrants
- 4.1.4. Threat of Substitutes
- 4.1.5. Competitive Rivalry
- 4.2. PESTEL analysis
- 4.3. BCG Analysis
- 4.3.1. Stars (High Growth, High Market Share)
- 4.3.2. Cash Cows (Low Growth, High Market Share)
- 4.3.3. Question Mark (High Growth, Low Market Share)
- 4.3.4. Dogs (Low Growth, Low Market Share)
- 4.4. Ansoff Matrix Analysis
- 4.5. Supply Chain Analysis
- 4.6. Regulatory Landscape
- 4.7. Current Market Potential and Opportunity Assessment (TAM–SAM–SOM Framework)
- 4.8. VDR Analyst Note
- 4.1. Porters Five Forces
- 5. Market Analysis, Insights and Forecast 2021-2033
- 5.1. Market Analysis, Insights and Forecast - by Mineral
- 5.1.1. Antimony
- 5.1.1.1. Flame Retardants
- 5.1.1.2. Batteries
- 5.1.1.3. Ceramics and Glass
- 5.1.1.4. Catalyst
- 5.1.1.5. Alloys
- 5.1.2. Barite
- 5.1.2.1. Oil and Gas
- 5.1.2.2. Other Ap
- 5.1.3. Beryllium
- 5.1.3.1. Electronics
- 5.1.3.2. Aerospace
- 5.1.3.3. Automotive
- 5.1.3.4. Energy
- 5.1.4. Cobalt
- 5.1.4.1. Superalloys
- 5.1.4.2. Cemented Carbides and Diamond Tools
- 5.1.4.3. Catalysts
- 5.1.5. Fluorspar
- 5.1.5.1. Chemicals
- 5.1.5.2. Steel
- 5.1.5.3. Aluminum
- 5.1.6. Gallium
- 5.1.6.1. Integrated Circuits
- 5.1.6.2. Laser diodes
- 5.1.6.3. Photodetectors
- 5.1.6.4. Solar Cells
- 5.1.7. Germanium
- 5.1.7.1. Fiber Optics
- 5.1.7.2. Infrared Optics
- 5.1.7.3. Electrical and Solar Equipment
- 5.1.8. Indium
- 5.1.8.1. Flat-Panel Display Screens and Touchscreens
- 5.1.8.2. Low Melting Alloys and Solders
- 5.1.8.3. Semiconductors
- 5.1.8.4. Transparent Heat Reflectors
- 5.1.9. Manganese
- 5.1.9.1. Casting Alloys
- 5.1.9.2. Packaging
- 5.1.9.3. Transportation
- 5.1.9.4. Construction
- 5.1.10. Niobium
- 5.1.10.1. Super Alloys
- 5.1.10.2. Superconducting Magnets
- 5.1.10.3. Capacitors
- 5.1.11. Platinum Group Elements
- 5.1.11.1. Autocatalyst
- 5.1.11.2. Jewelry
- 5.1.11.3. Electrical & Electronics
- 5.1.12. Rare Earth Elements
- 5.1.12.1. Magnetic Alloys
- 5.1.12.2. Metallurgy
- 5.1.13. Tantalum
- 5.1.13.1. Medical
- 5.1.1. Antimony
- 5.2. Market Analysis, Insights and Forecast - by Region
- 5.2.1. Asia Pacific
- 5.2.2. North America
- 5.2.3. Europe
- 5.2.4. South America
- 5.2.5. Middle East and Africa
- 5.1. Market Analysis, Insights and Forecast - by Mineral
- 6. Global Strategic Mineral Materials Industry Analysis, Insights and Forecast, 2021-2033
- 6.1. Market Analysis, Insights and Forecast - by Mineral
- 6.1.1. Antimony
- 6.1.1.1. Flame Retardants
- 6.1.1.2. Batteries
- 6.1.1.3. Ceramics and Glass
- 6.1.1.4. Catalyst
- 6.1.1.5. Alloys
- 6.1.2. Barite
- 6.1.2.1. Oil and Gas
- 6.1.2.2. Other Ap
- 6.1.3. Beryllium
- 6.1.3.1. Electronics
- 6.1.3.2. Aerospace
- 6.1.3.3. Automotive
- 6.1.3.4. Energy
- 6.1.4. Cobalt
- 6.1.4.1. Superalloys
- 6.1.4.2. Cemented Carbides and Diamond Tools
- 6.1.4.3. Catalysts
- 6.1.5. Fluorspar
- 6.1.5.1. Chemicals
- 6.1.5.2. Steel
- 6.1.5.3. Aluminum
- 6.1.6. Gallium
- 6.1.6.1. Integrated Circuits
- 6.1.6.2. Laser diodes
- 6.1.6.3. Photodetectors
- 6.1.6.4. Solar Cells
- 6.1.7. Germanium
- 6.1.7.1. Fiber Optics
- 6.1.7.2. Infrared Optics
- 6.1.7.3. Electrical and Solar Equipment
- 6.1.8. Indium
- 6.1.8.1. Flat-Panel Display Screens and Touchscreens
- 6.1.8.2. Low Melting Alloys and Solders
- 6.1.8.3. Semiconductors
- 6.1.8.4. Transparent Heat Reflectors
- 6.1.9. Manganese
- 6.1.9.1. Casting Alloys
- 6.1.9.2. Packaging
- 6.1.9.3. Transportation
- 6.1.9.4. Construction
- 6.1.10. Niobium
- 6.1.10.1. Super Alloys
- 6.1.10.2. Superconducting Magnets
- 6.1.10.3. Capacitors
- 6.1.11. Platinum Group Elements
- 6.1.11.1. Autocatalyst
- 6.1.11.2. Jewelry
- 6.1.11.3. Electrical & Electronics
- 6.1.12. Rare Earth Elements
- 6.1.12.1. Magnetic Alloys
- 6.1.12.2. Metallurgy
- 6.1.13. Tantalum
- 6.1.13.1. Medical
- 6.1.1. Antimony
- 6.1. Market Analysis, Insights and Forecast - by Mineral
- 7. Asia Pacific Strategic Mineral Materials Industry Analysis, Insights and Forecast, 2021-2033
- 7.1. Market Analysis, Insights and Forecast - by Mineral
- 7.1.1. Antimony
- 7.1.1.1. Flame Retardants
- 7.1.1.2. Batteries
- 7.1.1.3. Ceramics and Glass
- 7.1.1.4. Catalyst
- 7.1.1.5. Alloys
- 7.1.2. Barite
- 7.1.2.1. Oil and Gas
- 7.1.2.2. Other Ap
- 7.1.3. Beryllium
- 7.1.3.1. Electronics
- 7.1.3.2. Aerospace
- 7.1.3.3. Automotive
- 7.1.3.4. Energy
- 7.1.4. Cobalt
- 7.1.4.1. Superalloys
- 7.1.4.2. Cemented Carbides and Diamond Tools
- 7.1.4.3. Catalysts
- 7.1.5. Fluorspar
- 7.1.5.1. Chemicals
- 7.1.5.2. Steel
- 7.1.5.3. Aluminum
- 7.1.6. Gallium
- 7.1.6.1. Integrated Circuits
- 7.1.6.2. Laser diodes
- 7.1.6.3. Photodetectors
- 7.1.6.4. Solar Cells
- 7.1.7. Germanium
- 7.1.7.1. Fiber Optics
- 7.1.7.2. Infrared Optics
- 7.1.7.3. Electrical and Solar Equipment
- 7.1.8. Indium
- 7.1.8.1. Flat-Panel Display Screens and Touchscreens
- 7.1.8.2. Low Melting Alloys and Solders
- 7.1.8.3. Semiconductors
- 7.1.8.4. Transparent Heat Reflectors
- 7.1.9. Manganese
- 7.1.9.1. Casting Alloys
- 7.1.9.2. Packaging
- 7.1.9.3. Transportation
- 7.1.9.4. Construction
- 7.1.10. Niobium
- 7.1.10.1. Super Alloys
- 7.1.10.2. Superconducting Magnets
- 7.1.10.3. Capacitors
- 7.1.11. Platinum Group Elements
- 7.1.11.1. Autocatalyst
- 7.1.11.2. Jewelry
- 7.1.11.3. Electrical & Electronics
- 7.1.12. Rare Earth Elements
- 7.1.12.1. Magnetic Alloys
- 7.1.12.2. Metallurgy
- 7.1.13. Tantalum
- 7.1.13.1. Medical
- 7.1.1. Antimony
- 7.1. Market Analysis, Insights and Forecast - by Mineral
- 8. North America Strategic Mineral Materials Industry Analysis, Insights and Forecast, 2021-2033
- 8.1. Market Analysis, Insights and Forecast - by Mineral
- 8.1.1. Antimony
- 8.1.1.1. Flame Retardants
- 8.1.1.2. Batteries
- 8.1.1.3. Ceramics and Glass
- 8.1.1.4. Catalyst
- 8.1.1.5. Alloys
- 8.1.2. Barite
- 8.1.2.1. Oil and Gas
- 8.1.2.2. Other Ap
- 8.1.3. Beryllium
- 8.1.3.1. Electronics
- 8.1.3.2. Aerospace
- 8.1.3.3. Automotive
- 8.1.3.4. Energy
- 8.1.4. Cobalt
- 8.1.4.1. Superalloys
- 8.1.4.2. Cemented Carbides and Diamond Tools
- 8.1.4.3. Catalysts
- 8.1.5. Fluorspar
- 8.1.5.1. Chemicals
- 8.1.5.2. Steel
- 8.1.5.3. Aluminum
- 8.1.6. Gallium
- 8.1.6.1. Integrated Circuits
- 8.1.6.2. Laser diodes
- 8.1.6.3. Photodetectors
- 8.1.6.4. Solar Cells
- 8.1.7. Germanium
- 8.1.7.1. Fiber Optics
- 8.1.7.2. Infrared Optics
- 8.1.7.3. Electrical and Solar Equipment
- 8.1.8. Indium
- 8.1.8.1. Flat-Panel Display Screens and Touchscreens
- 8.1.8.2. Low Melting Alloys and Solders
- 8.1.8.3. Semiconductors
- 8.1.8.4. Transparent Heat Reflectors
- 8.1.9. Manganese
- 8.1.9.1. Casting Alloys
- 8.1.9.2. Packaging
- 8.1.9.3. Transportation
- 8.1.9.4. Construction
- 8.1.10. Niobium
- 8.1.10.1. Super Alloys
- 8.1.10.2. Superconducting Magnets
- 8.1.10.3. Capacitors
- 8.1.11. Platinum Group Elements
- 8.1.11.1. Autocatalyst
- 8.1.11.2. Jewelry
- 8.1.11.3. Electrical & Electronics
- 8.1.12. Rare Earth Elements
- 8.1.12.1. Magnetic Alloys
- 8.1.12.2. Metallurgy
- 8.1.13. Tantalum
- 8.1.13.1. Medical
- 8.1.1. Antimony
- 8.1. Market Analysis, Insights and Forecast - by Mineral
- 9. Europe Strategic Mineral Materials Industry Analysis, Insights and Forecast, 2021-2033
- 9.1. Market Analysis, Insights and Forecast - by Mineral
- 9.1.1. Antimony
- 9.1.1.1. Flame Retardants
- 9.1.1.2. Batteries
- 9.1.1.3. Ceramics and Glass
- 9.1.1.4. Catalyst
- 9.1.1.5. Alloys
- 9.1.2. Barite
- 9.1.2.1. Oil and Gas
- 9.1.2.2. Other Ap
- 9.1.3. Beryllium
- 9.1.3.1. Electronics
- 9.1.3.2. Aerospace
- 9.1.3.3. Automotive
- 9.1.3.4. Energy
- 9.1.4. Cobalt
- 9.1.4.1. Superalloys
- 9.1.4.2. Cemented Carbides and Diamond Tools
- 9.1.4.3. Catalysts
- 9.1.5. Fluorspar
- 9.1.5.1. Chemicals
- 9.1.5.2. Steel
- 9.1.5.3. Aluminum
- 9.1.6. Gallium
- 9.1.6.1. Integrated Circuits
- 9.1.6.2. Laser diodes
- 9.1.6.3. Photodetectors
- 9.1.6.4. Solar Cells
- 9.1.7. Germanium
- 9.1.7.1. Fiber Optics
- 9.1.7.2. Infrared Optics
- 9.1.7.3. Electrical and Solar Equipment
- 9.1.8. Indium
- 9.1.8.1. Flat-Panel Display Screens and Touchscreens
- 9.1.8.2. Low Melting Alloys and Solders
- 9.1.8.3. Semiconductors
- 9.1.8.4. Transparent Heat Reflectors
- 9.1.9. Manganese
- 9.1.9.1. Casting Alloys
- 9.1.9.2. Packaging
- 9.1.9.3. Transportation
- 9.1.9.4. Construction
- 9.1.10. Niobium
- 9.1.10.1. Super Alloys
- 9.1.10.2. Superconducting Magnets
- 9.1.10.3. Capacitors
- 9.1.11. Platinum Group Elements
- 9.1.11.1. Autocatalyst
- 9.1.11.2. Jewelry
- 9.1.11.3. Electrical & Electronics
- 9.1.12. Rare Earth Elements
- 9.1.12.1. Magnetic Alloys
- 9.1.12.2. Metallurgy
- 9.1.13. Tantalum
- 9.1.13.1. Medical
- 9.1.1. Antimony
- 9.1. Market Analysis, Insights and Forecast - by Mineral
- 10. South America Strategic Mineral Materials Industry Analysis, Insights and Forecast, 2021-2033
- 10.1. Market Analysis, Insights and Forecast - by Mineral
- 10.1.1. Antimony
- 10.1.1.1. Flame Retardants
- 10.1.1.2. Batteries
- 10.1.1.3. Ceramics and Glass
- 10.1.1.4. Catalyst
- 10.1.1.5. Alloys
- 10.1.2. Barite
- 10.1.2.1. Oil and Gas
- 10.1.2.2. Other Ap
- 10.1.3. Beryllium
- 10.1.3.1. Electronics
- 10.1.3.2. Aerospace
- 10.1.3.3. Automotive
- 10.1.3.4. Energy
- 10.1.4. Cobalt
- 10.1.4.1. Superalloys
- 10.1.4.2. Cemented Carbides and Diamond Tools
- 10.1.4.3. Catalysts
- 10.1.5. Fluorspar
- 10.1.5.1. Chemicals
- 10.1.5.2. Steel
- 10.1.5.3. Aluminum
- 10.1.6. Gallium
- 10.1.6.1. Integrated Circuits
- 10.1.6.2. Laser diodes
- 10.1.6.3. Photodetectors
- 10.1.6.4. Solar Cells
- 10.1.7. Germanium
- 10.1.7.1. Fiber Optics
- 10.1.7.2. Infrared Optics
- 10.1.7.3. Electrical and Solar Equipment
- 10.1.8. Indium
- 10.1.8.1. Flat-Panel Display Screens and Touchscreens
- 10.1.8.2. Low Melting Alloys and Solders
- 10.1.8.3. Semiconductors
- 10.1.8.4. Transparent Heat Reflectors
- 10.1.9. Manganese
- 10.1.9.1. Casting Alloys
- 10.1.9.2. Packaging
- 10.1.9.3. Transportation
- 10.1.9.4. Construction
- 10.1.10. Niobium
- 10.1.10.1. Super Alloys
- 10.1.10.2. Superconducting Magnets
- 10.1.10.3. Capacitors
- 10.1.11. Platinum Group Elements
- 10.1.11.1. Autocatalyst
- 10.1.11.2. Jewelry
- 10.1.11.3. Electrical & Electronics
- 10.1.12. Rare Earth Elements
- 10.1.12.1. Magnetic Alloys
- 10.1.12.2. Metallurgy
- 10.1.13. Tantalum
- 10.1.13.1. Medical
- 10.1.1. Antimony
- 10.1. Market Analysis, Insights and Forecast - by Mineral
- 11. Middle East and Africa Strategic Mineral Materials Industry Analysis, Insights and Forecast, 2021-2033
- 11.1. Market Analysis, Insights and Forecast - by Mineral
- 11.1.1. Antimony
- 11.1.1.1. Flame Retardants
- 11.1.1.2. Batteries
- 11.1.1.3. Ceramics and Glass
- 11.1.1.4. Catalyst
- 11.1.1.5. Alloys
- 11.1.2. Barite
- 11.1.2.1. Oil and Gas
- 11.1.2.2. Other Ap
- 11.1.3. Beryllium
- 11.1.3.1. Electronics
- 11.1.3.2. Aerospace
- 11.1.3.3. Automotive
- 11.1.3.4. Energy
- 11.1.4. Cobalt
- 11.1.4.1. Superalloys
- 11.1.4.2. Cemented Carbides and Diamond Tools
- 11.1.4.3. Catalysts
- 11.1.5. Fluorspar
- 11.1.5.1. Chemicals
- 11.1.5.2. Steel
- 11.1.5.3. Aluminum
- 11.1.6. Gallium
- 11.1.6.1. Integrated Circuits
- 11.1.6.2. Laser diodes
- 11.1.6.3. Photodetectors
- 11.1.6.4. Solar Cells
- 11.1.7. Germanium
- 11.1.7.1. Fiber Optics
- 11.1.7.2. Infrared Optics
- 11.1.7.3. Electrical and Solar Equipment
- 11.1.8. Indium
- 11.1.8.1. Flat-Panel Display Screens and Touchscreens
- 11.1.8.2. Low Melting Alloys and Solders
- 11.1.8.3. Semiconductors
- 11.1.8.4. Transparent Heat Reflectors
- 11.1.9. Manganese
- 11.1.9.1. Casting Alloys
- 11.1.9.2. Packaging
- 11.1.9.3. Transportation
- 11.1.9.4. Construction
- 11.1.10. Niobium
- 11.1.10.1. Super Alloys
- 11.1.10.2. Superconducting Magnets
- 11.1.10.3. Capacitors
- 11.1.11. Platinum Group Elements
- 11.1.11.1. Autocatalyst
- 11.1.11.2. Jewelry
- 11.1.11.3. Electrical & Electronics
- 11.1.12. Rare Earth Elements
- 11.1.12.1. Magnetic Alloys
- 11.1.12.2. Metallurgy
- 11.1.13. Tantalum
- 11.1.13.1. Medical
- 11.1.1. Antimony
- 11.1. Market Analysis, Insights and Forecast - by Mineral
- 12. Competitive Analysis
- 12.1. Company Profiles
- 12.1.1 CBMM
- 12.1.1.1. Company Overview
- 12.1.1.2. Products
- 12.1.1.3. Company Financials
- 12.1.1.4. SWOT Analysis
- 12.1.2 South32
- 12.1.2.1. Company Overview
- 12.1.2.2. Products
- 12.1.2.3. Company Financials
- 12.1.2.4. SWOT Analysis
- 12.1.3 Intercontinental Mining
- 12.1.3.1. Company Overview
- 12.1.3.2. Products
- 12.1.3.3. Company Financials
- 12.1.3.4. SWOT Analysis
- 12.1.4 Indium Corporation
- 12.1.4.1. Company Overview
- 12.1.4.2. Products
- 12.1.4.3. Company Financials
- 12.1.4.4. SWOT Analysis
- 12.1.5 WARRIOR GOLD INC
- 12.1.5.1. Company Overview
- 12.1.5.2. Products
- 12.1.5.3. Company Financials
- 12.1.5.4. SWOT Analysis
- 12.1.6 Anglo American plc
- 12.1.6.1. Company Overview
- 12.1.6.2. Products
- 12.1.6.3. Company Financials
- 12.1.6.4. SWOT Analysis
- 12.1.7 Glencore
- 12.1.7.1. Company Overview
- 12.1.7.2. Products
- 12.1.7.3. Company Financials
- 12.1.7.4. SWOT Analysis
- 12.1.8 Vale
- 12.1.8.1. Company Overview
- 12.1.8.2. Products
- 12.1.8.3. Company Financials
- 12.1.8.4. SWOT Analysis
- 12.1.9 Materion Corporation
- 12.1.9.1. Company Overview
- 12.1.9.2. Products
- 12.1.9.3. Company Financials
- 12.1.9.4. SWOT Analysis
- 12.1.1 CBMM
- 12.2. Market Entropy
- 12.2.1 Company's Key Areas Served
- 12.2.2 Recent Developments
- 12.3. Company Market Share Analysis 2025
- 12.3.1 Top 5 Companies Market Share Analysis
- 12.3.2 Top 3 Companies Market Share Analysis
- 12.4. List of Potential Customers
- 13. Research Methodology
List of Figures
- Figure 1: Global Strategic Mineral Materials Industry Revenue Breakdown (billion, %) by Region 2025 & 2033
- Figure 2: Global Strategic Mineral Materials Industry Volume Breakdown (K Tons, %) by Region 2025 & 2033
- Figure 3: Asia Pacific Strategic Mineral Materials Industry Revenue (billion), by Mineral 2025 & 2033
- Figure 4: Asia Pacific Strategic Mineral Materials Industry Volume (K Tons), by Mineral 2025 & 2033
- Figure 5: Asia Pacific Strategic Mineral Materials Industry Revenue Share (%), by Mineral 2025 & 2033
- Figure 6: Asia Pacific Strategic Mineral Materials Industry Volume Share (%), by Mineral 2025 & 2033
- Figure 7: Asia Pacific Strategic Mineral Materials Industry Revenue (billion), by Country 2025 & 2033
- Figure 8: Asia Pacific Strategic Mineral Materials Industry Volume (K Tons), by Country 2025 & 2033
- Figure 9: Asia Pacific Strategic Mineral Materials Industry Revenue Share (%), by Country 2025 & 2033
- Figure 10: Asia Pacific Strategic Mineral Materials Industry Volume Share (%), by Country 2025 & 2033
- Figure 11: North America Strategic Mineral Materials Industry Revenue (billion), by Mineral 2025 & 2033
- Figure 12: North America Strategic Mineral Materials Industry Volume (K Tons), by Mineral 2025 & 2033
- Figure 13: North America Strategic Mineral Materials Industry Revenue Share (%), by Mineral 2025 & 2033
- Figure 14: North America Strategic Mineral Materials Industry Volume Share (%), by Mineral 2025 & 2033
- Figure 15: North America Strategic Mineral Materials Industry Revenue (billion), by Country 2025 & 2033
- Figure 16: North America Strategic Mineral Materials Industry Volume (K Tons), by Country 2025 & 2033
- Figure 17: North America Strategic Mineral Materials Industry Revenue Share (%), by Country 2025 & 2033
- Figure 18: North America Strategic Mineral Materials Industry Volume Share (%), by Country 2025 & 2033
- Figure 19: Europe Strategic Mineral Materials Industry Revenue (billion), by Mineral 2025 & 2033
- Figure 20: Europe Strategic Mineral Materials Industry Volume (K Tons), by Mineral 2025 & 2033
- Figure 21: Europe Strategic Mineral Materials Industry Revenue Share (%), by Mineral 2025 & 2033
- Figure 22: Europe Strategic Mineral Materials Industry Volume Share (%), by Mineral 2025 & 2033
- Figure 23: Europe Strategic Mineral Materials Industry Revenue (billion), by Country 2025 & 2033
- Figure 24: Europe Strategic Mineral Materials Industry Volume (K Tons), by Country 2025 & 2033
- Figure 25: Europe Strategic Mineral Materials Industry Revenue Share (%), by Country 2025 & 2033
- Figure 26: Europe Strategic Mineral Materials Industry Volume Share (%), by Country 2025 & 2033
- Figure 27: South America Strategic Mineral Materials Industry Revenue (billion), by Mineral 2025 & 2033
- Figure 28: South America Strategic Mineral Materials Industry Volume (K Tons), by Mineral 2025 & 2033
- Figure 29: South America Strategic Mineral Materials Industry Revenue Share (%), by Mineral 2025 & 2033
- Figure 30: South America Strategic Mineral Materials Industry Volume Share (%), by Mineral 2025 & 2033
- Figure 31: South America Strategic Mineral Materials Industry Revenue (billion), by Country 2025 & 2033
- Figure 32: South America Strategic Mineral Materials Industry Volume (K Tons), by Country 2025 & 2033
- Figure 33: South America Strategic Mineral Materials Industry Revenue Share (%), by Country 2025 & 2033
- Figure 34: South America Strategic Mineral Materials Industry Volume Share (%), by Country 2025 & 2033
- Figure 35: Middle East and Africa Strategic Mineral Materials Industry Revenue (billion), by Mineral 2025 & 2033
- Figure 36: Middle East and Africa Strategic Mineral Materials Industry Volume (K Tons), by Mineral 2025 & 2033
- Figure 37: Middle East and Africa Strategic Mineral Materials Industry Revenue Share (%), by Mineral 2025 & 2033
- Figure 38: Middle East and Africa Strategic Mineral Materials Industry Volume Share (%), by Mineral 2025 & 2033
- Figure 39: Middle East and Africa Strategic Mineral Materials Industry Revenue (billion), by Country 2025 & 2033
- Figure 40: Middle East and Africa Strategic Mineral Materials Industry Volume (K Tons), by Country 2025 & 2033
- Figure 41: Middle East and Africa Strategic Mineral Materials Industry Revenue Share (%), by Country 2025 & 2033
- Figure 42: Middle East and Africa Strategic Mineral Materials Industry Volume Share (%), by Country 2025 & 2033
List of Tables
- Table 1: Global Strategic Mineral Materials Industry Revenue billion Forecast, by Mineral 2020 & 2033
- Table 2: Global Strategic Mineral Materials Industry Volume K Tons Forecast, by Mineral 2020 & 2033
- Table 3: Global Strategic Mineral Materials Industry Revenue billion Forecast, by Region 2020 & 2033
- Table 4: Global Strategic Mineral Materials Industry Volume K Tons Forecast, by Region 2020 & 2033
- Table 5: Global Strategic Mineral Materials Industry Revenue billion Forecast, by Mineral 2020 & 2033
- Table 6: Global Strategic Mineral Materials Industry Volume K Tons Forecast, by Mineral 2020 & 2033
- Table 7: Global Strategic Mineral Materials Industry Revenue billion Forecast, by Country 2020 & 2033
- Table 8: Global Strategic Mineral Materials Industry Volume K Tons Forecast, by Country 2020 & 2033
- Table 9: China Strategic Mineral Materials Industry Revenue (billion) Forecast, by Application 2020 & 2033
- Table 10: China Strategic Mineral Materials Industry Volume (K Tons) Forecast, by Application 2020 & 2033
- Table 11: India Strategic Mineral Materials Industry Revenue (billion) Forecast, by Application 2020 & 2033
- Table 12: India Strategic Mineral Materials Industry Volume (K Tons) Forecast, by Application 2020 & 2033
- Table 13: Japan Strategic Mineral Materials Industry Revenue (billion) Forecast, by Application 2020 & 2033
- Table 14: Japan Strategic Mineral Materials Industry Volume (K Tons) Forecast, by Application 2020 & 2033
- Table 15: South Korea Strategic Mineral Materials Industry Revenue (billion) Forecast, by Application 2020 & 2033
- Table 16: South Korea Strategic Mineral Materials Industry Volume (K Tons) Forecast, by Application 2020 & 2033
- Table 17: ASEAN Countries Strategic Mineral Materials Industry Revenue (billion) Forecast, by Application 2020 & 2033
- Table 18: ASEAN Countries Strategic Mineral Materials Industry Volume (K Tons) Forecast, by Application 2020 & 2033
- Table 19: Rest of Asia Pacific Strategic Mineral Materials Industry Revenue (billion) Forecast, by Application 2020 & 2033
- Table 20: Rest of Asia Pacific Strategic Mineral Materials Industry Volume (K Tons) Forecast, by Application 2020 & 2033
- Table 21: Global Strategic Mineral Materials Industry Revenue billion Forecast, by Mineral 2020 & 2033
- Table 22: Global Strategic Mineral Materials Industry Volume K Tons Forecast, by Mineral 2020 & 2033
- Table 23: Global Strategic Mineral Materials Industry Revenue billion Forecast, by Country 2020 & 2033
- Table 24: Global Strategic Mineral Materials Industry Volume K Tons Forecast, by Country 2020 & 2033
- Table 25: United States Strategic Mineral Materials Industry Revenue (billion) Forecast, by Application 2020 & 2033
- Table 26: United States Strategic Mineral Materials Industry Volume (K Tons) Forecast, by Application 2020 & 2033
- Table 27: Canada Strategic Mineral Materials Industry Revenue (billion) Forecast, by Application 2020 & 2033
- Table 28: Canada Strategic Mineral Materials Industry Volume (K Tons) Forecast, by Application 2020 & 2033
- Table 29: Mexico Strategic Mineral Materials Industry Revenue (billion) Forecast, by Application 2020 & 2033
- Table 30: Mexico Strategic Mineral Materials Industry Volume (K Tons) Forecast, by Application 2020 & 2033
- Table 31: Global Strategic Mineral Materials Industry Revenue billion Forecast, by Mineral 2020 & 2033
- Table 32: Global Strategic Mineral Materials Industry Volume K Tons Forecast, by Mineral 2020 & 2033
- Table 33: Global Strategic Mineral Materials Industry Revenue billion Forecast, by Country 2020 & 2033
- Table 34: Global Strategic Mineral Materials Industry Volume K Tons Forecast, by Country 2020 & 2033
- Table 35: Germany Strategic Mineral Materials Industry Revenue (billion) Forecast, by Application 2020 & 2033
- Table 36: Germany Strategic Mineral Materials Industry Volume (K Tons) Forecast, by Application 2020 & 2033
- Table 37: United Kingdom Strategic Mineral Materials Industry Revenue (billion) Forecast, by Application 2020 & 2033
- Table 38: United Kingdom Strategic Mineral Materials Industry Volume (K Tons) Forecast, by Application 2020 & 2033
- Table 39: Italy Strategic Mineral Materials Industry Revenue (billion) Forecast, by Application 2020 & 2033
- Table 40: Italy Strategic Mineral Materials Industry Volume (K Tons) Forecast, by Application 2020 & 2033
- Table 41: France Strategic Mineral Materials Industry Revenue (billion) Forecast, by Application 2020 & 2033
- Table 42: France Strategic Mineral Materials Industry Volume (K Tons) Forecast, by Application 2020 & 2033
- Table 43: Spain Strategic Mineral Materials Industry Revenue (billion) Forecast, by Application 2020 & 2033
- Table 44: Spain Strategic Mineral Materials Industry Volume (K Tons) Forecast, by Application 2020 & 2033
- Table 45: Rest of Europe Strategic Mineral Materials Industry Revenue (billion) Forecast, by Application 2020 & 2033
- Table 46: Rest of Europe Strategic Mineral Materials Industry Volume (K Tons) Forecast, by Application 2020 & 2033
- Table 47: Global Strategic Mineral Materials Industry Revenue billion Forecast, by Mineral 2020 & 2033
- Table 48: Global Strategic Mineral Materials Industry Volume K Tons Forecast, by Mineral 2020 & 2033
- Table 49: Global Strategic Mineral Materials Industry Revenue billion Forecast, by Country 2020 & 2033
- Table 50: Global Strategic Mineral Materials Industry Volume K Tons Forecast, by Country 2020 & 2033
- Table 51: Brazil Strategic Mineral Materials Industry Revenue (billion) Forecast, by Application 2020 & 2033
- Table 52: Brazil Strategic Mineral Materials Industry Volume (K Tons) Forecast, by Application 2020 & 2033
- Table 53: Argentina Strategic Mineral Materials Industry Revenue (billion) Forecast, by Application 2020 & 2033
- Table 54: Argentina Strategic Mineral Materials Industry Volume (K Tons) Forecast, by Application 2020 & 2033
- Table 55: Rest of South America Strategic Mineral Materials Industry Revenue (billion) Forecast, by Application 2020 & 2033
- Table 56: Rest of South America Strategic Mineral Materials Industry Volume (K Tons) Forecast, by Application 2020 & 2033
- Table 57: Global Strategic Mineral Materials Industry Revenue billion Forecast, by Mineral 2020 & 2033
- Table 58: Global Strategic Mineral Materials Industry Volume K Tons Forecast, by Mineral 2020 & 2033
- Table 59: Global Strategic Mineral Materials Industry Revenue billion Forecast, by Country 2020 & 2033
- Table 60: Global Strategic Mineral Materials Industry Volume K Tons Forecast, by Country 2020 & 2033
- Table 61: Saudi Arabia Strategic Mineral Materials Industry Revenue (billion) Forecast, by Application 2020 & 2033
- Table 62: Saudi Arabia Strategic Mineral Materials Industry Volume (K Tons) Forecast, by Application 2020 & 2033
- Table 63: South Africa Strategic Mineral Materials Industry Revenue (billion) Forecast, by Application 2020 & 2033
- Table 64: South Africa Strategic Mineral Materials Industry Volume (K Tons) Forecast, by Application 2020 & 2033
- Table 65: Rest of Middle East and Africa Strategic Mineral Materials Industry Revenue (billion) Forecast, by Application 2020 & 2033
- Table 66: Rest of Middle East and Africa Strategic Mineral Materials Industry Volume (K Tons) Forecast, by Application 2020 & 2033
Frequently Asked Questions
1. What is the projected Compound Annual Growth Rate (CAGR) of the Strategic Mineral Materials Industry?
The projected CAGR is approximately 6.3%.
2. Which companies are prominent players in the Strategic Mineral Materials Industry?
Key companies in the market include CBMM, South32, Intercontinental Mining, Indium Corporation, WARRIOR GOLD INC , Anglo American plc, Glencore, Vale, Materion Corporation.
3. What are the main segments of the Strategic Mineral Materials Industry?
The market segments include Mineral.
4. Can you provide details about the market size?
The market size is estimated to be USD 8.9 billion as of 2022.
5. What are some drivers contributing to market growth?
; Growing Demand from Various End-user Industries; Other Drivers.
6. What are the notable trends driving market growth?
Steel Application to Dominate the Niobium Segment.
7. Are there any restraints impacting market growth?
; Impact of COVID-19 Pandemic; Growing Environmental Concerns over Mining Operations.
8. Can you provide examples of recent developments in the market?
N/A
9. What pricing options are available for accessing the report?
Pricing options include single-user, multi-user, and enterprise licenses priced at USD 4750, USD 5250, and USD 8750 respectively.
10. Is the market size provided in terms of value or volume?
The market size is provided in terms of value, measured in billion and volume, measured in K Tons.
11. Are there any specific market keywords associated with the report?
Yes, the market keyword associated with the report is "Strategic Mineral Materials Industry," which aids in identifying and referencing the specific market segment covered.
12. How do I determine which pricing option suits my needs best?
The pricing options vary based on user requirements and access needs. Individual users may opt for single-user licenses, while businesses requiring broader access may choose multi-user or enterprise licenses for cost-effective access to the report.
13. Are there any additional resources or data provided in the Strategic Mineral Materials Industry report?
While the report offers comprehensive insights, it's advisable to review the specific contents or supplementary materials provided to ascertain if additional resources or data are available.
14. How can I stay updated on further developments or reports in the Strategic Mineral Materials Industry?
To stay informed about further developments, trends, and reports in the Strategic Mineral Materials Industry, consider subscribing to industry newsletters, following relevant companies and organizations, or regularly checking reputable industry news sources and publications.
Methodology
Step 1 - Identification of Relevant Samples Size from Population Database


Step 2 - Approaches for Defining Global Market Size (Value, Volume* & Price*)

Note*: In applicable scenarios
Step 3 - Data Sources
Primary Research
- Web Analytics
- Survey Reports
- Research Institute
- Latest Research Reports
- Opinion Leaders
Secondary Research
- Annual Reports
- White Paper
- Latest Press Release
- Industry Association
- Paid Database
- Investor Presentations

Step 4 - Data Triangulation
Involves using different sources of information in order to increase the validity of a study
These sources are likely to be stakeholders in a program - participants, other researchers, program staff, other community members, and so on.
Then we put all data in single framework & apply various statistical tools to find out the dynamic on the market.
During the analysis stage, feedback from the stakeholder groups would be compared to determine areas of agreement as well as areas of divergence