

Key Insights
The global steel rebar market, valued at approximately $XX million in 2025, is projected to experience robust growth, driven by a Compound Annual Growth Rate (CAGR) of 5.74% from 2025 to 2033. This expansion is fueled by several key factors. The burgeoning construction industry, particularly in rapidly developing economies across Asia-Pacific and the Middle East & Africa, is a major driver. Increased infrastructure spending on projects such as highways, bridges, and commercial buildings significantly boosts demand for steel rebar. Furthermore, the growing residential sector, fueled by urbanization and population growth, contributes substantially to market expansion. The preference for high-strength deformed rebar over mild steel in many applications further shapes market dynamics, as deformed rebar offers superior tensile strength and durability. However, fluctuating steel prices, influenced by raw material costs and global economic conditions, pose a significant restraint. Additionally, environmental concerns related to steel production, including carbon emissions, are prompting the adoption of more sustainable steel manufacturing practices, impacting market dynamics and potentially influencing the choice of rebar types. The market is segmented by end-user industry (residential and non-residential) and rebar type (deformed and mild), allowing for a granular understanding of demand patterns within specific regions.
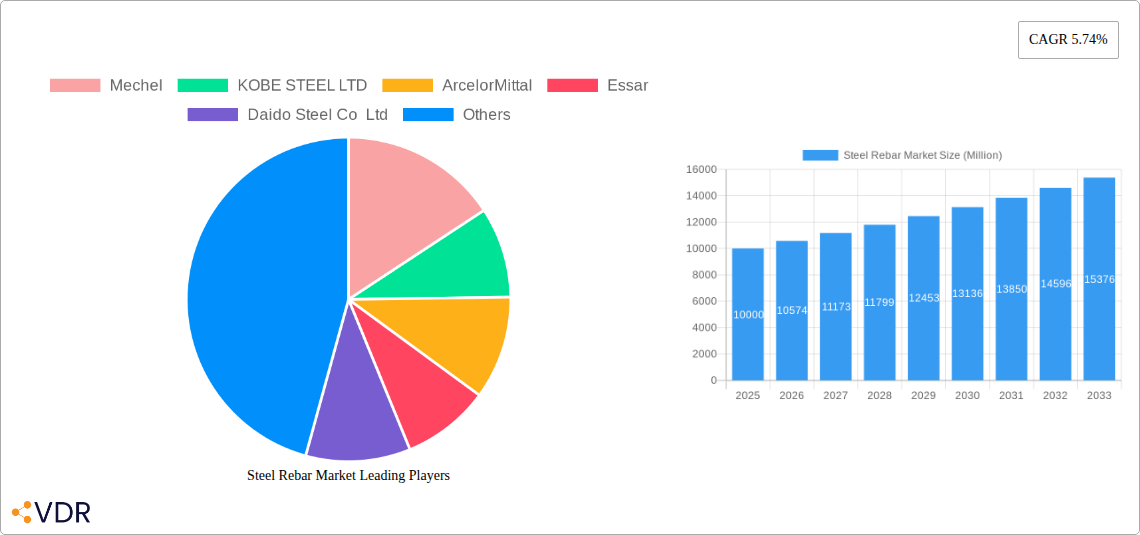
Steel Rebar Market Market Size (In Billion)
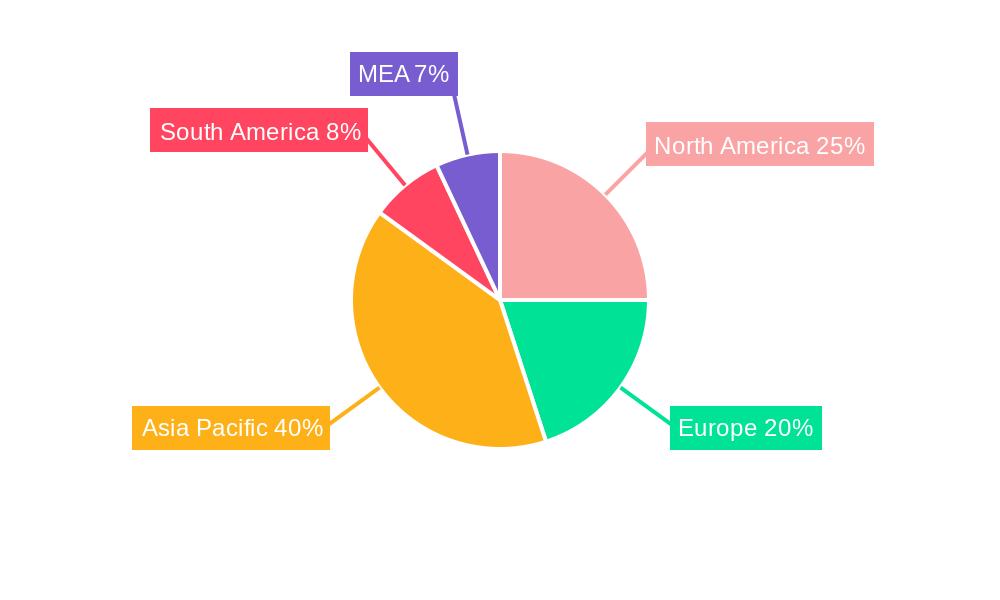
Major players like ArcelorMittal, Tata Steel, and Nucor Corporation dominate the market landscape, leveraging their extensive production capabilities and global distribution networks. Regional variations in growth are anticipated, with Asia-Pacific and North America likely to continue showing strong performance. Asia-Pacific benefits from its massive construction projects and infrastructure development, while North America’s steady growth in residential and commercial construction fuels consistent demand. However, the European market may experience slightly moderated growth due to its mature infrastructure and potentially slower economic expansion compared to other regions. The forecast period of 2025-2033 suggests a continuing positive trend, although potential economic downturns or disruptions in global supply chains could impact the overall trajectory. The increasing adoption of sustainable construction practices and the development of high-performance rebar alternatives are likely to shape market developments in the coming years.
Steel Rebar Market Company Market Share
Steel Rebar Market: A Comprehensive Market Report (2019-2033)
This in-depth report provides a comprehensive analysis of the global steel rebar market, encompassing market dynamics, growth trends, regional performance, and key player strategies. The study covers the historical period (2019-2024), base year (2025), and forecast period (2025-2033), offering invaluable insights for industry professionals, investors, and stakeholders. The report segments the market by end-user industry (Residential, Non-Residential) and type (Deformed, Mild), providing granular data for informed decision-making. Market values are presented in million units.
Steel Rebar Market Dynamics & Structure
The steel rebar market is characterized by moderate concentration, with several major players holding significant market share. Technological innovation, primarily focused on enhancing strength, durability, and corrosion resistance, is a key driver. Stringent regulatory frameworks regarding construction safety and environmental standards significantly impact market dynamics. Competitive substitutes, such as fiberglass and carbon fiber reinforced polymers, present challenges, albeit with limited market penetration currently estimated at xx%. End-user demographics, particularly growth in infrastructure projects and construction activities, are key demand drivers. The market has witnessed several mergers and acquisitions (M&As) in recent years, totaling an estimated xx million USD in deal volume during 2019-2024.
- Market Concentration: Moderately concentrated, with top 5 players holding approximately xx% market share.
- Technological Innovation: Focus on high-strength low-alloy (HSLA) steel, corrosion-resistant coatings, and smart rebar technologies.
- Regulatory Landscape: Stringent building codes and environmental regulations influencing material selection and production processes.
- Competitive Substitutes: Fiberglass and CFRP posing a niche threat, with xx% market penetration in 2024.
- M&A Activity: Significant activity observed in the period 2019-2024, with xx million USD in deal value, indicating consolidation trends.
- End-User Demographics: Growth driven by increasing urbanization and infrastructure development globally.
Steel Rebar Market Growth Trends & Insights
The global steel rebar market exhibits a steady growth trajectory, driven by robust construction activity and expanding infrastructure projects worldwide. The market size is projected to reach xx million units by 2025, exhibiting a CAGR of xx% during the forecast period (2025-2033). This growth is fueled by increasing urbanization, rising disposable incomes in developing economies, and government investments in infrastructure development. Technological advancements, such as the adoption of higher-strength rebars and corrosion-resistant coatings, are further stimulating market expansion. Consumer behavior shifts towards sustainable and high-performance construction materials are also influencing market growth.
Dominant Regions, Countries, or Segments in Steel Rebar Market
The Asia-Pacific region, particularly China and India, currently dominates the steel rebar market, driven by rapid infrastructure development and urbanization. Within the end-user segments, the Non-Residential sector holds a larger market share due to large-scale construction projects such as commercial buildings, industrial facilities, and infrastructure projects. Amongst the product types, Deformed rebar holds a significantly larger market share owing to its superior strength and load-bearing capacity.
- Key Drivers:
- Rapid urbanization and infrastructure development in the Asia-Pacific region.
- Increasing government investment in construction projects globally.
- Growing demand for higher-strength and corrosion-resistant rebars.
- Rise in Non-residential construction activities.
- Dominance Factors:
- Large-scale infrastructure projects in developing economies.
- Favorable economic policies promoting construction and infrastructure development.
- Significant market share of Deformed rebar due to its superior properties.
- Strong growth potential in emerging markets.
Steel Rebar Market Product Landscape
Steel rebar products are continually evolving to meet the demands for improved strength, durability, and corrosion resistance. Innovations include the development of high-strength low-alloy (HSLA) steels, advanced coatings like epoxy and zinc galvanization, and the introduction of fiber-reinforced polymer (FRP) rebars for specialized applications. These advancements offer unique selling propositions, such as increased lifespan, reduced maintenance, and improved structural performance.
Key Drivers, Barriers & Challenges in Steel Rebar Market
Key Drivers:
- Growing global infrastructure spending.
- Rising urbanization and population growth.
- Technological advancements in rebar production.
- Increasing demand for high-strength and corrosion-resistant rebars.
Challenges and Restraints:
- Fluctuations in raw material prices (iron ore, scrap steel).
- Stringent environmental regulations impacting production costs.
- Intense competition among existing players.
- Potential supply chain disruptions impacting production and delivery.
Emerging Opportunities in Steel Rebar Market
- Growing demand for sustainable and eco-friendly rebar solutions.
- Expansion into untapped markets in developing countries.
- Development of smart rebar technologies for enhanced structural monitoring.
- Increasing adoption of prefabricated and modular construction techniques.
Growth Accelerators in the Steel Rebar Market Industry
Technological breakthroughs, particularly in the development of higher-strength and more durable rebar materials, are pivotal to market growth. Strategic partnerships between rebar manufacturers and construction companies, facilitating the integration of innovative products, further enhance market expansion. Expansion into emerging markets, driven by increased construction activity, offers substantial growth potential.
Key Players Shaping the Steel Rebar Market Market
- Mechel
- KOBE STEEL LTD
- ArcelorMittal
- Essar
- Daido Steel Co Ltd
- Gerdau S/A
- Jiangsu Shagang Group
- SAIL
- Celsa Steel (UK) Ltd
- Contractors Materials Company (CMC)
- Tata Steel
- Sohar Steel Group
- NIPPON STEEL CORPORATION
- JFE Steel Corporation
- HYUNDAI STEEL
- Nucor Corporation
Notable Milestones in Steel Rebar Market Sector
- February 2022: Nucor Corporation's acquisition of a majority stake in California Steel Industries, Inc. (CSI), creating a joint venture, significantly altering the market landscape. This expands Nucor's flat-rolled steel production capacity by over two million tons annually.
In-Depth Steel Rebar Market Market Outlook
The future of the steel rebar market is bright, driven by sustained infrastructure development globally and technological advancements leading to the production of higher-performance, sustainable rebar solutions. Strategic investments in R&D, coupled with strategic partnerships and market expansions, will unlock significant growth opportunities for key players in the coming years. The market's trajectory suggests continued expansion, with a focus on innovation and sustainability as key growth drivers.
Steel Rebar Market Segmentation
-
1. Type
- 1.1. Deformed
- 1.2. Mild
-
2. End-user Industry
- 2.1. Residential
-
2.2. Non-Residential
- 2.2.1. Commercial
- 2.2.2. Infrastructure
- 2.2.3. Institutional
Steel Rebar Market Segmentation By Geography
-
1. Asia Pacific
- 1.1. China
- 1.2. India
- 1.3. Japan
- 1.4. South Korea
- 1.5. Rest of Asia Pacific
-
2. North America
- 2.1. United States
- 2.2. Canada
- 2.3. Mexico
-
3. Europe
- 3.1. Germany
- 3.2. United Kingdom
- 3.3. France
- 3.4. Italy
- 3.5. Rest of Europe
-
4. South America
- 4.1. Brazil
- 4.2. Argentina
- 4.3. Rest of South America
-
5. Middle East and Africa
- 5.1. Saudi Arabia
- 5.2. South Africa
- 5.3. Rest of Middle East and Africa
Steel Rebar Market Regional Market Share
Geographic Coverage of Steel Rebar Market
Steel Rebar Market REPORT HIGHLIGHTS
| Aspects | Details |
|---|---|
| Study Period | 2020-2034 |
| Base Year | 2025 |
| Estimated Year | 2026 |
| Forecast Period | 2026-2034 |
| Historical Period | 2020-2025 |
| Growth Rate | CAGR of 5.74% from 2020-2034 |
| Segmentation |
|
Table of Contents
- 1. Introduction
- 1.1. Research Scope
- 1.2. Market Segmentation
- 1.3. Research Objective
- 1.4. Definitions and Assumptions
- 2. Executive Summary
- 2.1. Market Snapshot
- 3. Market Dynamics
- 3.1. Market Drivers
- 3.2. Market Restrains
- 3.3. Market Trends
- 3.4. Market Opportunities
- 4. Market Factor Analysis
- 4.1. Porters Five Forces
- 4.1.1. Bargaining Power of Suppliers
- 4.1.2. Bargaining Power of Buyers
- 4.1.3. Threat of New Entrants
- 4.1.4. Threat of Substitutes
- 4.1.5. Competitive Rivalry
- 4.2. PESTEL analysis
- 4.3. BCG Analysis
- 4.3.1. Stars (High Growth, High Market Share)
- 4.3.2. Cash Cows (Low Growth, High Market Share)
- 4.3.3. Question Mark (High Growth, Low Market Share)
- 4.3.4. Dogs (Low Growth, Low Market Share)
- 4.4. Ansoff Matrix Analysis
- 4.5. Supply Chain Analysis
- 4.6. Regulatory Landscape
- 4.7. Current Market Potential and Opportunity Assessment (TAM–SAM–SOM Framework)
- 4.8. VDR Analyst Note
- 4.1. Porters Five Forces
- 5. Market Analysis, Insights and Forecast 2021-2033
- 5.1. Market Analysis, Insights and Forecast - by Type
- 5.1.1. Deformed
- 5.1.2. Mild
- 5.2. Market Analysis, Insights and Forecast - by End-user Industry
- 5.2.1. Residential
- 5.2.2. Non-Residential
- 5.2.2.1. Commercial
- 5.2.2.2. Infrastructure
- 5.2.2.3. Institutional
- 5.3. Market Analysis, Insights and Forecast - by Region
- 5.3.1. Asia Pacific
- 5.3.2. North America
- 5.3.3. Europe
- 5.3.4. South America
- 5.3.5. Middle East and Africa
- 5.1. Market Analysis, Insights and Forecast - by Type
- 6. Global Steel Rebar Market Analysis, Insights and Forecast, 2021-2033
- 6.1. Market Analysis, Insights and Forecast - by Type
- 6.1.1. Deformed
- 6.1.2. Mild
- 6.2. Market Analysis, Insights and Forecast - by End-user Industry
- 6.2.1. Residential
- 6.2.2. Non-Residential
- 6.2.2.1. Commercial
- 6.2.2.2. Infrastructure
- 6.2.2.3. Institutional
- 6.1. Market Analysis, Insights and Forecast - by Type
- 7. Asia Pacific Steel Rebar Market Analysis, Insights and Forecast, 2021-2033
- 7.1. Market Analysis, Insights and Forecast - by Type
- 7.1.1. Deformed
- 7.1.2. Mild
- 7.2. Market Analysis, Insights and Forecast - by End-user Industry
- 7.2.1. Residential
- 7.2.2. Non-Residential
- 7.2.2.1. Commercial
- 7.2.2.2. Infrastructure
- 7.2.2.3. Institutional
- 7.1. Market Analysis, Insights and Forecast - by Type
- 8. North America Steel Rebar Market Analysis, Insights and Forecast, 2021-2033
- 8.1. Market Analysis, Insights and Forecast - by Type
- 8.1.1. Deformed
- 8.1.2. Mild
- 8.2. Market Analysis, Insights and Forecast - by End-user Industry
- 8.2.1. Residential
- 8.2.2. Non-Residential
- 8.2.2.1. Commercial
- 8.2.2.2. Infrastructure
- 8.2.2.3. Institutional
- 8.1. Market Analysis, Insights and Forecast - by Type
- 9. Europe Steel Rebar Market Analysis, Insights and Forecast, 2021-2033
- 9.1. Market Analysis, Insights and Forecast - by Type
- 9.1.1. Deformed
- 9.1.2. Mild
- 9.2. Market Analysis, Insights and Forecast - by End-user Industry
- 9.2.1. Residential
- 9.2.2. Non-Residential
- 9.2.2.1. Commercial
- 9.2.2.2. Infrastructure
- 9.2.2.3. Institutional
- 9.1. Market Analysis, Insights and Forecast - by Type
- 10. South America Steel Rebar Market Analysis, Insights and Forecast, 2021-2033
- 10.1. Market Analysis, Insights and Forecast - by Type
- 10.1.1. Deformed
- 10.1.2. Mild
- 10.2. Market Analysis, Insights and Forecast - by End-user Industry
- 10.2.1. Residential
- 10.2.2. Non-Residential
- 10.2.2.1. Commercial
- 10.2.2.2. Infrastructure
- 10.2.2.3. Institutional
- 10.1. Market Analysis, Insights and Forecast - by Type
- 11. Middle East and Africa Steel Rebar Market Analysis, Insights and Forecast, 2021-2033
- 11.1. Market Analysis, Insights and Forecast - by Type
- 11.1.1. Deformed
- 11.1.2. Mild
- 11.2. Market Analysis, Insights and Forecast - by End-user Industry
- 11.2.1. Residential
- 11.2.2. Non-Residential
- 11.2.2.1. Commercial
- 11.2.2.2. Infrastructure
- 11.2.2.3. Institutional
- 11.1. Market Analysis, Insights and Forecast - by Type
- 12. Competitive Analysis
- 12.1. Company Profiles
- 12.1.1 Mechel
- 12.1.1.1. Company Overview
- 12.1.1.2. Products
- 12.1.1.3. Company Financials
- 12.1.1.4. SWOT Analysis
- 12.1.2 KOBE STEEL LTD
- 12.1.2.1. Company Overview
- 12.1.2.2. Products
- 12.1.2.3. Company Financials
- 12.1.2.4. SWOT Analysis
- 12.1.3 ArcelorMittal
- 12.1.3.1. Company Overview
- 12.1.3.2. Products
- 12.1.3.3. Company Financials
- 12.1.3.4. SWOT Analysis
- 12.1.4 Essar
- 12.1.4.1. Company Overview
- 12.1.4.2. Products
- 12.1.4.3. Company Financials
- 12.1.4.4. SWOT Analysis
- 12.1.5 Daido Steel Co Ltd
- 12.1.5.1. Company Overview
- 12.1.5.2. Products
- 12.1.5.3. Company Financials
- 12.1.5.4. SWOT Analysis
- 12.1.6 Gerdau S/A
- 12.1.6.1. Company Overview
- 12.1.6.2. Products
- 12.1.6.3. Company Financials
- 12.1.6.4. SWOT Analysis
- 12.1.7 Jiangsu Shagang Group
- 12.1.7.1. Company Overview
- 12.1.7.2. Products
- 12.1.7.3. Company Financials
- 12.1.7.4. SWOT Analysis
- 12.1.8 SAIL
- 12.1.8.1. Company Overview
- 12.1.8.2. Products
- 12.1.8.3. Company Financials
- 12.1.8.4. SWOT Analysis
- 12.1.9 Celsa Steel (UK) Ltd
- 12.1.9.1. Company Overview
- 12.1.9.2. Products
- 12.1.9.3. Company Financials
- 12.1.9.4. SWOT Analysis
- 12.1.10 Contractors Materials Company (CMC)
- 12.1.10.1. Company Overview
- 12.1.10.2. Products
- 12.1.10.3. Company Financials
- 12.1.10.4. SWOT Analysis
- 12.1.11 Tata Steel
- 12.1.11.1. Company Overview
- 12.1.11.2. Products
- 12.1.11.3. Company Financials
- 12.1.11.4. SWOT Analysis
- 12.1.12 Sohar Steel Group
- 12.1.12.1. Company Overview
- 12.1.12.2. Products
- 12.1.12.3. Company Financials
- 12.1.12.4. SWOT Analysis
- 12.1.13 NIPPON STEEL CORPORATION
- 12.1.13.1. Company Overview
- 12.1.13.2. Products
- 12.1.13.3. Company Financials
- 12.1.13.4. SWOT Analysis
- 12.1.14 JFE Steel Corporation
- 12.1.14.1. Company Overview
- 12.1.14.2. Products
- 12.1.14.3. Company Financials
- 12.1.14.4. SWOT Analysis
- 12.1.15 HYUNDAI STEEL
- 12.1.15.1. Company Overview
- 12.1.15.2. Products
- 12.1.15.3. Company Financials
- 12.1.15.4. SWOT Analysis
- 12.1.16 Nucor Corporation
- 12.1.16.1. Company Overview
- 12.1.16.2. Products
- 12.1.16.3. Company Financials
- 12.1.16.4. SWOT Analysis
- 12.1.1 Mechel
- 12.2. Market Entropy
- 12.2.1 Company's Key Areas Served
- 12.2.2 Recent Developments
- 12.3. Company Market Share Analysis 2025
- 12.3.1 Top 5 Companies Market Share Analysis
- 12.3.2 Top 3 Companies Market Share Analysis
- 12.4. List of Potential Customers
- 13. Research Methodology
List of Figures
- Figure 1: Global Steel Rebar Market Revenue Breakdown (Million, %) by Region 2025 & 2033
- Figure 2: Global Steel Rebar Market Volume Breakdown (K Tons, %) by Region 2025 & 2033
- Figure 3: Asia Pacific Steel Rebar Market Revenue (Million), by Type 2025 & 2033
- Figure 4: Asia Pacific Steel Rebar Market Volume (K Tons), by Type 2025 & 2033
- Figure 5: Asia Pacific Steel Rebar Market Revenue Share (%), by Type 2025 & 2033
- Figure 6: Asia Pacific Steel Rebar Market Volume Share (%), by Type 2025 & 2033
- Figure 7: Asia Pacific Steel Rebar Market Revenue (Million), by End-user Industry 2025 & 2033
- Figure 8: Asia Pacific Steel Rebar Market Volume (K Tons), by End-user Industry 2025 & 2033
- Figure 9: Asia Pacific Steel Rebar Market Revenue Share (%), by End-user Industry 2025 & 2033
- Figure 10: Asia Pacific Steel Rebar Market Volume Share (%), by End-user Industry 2025 & 2033
- Figure 11: Asia Pacific Steel Rebar Market Revenue (Million), by Country 2025 & 2033
- Figure 12: Asia Pacific Steel Rebar Market Volume (K Tons), by Country 2025 & 2033
- Figure 13: Asia Pacific Steel Rebar Market Revenue Share (%), by Country 2025 & 2033
- Figure 14: Asia Pacific Steel Rebar Market Volume Share (%), by Country 2025 & 2033
- Figure 15: North America Steel Rebar Market Revenue (Million), by Type 2025 & 2033
- Figure 16: North America Steel Rebar Market Volume (K Tons), by Type 2025 & 2033
- Figure 17: North America Steel Rebar Market Revenue Share (%), by Type 2025 & 2033
- Figure 18: North America Steel Rebar Market Volume Share (%), by Type 2025 & 2033
- Figure 19: North America Steel Rebar Market Revenue (Million), by End-user Industry 2025 & 2033
- Figure 20: North America Steel Rebar Market Volume (K Tons), by End-user Industry 2025 & 2033
- Figure 21: North America Steel Rebar Market Revenue Share (%), by End-user Industry 2025 & 2033
- Figure 22: North America Steel Rebar Market Volume Share (%), by End-user Industry 2025 & 2033
- Figure 23: North America Steel Rebar Market Revenue (Million), by Country 2025 & 2033
- Figure 24: North America Steel Rebar Market Volume (K Tons), by Country 2025 & 2033
- Figure 25: North America Steel Rebar Market Revenue Share (%), by Country 2025 & 2033
- Figure 26: North America Steel Rebar Market Volume Share (%), by Country 2025 & 2033
- Figure 27: Europe Steel Rebar Market Revenue (Million), by Type 2025 & 2033
- Figure 28: Europe Steel Rebar Market Volume (K Tons), by Type 2025 & 2033
- Figure 29: Europe Steel Rebar Market Revenue Share (%), by Type 2025 & 2033
- Figure 30: Europe Steel Rebar Market Volume Share (%), by Type 2025 & 2033
- Figure 31: Europe Steel Rebar Market Revenue (Million), by End-user Industry 2025 & 2033
- Figure 32: Europe Steel Rebar Market Volume (K Tons), by End-user Industry 2025 & 2033
- Figure 33: Europe Steel Rebar Market Revenue Share (%), by End-user Industry 2025 & 2033
- Figure 34: Europe Steel Rebar Market Volume Share (%), by End-user Industry 2025 & 2033
- Figure 35: Europe Steel Rebar Market Revenue (Million), by Country 2025 & 2033
- Figure 36: Europe Steel Rebar Market Volume (K Tons), by Country 2025 & 2033
- Figure 37: Europe Steel Rebar Market Revenue Share (%), by Country 2025 & 2033
- Figure 38: Europe Steel Rebar Market Volume Share (%), by Country 2025 & 2033
- Figure 39: South America Steel Rebar Market Revenue (Million), by Type 2025 & 2033
- Figure 40: South America Steel Rebar Market Volume (K Tons), by Type 2025 & 2033
- Figure 41: South America Steel Rebar Market Revenue Share (%), by Type 2025 & 2033
- Figure 42: South America Steel Rebar Market Volume Share (%), by Type 2025 & 2033
- Figure 43: South America Steel Rebar Market Revenue (Million), by End-user Industry 2025 & 2033
- Figure 44: South America Steel Rebar Market Volume (K Tons), by End-user Industry 2025 & 2033
- Figure 45: South America Steel Rebar Market Revenue Share (%), by End-user Industry 2025 & 2033
- Figure 46: South America Steel Rebar Market Volume Share (%), by End-user Industry 2025 & 2033
- Figure 47: South America Steel Rebar Market Revenue (Million), by Country 2025 & 2033
- Figure 48: South America Steel Rebar Market Volume (K Tons), by Country 2025 & 2033
- Figure 49: South America Steel Rebar Market Revenue Share (%), by Country 2025 & 2033
- Figure 50: South America Steel Rebar Market Volume Share (%), by Country 2025 & 2033
- Figure 51: Middle East and Africa Steel Rebar Market Revenue (Million), by Type 2025 & 2033
- Figure 52: Middle East and Africa Steel Rebar Market Volume (K Tons), by Type 2025 & 2033
- Figure 53: Middle East and Africa Steel Rebar Market Revenue Share (%), by Type 2025 & 2033
- Figure 54: Middle East and Africa Steel Rebar Market Volume Share (%), by Type 2025 & 2033
- Figure 55: Middle East and Africa Steel Rebar Market Revenue (Million), by End-user Industry 2025 & 2033
- Figure 56: Middle East and Africa Steel Rebar Market Volume (K Tons), by End-user Industry 2025 & 2033
- Figure 57: Middle East and Africa Steel Rebar Market Revenue Share (%), by End-user Industry 2025 & 2033
- Figure 58: Middle East and Africa Steel Rebar Market Volume Share (%), by End-user Industry 2025 & 2033
- Figure 59: Middle East and Africa Steel Rebar Market Revenue (Million), by Country 2025 & 2033
- Figure 60: Middle East and Africa Steel Rebar Market Volume (K Tons), by Country 2025 & 2033
- Figure 61: Middle East and Africa Steel Rebar Market Revenue Share (%), by Country 2025 & 2033
- Figure 62: Middle East and Africa Steel Rebar Market Volume Share (%), by Country 2025 & 2033
List of Tables
- Table 1: Global Steel Rebar Market Revenue Million Forecast, by Type 2020 & 2033
- Table 2: Global Steel Rebar Market Volume K Tons Forecast, by Type 2020 & 2033
- Table 3: Global Steel Rebar Market Revenue Million Forecast, by End-user Industry 2020 & 2033
- Table 4: Global Steel Rebar Market Volume K Tons Forecast, by End-user Industry 2020 & 2033
- Table 5: Global Steel Rebar Market Revenue Million Forecast, by Region 2020 & 2033
- Table 6: Global Steel Rebar Market Volume K Tons Forecast, by Region 2020 & 2033
- Table 7: Global Steel Rebar Market Revenue Million Forecast, by Type 2020 & 2033
- Table 8: Global Steel Rebar Market Volume K Tons Forecast, by Type 2020 & 2033
- Table 9: Global Steel Rebar Market Revenue Million Forecast, by End-user Industry 2020 & 2033
- Table 10: Global Steel Rebar Market Volume K Tons Forecast, by End-user Industry 2020 & 2033
- Table 11: Global Steel Rebar Market Revenue Million Forecast, by Country 2020 & 2033
- Table 12: Global Steel Rebar Market Volume K Tons Forecast, by Country 2020 & 2033
- Table 13: China Steel Rebar Market Revenue (Million) Forecast, by Application 2020 & 2033
- Table 14: China Steel Rebar Market Volume (K Tons) Forecast, by Application 2020 & 2033
- Table 15: India Steel Rebar Market Revenue (Million) Forecast, by Application 2020 & 2033
- Table 16: India Steel Rebar Market Volume (K Tons) Forecast, by Application 2020 & 2033
- Table 17: Japan Steel Rebar Market Revenue (Million) Forecast, by Application 2020 & 2033
- Table 18: Japan Steel Rebar Market Volume (K Tons) Forecast, by Application 2020 & 2033
- Table 19: South Korea Steel Rebar Market Revenue (Million) Forecast, by Application 2020 & 2033
- Table 20: South Korea Steel Rebar Market Volume (K Tons) Forecast, by Application 2020 & 2033
- Table 21: Rest of Asia Pacific Steel Rebar Market Revenue (Million) Forecast, by Application 2020 & 2033
- Table 22: Rest of Asia Pacific Steel Rebar Market Volume (K Tons) Forecast, by Application 2020 & 2033
- Table 23: Global Steel Rebar Market Revenue Million Forecast, by Type 2020 & 2033
- Table 24: Global Steel Rebar Market Volume K Tons Forecast, by Type 2020 & 2033
- Table 25: Global Steel Rebar Market Revenue Million Forecast, by End-user Industry 2020 & 2033
- Table 26: Global Steel Rebar Market Volume K Tons Forecast, by End-user Industry 2020 & 2033
- Table 27: Global Steel Rebar Market Revenue Million Forecast, by Country 2020 & 2033
- Table 28: Global Steel Rebar Market Volume K Tons Forecast, by Country 2020 & 2033
- Table 29: United States Steel Rebar Market Revenue (Million) Forecast, by Application 2020 & 2033
- Table 30: United States Steel Rebar Market Volume (K Tons) Forecast, by Application 2020 & 2033
- Table 31: Canada Steel Rebar Market Revenue (Million) Forecast, by Application 2020 & 2033
- Table 32: Canada Steel Rebar Market Volume (K Tons) Forecast, by Application 2020 & 2033
- Table 33: Mexico Steel Rebar Market Revenue (Million) Forecast, by Application 2020 & 2033
- Table 34: Mexico Steel Rebar Market Volume (K Tons) Forecast, by Application 2020 & 2033
- Table 35: Global Steel Rebar Market Revenue Million Forecast, by Type 2020 & 2033
- Table 36: Global Steel Rebar Market Volume K Tons Forecast, by Type 2020 & 2033
- Table 37: Global Steel Rebar Market Revenue Million Forecast, by End-user Industry 2020 & 2033
- Table 38: Global Steel Rebar Market Volume K Tons Forecast, by End-user Industry 2020 & 2033
- Table 39: Global Steel Rebar Market Revenue Million Forecast, by Country 2020 & 2033
- Table 40: Global Steel Rebar Market Volume K Tons Forecast, by Country 2020 & 2033
- Table 41: Germany Steel Rebar Market Revenue (Million) Forecast, by Application 2020 & 2033
- Table 42: Germany Steel Rebar Market Volume (K Tons) Forecast, by Application 2020 & 2033
- Table 43: United Kingdom Steel Rebar Market Revenue (Million) Forecast, by Application 2020 & 2033
- Table 44: United Kingdom Steel Rebar Market Volume (K Tons) Forecast, by Application 2020 & 2033
- Table 45: France Steel Rebar Market Revenue (Million) Forecast, by Application 2020 & 2033
- Table 46: France Steel Rebar Market Volume (K Tons) Forecast, by Application 2020 & 2033
- Table 47: Italy Steel Rebar Market Revenue (Million) Forecast, by Application 2020 & 2033
- Table 48: Italy Steel Rebar Market Volume (K Tons) Forecast, by Application 2020 & 2033
- Table 49: Rest of Europe Steel Rebar Market Revenue (Million) Forecast, by Application 2020 & 2033
- Table 50: Rest of Europe Steel Rebar Market Volume (K Tons) Forecast, by Application 2020 & 2033
- Table 51: Global Steel Rebar Market Revenue Million Forecast, by Type 2020 & 2033
- Table 52: Global Steel Rebar Market Volume K Tons Forecast, by Type 2020 & 2033
- Table 53: Global Steel Rebar Market Revenue Million Forecast, by End-user Industry 2020 & 2033
- Table 54: Global Steel Rebar Market Volume K Tons Forecast, by End-user Industry 2020 & 2033
- Table 55: Global Steel Rebar Market Revenue Million Forecast, by Country 2020 & 2033
- Table 56: Global Steel Rebar Market Volume K Tons Forecast, by Country 2020 & 2033
- Table 57: Brazil Steel Rebar Market Revenue (Million) Forecast, by Application 2020 & 2033
- Table 58: Brazil Steel Rebar Market Volume (K Tons) Forecast, by Application 2020 & 2033
- Table 59: Argentina Steel Rebar Market Revenue (Million) Forecast, by Application 2020 & 2033
- Table 60: Argentina Steel Rebar Market Volume (K Tons) Forecast, by Application 2020 & 2033
- Table 61: Rest of South America Steel Rebar Market Revenue (Million) Forecast, by Application 2020 & 2033
- Table 62: Rest of South America Steel Rebar Market Volume (K Tons) Forecast, by Application 2020 & 2033
- Table 63: Global Steel Rebar Market Revenue Million Forecast, by Type 2020 & 2033
- Table 64: Global Steel Rebar Market Volume K Tons Forecast, by Type 2020 & 2033
- Table 65: Global Steel Rebar Market Revenue Million Forecast, by End-user Industry 2020 & 2033
- Table 66: Global Steel Rebar Market Volume K Tons Forecast, by End-user Industry 2020 & 2033
- Table 67: Global Steel Rebar Market Revenue Million Forecast, by Country 2020 & 2033
- Table 68: Global Steel Rebar Market Volume K Tons Forecast, by Country 2020 & 2033
- Table 69: Saudi Arabia Steel Rebar Market Revenue (Million) Forecast, by Application 2020 & 2033
- Table 70: Saudi Arabia Steel Rebar Market Volume (K Tons) Forecast, by Application 2020 & 2033
- Table 71: South Africa Steel Rebar Market Revenue (Million) Forecast, by Application 2020 & 2033
- Table 72: South Africa Steel Rebar Market Volume (K Tons) Forecast, by Application 2020 & 2033
- Table 73: Rest of Middle East and Africa Steel Rebar Market Revenue (Million) Forecast, by Application 2020 & 2033
- Table 74: Rest of Middle East and Africa Steel Rebar Market Volume (K Tons) Forecast, by Application 2020 & 2033
Frequently Asked Questions
1. What is the projected Compound Annual Growth Rate (CAGR) of the Steel Rebar Market?
The projected CAGR is approximately 5.74%.
2. Which companies are prominent players in the Steel Rebar Market?
Key companies in the market include Mechel, KOBE STEEL LTD, ArcelorMittal, Essar, Daido Steel Co Ltd, Gerdau S/A, Jiangsu Shagang Group, SAIL, Celsa Steel (UK) Ltd, Contractors Materials Company (CMC), Tata Steel, Sohar Steel Group, NIPPON STEEL CORPORATION, JFE Steel Corporation, HYUNDAI STEEL, Nucor Corporation.
3. What are the main segments of the Steel Rebar Market?
The market segments include Type, End-user Industry.
4. Can you provide details about the market size?
The market size is estimated to be USD XX Million as of 2022.
5. What are some drivers contributing to market growth?
Rapidly Growing Construction Industry in Asia-Pacific Region; Increasing Commercial Construction; Other Drivers.
6. What are the notable trends driving market growth?
Growing Demand from the Non-Residential Sector.
7. Are there any restraints impacting market growth?
Availability of Substitutes for Steel Rebar; Other Restraints.
8. Can you provide examples of recent developments in the market?
February 2022: Nucor Corporation announced that it completed its acquisition of a majority ownership position in California Steel Industries, Inc. (CSI), resulting in CSI becoming a joint venture company owned 51% by Nucor and 49% by JFE Steel. CSI is a flat-rolled steel converter that can produce more than two million tons of finished steel and steel products annually.
9. What pricing options are available for accessing the report?
Pricing options include single-user, multi-user, and enterprise licenses priced at USD 4750, USD 5250, and USD 8750 respectively.
10. Is the market size provided in terms of value or volume?
The market size is provided in terms of value, measured in Million and volume, measured in K Tons.
11. Are there any specific market keywords associated with the report?
Yes, the market keyword associated with the report is "Steel Rebar Market," which aids in identifying and referencing the specific market segment covered.
12. How do I determine which pricing option suits my needs best?
The pricing options vary based on user requirements and access needs. Individual users may opt for single-user licenses, while businesses requiring broader access may choose multi-user or enterprise licenses for cost-effective access to the report.
13. Are there any additional resources or data provided in the Steel Rebar Market report?
While the report offers comprehensive insights, it's advisable to review the specific contents or supplementary materials provided to ascertain if additional resources or data are available.
14. How can I stay updated on further developments or reports in the Steel Rebar Market?
To stay informed about further developments, trends, and reports in the Steel Rebar Market, consider subscribing to industry newsletters, following relevant companies and organizations, or regularly checking reputable industry news sources and publications.
Methodology
Step 1 - Identification of Relevant Samples Size from Population Database


Step 2 - Approaches for Defining Global Market Size (Value, Volume* & Price*)

Note*: In applicable scenarios
Step 3 - Data Sources
Primary Research
- Web Analytics
- Survey Reports
- Research Institute
- Latest Research Reports
- Opinion Leaders
Secondary Research
- Annual Reports
- White Paper
- Latest Press Release
- Industry Association
- Paid Database
- Investor Presentations

Step 4 - Data Triangulation
Involves using different sources of information in order to increase the validity of a study
These sources are likely to be stakeholders in a program - participants, other researchers, program staff, other community members, and so on.
Then we put all data in single framework & apply various statistical tools to find out the dynamic on the market.
During the analysis stage, feedback from the stakeholder groups would be compared to determine areas of agreement as well as areas of divergence