

Key Insights
The global stabilometry platform market is experiencing robust growth, driven by increasing prevalence of neurological disorders, rising geriatric population, and the growing adoption of advanced diagnostic tools in healthcare settings. The market's expansion is fueled by technological advancements leading to more sophisticated and user-friendly platforms, offering improved accuracy and detailed analysis of postural stability. This allows healthcare professionals to better assess balance impairments, enabling earlier diagnosis and personalized treatment plans for conditions like Parkinson's disease, multiple sclerosis, and vestibular disorders. Furthermore, the increasing integration of stabilometry platforms with other diagnostic tools and telehealth platforms enhances their efficiency and accessibility, driving market penetration. While the initial investment cost for these systems can be a restraint, the long-term benefits in improved patient outcomes and reduced healthcare costs are incentivizing their adoption across various healthcare settings, including hospitals, clinics, and rehabilitation centers. The market is segmented by platform type (force plates, motion capture systems), application (neurological disorders, geriatric care, sports medicine), and geography. Key players are actively engaged in product innovation and strategic partnerships to strengthen their market presence. We project a consistent growth trajectory for the foreseeable future, driven by continued technological enhancements and increasing healthcare expenditure globally.
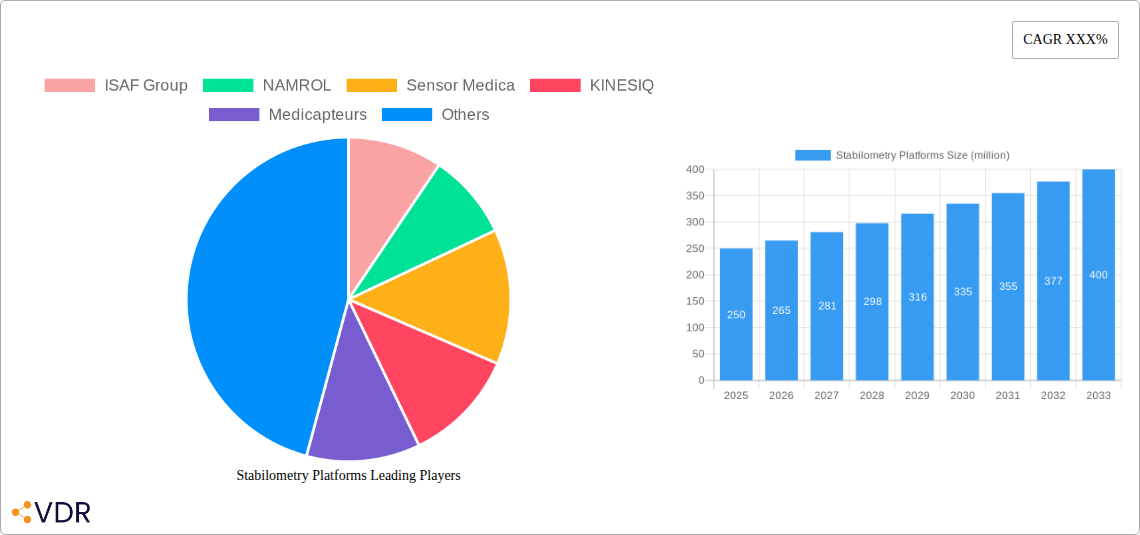
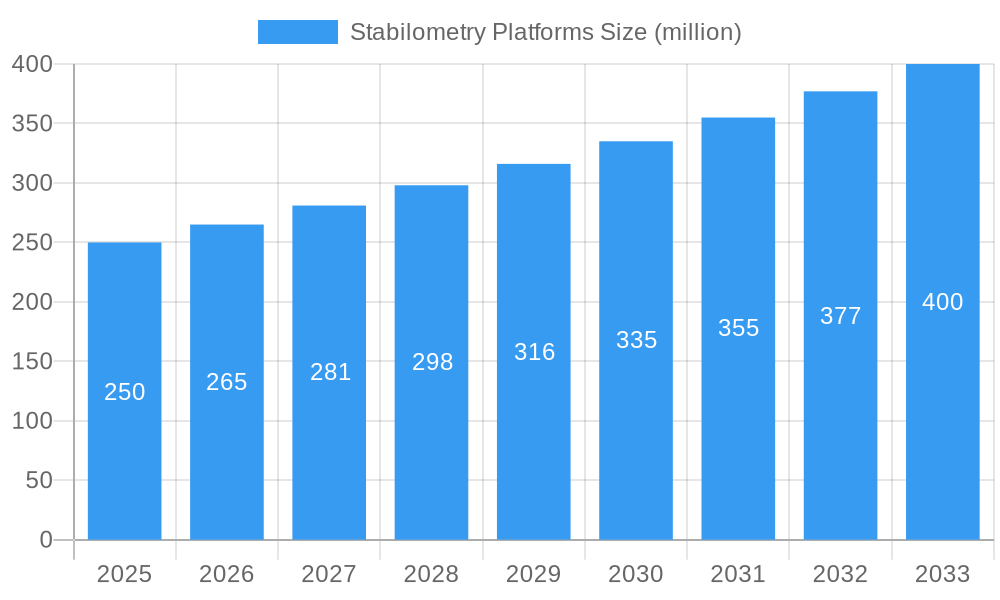
Stabilometry Platforms Market Size (In Million)
The competitive landscape is characterized by a mix of established players and emerging companies. Established companies like Biodex Medical Systems and Bauerfeind benefit from strong brand recognition and a well-established distribution network. However, newer players, leveraging innovative technologies and cost-effective solutions, are gaining market share. The market is seeing a rise in cloud-based data analysis platforms and integration with wearable sensors, enhancing the data accessibility and remote monitoring capabilities of stabilometry platforms. Regulatory approvals and stringent quality standards are crucial factors influencing market dynamics. Geographical variations in healthcare infrastructure and reimbursement policies influence regional market growth, with North America and Europe currently dominating the market, followed by Asia-Pacific experiencing a faster growth rate due to rising disposable incomes and improved healthcare infrastructure.
Stabilometry Platforms Company Market Share
Stabilometry Platforms Market Report: 2019-2033
This comprehensive report provides an in-depth analysis of the global Stabilometry Platforms market, encompassing market dynamics, growth trends, regional segmentation, product landscape, key players, and future outlook. The study period covers 2019-2033, with a base year of 2025 and a forecast period of 2025-2033. The report is invaluable for industry professionals, investors, and researchers seeking to understand and capitalize on the evolving opportunities within this dynamic sector. The market is segmented by type, application, end-user, and geography, providing a granular view of market dynamics across various parent and child markets. The total market size was valued at xx million units in 2024 and is projected to reach xx million units by 2033.
Stabilometry Platforms Market Dynamics & Structure
The global Stabilometry Platforms market is characterized by moderate concentration, with key players holding significant market share. Technological innovation, driven by advancements in sensor technology and data analytics, is a key driver of market growth. Stringent regulatory frameworks concerning medical device approvals impact market entry and expansion. Competitive substitutes, such as traditional balance assessments, pose a challenge, while the increasing prevalence of neurological and musculoskeletal disorders fuels demand. The market has witnessed a moderate level of M&A activity in recent years, with xx deals recorded between 2019 and 2024.
- Market Concentration: Moderately concentrated, with top 5 players holding approximately xx% market share in 2024.
- Technological Innovation: Advancements in sensor technology (e.g., force plates, accelerometers), AI-powered data analysis, and wireless connectivity are key drivers.
- Regulatory Framework: Stringent regulatory approvals (e.g., FDA, CE marking) influence market entry and product development.
- Competitive Substitutes: Traditional balance assessments and other clinical methods pose competition.
- End-User Demographics: Aging population and increasing prevalence of neurological and musculoskeletal disorders are key growth drivers.
- M&A Trends: xx M&A deals recorded between 2019 and 2024, indicating moderate consolidation.
Stabilometry Platforms Growth Trends & Insights
The global Stabilometry Platforms market experienced a CAGR of xx% during the historical period (2019-2024), driven by factors such as rising healthcare expenditure, technological advancements, and increasing awareness of postural stability assessment. Market penetration remains relatively low, especially in emerging economies, presenting significant growth opportunities. Technological disruptions, such as the integration of AI and machine learning for improved data analysis, are accelerating market adoption. Consumer behavior is shifting towards more technologically advanced and user-friendly platforms. The market is expected to exhibit a CAGR of xx% during the forecast period (2025-2033), reaching a projected market size of xx million units by 2033.
Dominant Regions, Countries, or Segments in Stabilometry Platforms
North America currently holds the largest market share, driven by high healthcare expenditure, advanced healthcare infrastructure, and early adoption of innovative technologies. Europe follows as a significant market, propelled by a growing elderly population and increasing prevalence of neurological disorders. The Asia-Pacific region is anticipated to experience the fastest growth during the forecast period, fueled by rising disposable incomes, improving healthcare infrastructure, and increasing awareness of preventive healthcare.
- North America: High healthcare expenditure, advanced infrastructure, and early adoption of new technologies are key drivers.
- Europe: Large aging population and high prevalence of neurological disorders contribute to significant market size.
- Asia-Pacific: Rapid economic growth, improving healthcare infrastructure, and rising awareness of preventive healthcare are fueling growth.
Stabilometry Platforms Product Landscape
Stabilometry platforms are evolving from basic force plates to sophisticated systems integrating advanced sensor technology, data analytics, and user-friendly interfaces. Innovations include wireless connectivity, real-time data visualization, and AI-powered diagnostic capabilities. These advancements enhance the accuracy, efficiency, and clinical utility of these platforms. Unique selling propositions (USPs) include improved diagnostic accuracy, ease of use, and comprehensive data reporting capabilities.
Key Drivers, Barriers & Challenges in Stabilometry Platforms
Key Drivers: The increasing prevalence of neurological and musculoskeletal disorders, rising healthcare expenditure, technological advancements in sensor technology and data analytics, and growing demand for objective balance assessment are driving market growth.
Key Challenges: High initial investment costs, stringent regulatory requirements for medical devices, and the presence of competitive substitute methods pose significant challenges. Supply chain disruptions and a shortage of skilled professionals capable of interpreting data from these platforms also represent barriers to market growth. Competitive pressures from established players and new entrants may further intensify.
Emerging Opportunities in Stabilometry Platforms
Untapped markets in developing economies present significant opportunities for market expansion. The integration of virtual reality (VR) and augmented reality (AR) technologies offers new avenues for enhanced user experience and therapeutic applications. The development of personalized rehabilitation programs based on Stabilometry data represents a growing area of application.
Growth Accelerators in the Stabilometry Platforms Industry
Technological breakthroughs, such as the development of miniaturized sensors and improved data analysis algorithms, are accelerating market growth. Strategic partnerships between manufacturers, healthcare providers, and research institutions are driving innovation and market adoption. Market expansion strategies, including geographic expansion into emerging economies and diversification into new applications, further contribute to market growth.
Key Players Shaping the Stabilometry Platforms Market
- ISAF Group
- NAMROL
- Sensor Medica
- KINESIQ
- Medicapteurs
- Biodex Medical Systems
- Synapsys
- Sensing Future Technologies
- BfMC
- HUR
- Bauerfeind
- Fysiomed CS
- Woodway
Notable Milestones in Stabilometry Platforms Sector
- 2020: Launch of a new AI-powered Stabilometry platform by [Company Name].
- 2022: Acquisition of [Company A] by [Company B], expanding market reach.
- 2023: FDA approval of a novel Stabilometry platform with enhanced diagnostic capabilities. (More milestones can be added here based on available data)
In-Depth Stabilometry Platforms Market Outlook
The Stabilometry Platforms market is poised for robust growth over the forecast period. Technological advancements, strategic partnerships, and expansion into new applications will continue to drive market expansion. The increasing focus on preventive healthcare and personalized medicine will further fuel market demand, creating significant opportunities for both established players and new entrants. The market is expected to reach xx million units by 2033, exhibiting a strong CAGR.
Stabilometry Platforms Segmentation
-
1. Application
- 1.1. Hospital
- 1.2. Clinic
- 1.3. Rehabilitation Centers
- 1.4. Nursing Homes
- 1.5. Other
-
2. Type
- 2.1. Portable
- 2.2. Fixed
Stabilometry Platforms Segmentation By Geography
-
1. North America
- 1.1. United States
- 1.2. Canada
- 1.3. Mexico
-
2. South America
- 2.1. Brazil
- 2.2. Argentina
- 2.3. Rest of South America
-
3. Europe
- 3.1. United Kingdom
- 3.2. Germany
- 3.3. France
- 3.4. Italy
- 3.5. Spain
- 3.6. Russia
- 3.7. Benelux
- 3.8. Nordics
- 3.9. Rest of Europe
-
4. Middle East & Africa
- 4.1. Turkey
- 4.2. Israel
- 4.3. GCC
- 4.4. North Africa
- 4.5. South Africa
- 4.6. Rest of Middle East & Africa
-
5. Asia Pacific
- 5.1. China
- 5.2. India
- 5.3. Japan
- 5.4. South Korea
- 5.5. ASEAN
- 5.6. Oceania
- 5.7. Rest of Asia Pacific
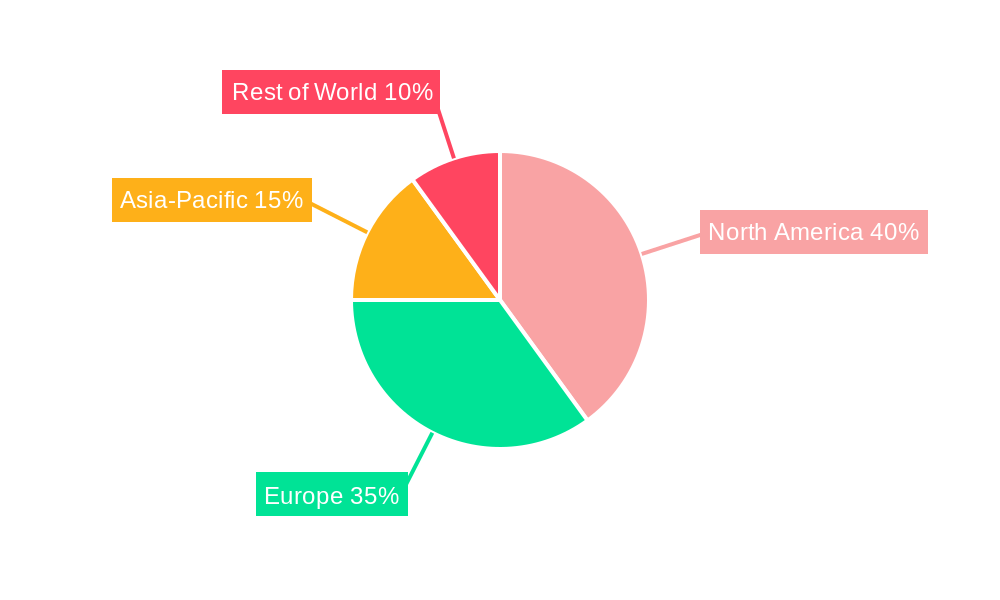
Stabilometry Platforms Regional Market Share
Geographic Coverage of Stabilometry Platforms
Stabilometry Platforms REPORT HIGHLIGHTS
| Aspects | Details |
|---|---|
| Study Period | 2020-2034 |
| Base Year | 2025 |
| Estimated Year | 2026 |
| Forecast Period | 2026-2034 |
| Historical Period | 2020-2025 |
| Growth Rate | CAGR of 12.92% from 2020-2034 |
| Segmentation |
|
Table of Contents
- 1. Introduction
- 1.1. Research Scope
- 1.2. Market Segmentation
- 1.3. Research Objective
- 1.4. Definitions and Assumptions
- 2. Executive Summary
- 2.1. Market Snapshot
- 3. Market Dynamics
- 3.1. Market Drivers
- 3.2. Market Restrains
- 3.3. Market Trends
- 3.4. Market Opportunities
- 4. Market Factor Analysis
- 4.1. Porters Five Forces
- 4.1.1. Bargaining Power of Suppliers
- 4.1.2. Bargaining Power of Buyers
- 4.1.3. Threat of New Entrants
- 4.1.4. Threat of Substitutes
- 4.1.5. Competitive Rivalry
- 4.2. PESTEL analysis
- 4.3. BCG Analysis
- 4.3.1. Stars (High Growth, High Market Share)
- 4.3.2. Cash Cows (Low Growth, High Market Share)
- 4.3.3. Question Mark (High Growth, Low Market Share)
- 4.3.4. Dogs (Low Growth, Low Market Share)
- 4.4. Ansoff Matrix Analysis
- 4.5. Supply Chain Analysis
- 4.6. Regulatory Landscape
- 4.7. Current Market Potential and Opportunity Assessment (TAM–SAM–SOM Framework)
- 4.8. VDR Analyst Note
- 4.1. Porters Five Forces
- 5. Market Analysis, Insights and Forecast 2021-2033
- 5.1. Market Analysis, Insights and Forecast - by Application
- 5.1.1. Hospital
- 5.1.2. Clinic
- 5.1.3. Rehabilitation Centers
- 5.1.4. Nursing Homes
- 5.1.5. Other
- 5.2. Market Analysis, Insights and Forecast - by Type
- 5.2.1. Portable
- 5.2.2. Fixed
- 5.3. Market Analysis, Insights and Forecast - by Region
- 5.3.1. North America
- 5.3.2. South America
- 5.3.3. Europe
- 5.3.4. Middle East & Africa
- 5.3.5. Asia Pacific
- 5.1. Market Analysis, Insights and Forecast - by Application
- 6. Global Stabilometry Platforms Analysis, Insights and Forecast, 2021-2033
- 6.1. Market Analysis, Insights and Forecast - by Application
- 6.1.1. Hospital
- 6.1.2. Clinic
- 6.1.3. Rehabilitation Centers
- 6.1.4. Nursing Homes
- 6.1.5. Other
- 6.2. Market Analysis, Insights and Forecast - by Type
- 6.2.1. Portable
- 6.2.2. Fixed
- 6.1. Market Analysis, Insights and Forecast - by Application
- 7. North America Stabilometry Platforms Analysis, Insights and Forecast, 2021-2033
- 7.1. Market Analysis, Insights and Forecast - by Application
- 7.1.1. Hospital
- 7.1.2. Clinic
- 7.1.3. Rehabilitation Centers
- 7.1.4. Nursing Homes
- 7.1.5. Other
- 7.2. Market Analysis, Insights and Forecast - by Type
- 7.2.1. Portable
- 7.2.2. Fixed
- 7.1. Market Analysis, Insights and Forecast - by Application
- 8. South America Stabilometry Platforms Analysis, Insights and Forecast, 2021-2033
- 8.1. Market Analysis, Insights and Forecast - by Application
- 8.1.1. Hospital
- 8.1.2. Clinic
- 8.1.3. Rehabilitation Centers
- 8.1.4. Nursing Homes
- 8.1.5. Other
- 8.2. Market Analysis, Insights and Forecast - by Type
- 8.2.1. Portable
- 8.2.2. Fixed
- 8.1. Market Analysis, Insights and Forecast - by Application
- 9. Europe Stabilometry Platforms Analysis, Insights and Forecast, 2021-2033
- 9.1. Market Analysis, Insights and Forecast - by Application
- 9.1.1. Hospital
- 9.1.2. Clinic
- 9.1.3. Rehabilitation Centers
- 9.1.4. Nursing Homes
- 9.1.5. Other
- 9.2. Market Analysis, Insights and Forecast - by Type
- 9.2.1. Portable
- 9.2.2. Fixed
- 9.1. Market Analysis, Insights and Forecast - by Application
- 10. Middle East & Africa Stabilometry Platforms Analysis, Insights and Forecast, 2021-2033
- 10.1. Market Analysis, Insights and Forecast - by Application
- 10.1.1. Hospital
- 10.1.2. Clinic
- 10.1.3. Rehabilitation Centers
- 10.1.4. Nursing Homes
- 10.1.5. Other
- 10.2. Market Analysis, Insights and Forecast - by Type
- 10.2.1. Portable
- 10.2.2. Fixed
- 10.1. Market Analysis, Insights and Forecast - by Application
- 11. Asia Pacific Stabilometry Platforms Analysis, Insights and Forecast, 2021-2033
- 11.1. Market Analysis, Insights and Forecast - by Application
- 11.1.1. Hospital
- 11.1.2. Clinic
- 11.1.3. Rehabilitation Centers
- 11.1.4. Nursing Homes
- 11.1.5. Other
- 11.2. Market Analysis, Insights and Forecast - by Type
- 11.2.1. Portable
- 11.2.2. Fixed
- 11.1. Market Analysis, Insights and Forecast - by Application
- 12. Competitive Analysis
- 12.1. Company Profiles
- 12.1.1 ISAF Group
- 12.1.1.1. Company Overview
- 12.1.1.2. Products
- 12.1.1.3. Company Financials
- 12.1.1.4. SWOT Analysis
- 12.1.2 NAMROL
- 12.1.2.1. Company Overview
- 12.1.2.2. Products
- 12.1.2.3. Company Financials
- 12.1.2.4. SWOT Analysis
- 12.1.3 Sensor Medica
- 12.1.3.1. Company Overview
- 12.1.3.2. Products
- 12.1.3.3. Company Financials
- 12.1.3.4. SWOT Analysis
- 12.1.4 KINESIQ
- 12.1.4.1. Company Overview
- 12.1.4.2. Products
- 12.1.4.3. Company Financials
- 12.1.4.4. SWOT Analysis
- 12.1.5 Medicapteurs
- 12.1.5.1. Company Overview
- 12.1.5.2. Products
- 12.1.5.3. Company Financials
- 12.1.5.4. SWOT Analysis
- 12.1.6 Biodex Medical Systems
- 12.1.6.1. Company Overview
- 12.1.6.2. Products
- 12.1.6.3. Company Financials
- 12.1.6.4. SWOT Analysis
- 12.1.7 Synapsys
- 12.1.7.1. Company Overview
- 12.1.7.2. Products
- 12.1.7.3. Company Financials
- 12.1.7.4. SWOT Analysis
- 12.1.8 Sensing Future Technologies
- 12.1.8.1. Company Overview
- 12.1.8.2. Products
- 12.1.8.3. Company Financials
- 12.1.8.4. SWOT Analysis
- 12.1.9 BfMC
- 12.1.9.1. Company Overview
- 12.1.9.2. Products
- 12.1.9.3. Company Financials
- 12.1.9.4. SWOT Analysis
- 12.1.10 HUR
- 12.1.10.1. Company Overview
- 12.1.10.2. Products
- 12.1.10.3. Company Financials
- 12.1.10.4. SWOT Analysis
- 12.1.11 Bauerfeind
- 12.1.11.1. Company Overview
- 12.1.11.2. Products
- 12.1.11.3. Company Financials
- 12.1.11.4. SWOT Analysis
- 12.1.12 Fysiomed CS
- 12.1.12.1. Company Overview
- 12.1.12.2. Products
- 12.1.12.3. Company Financials
- 12.1.12.4. SWOT Analysis
- 12.1.13 Woodway
- 12.1.13.1. Company Overview
- 12.1.13.2. Products
- 12.1.13.3. Company Financials
- 12.1.13.4. SWOT Analysis
- 12.1.1 ISAF Group
- 12.2. Market Entropy
- 12.2.1 Company's Key Areas Served
- 12.2.2 Recent Developments
- 12.3. Company Market Share Analysis 2025
- 12.3.1 Top 5 Companies Market Share Analysis
- 12.3.2 Top 3 Companies Market Share Analysis
- 12.4. List of Potential Customers
- 13. Research Methodology
List of Figures
- Figure 1: Global Stabilometry Platforms Revenue Breakdown (undefined, %) by Region 2025 & 2033
- Figure 2: Global Stabilometry Platforms Volume Breakdown (K, %) by Region 2025 & 2033
- Figure 3: North America Stabilometry Platforms Revenue (undefined), by Application 2025 & 2033
- Figure 4: North America Stabilometry Platforms Volume (K), by Application 2025 & 2033
- Figure 5: North America Stabilometry Platforms Revenue Share (%), by Application 2025 & 2033
- Figure 6: North America Stabilometry Platforms Volume Share (%), by Application 2025 & 2033
- Figure 7: North America Stabilometry Platforms Revenue (undefined), by Type 2025 & 2033
- Figure 8: North America Stabilometry Platforms Volume (K), by Type 2025 & 2033
- Figure 9: North America Stabilometry Platforms Revenue Share (%), by Type 2025 & 2033
- Figure 10: North America Stabilometry Platforms Volume Share (%), by Type 2025 & 2033
- Figure 11: North America Stabilometry Platforms Revenue (undefined), by Country 2025 & 2033
- Figure 12: North America Stabilometry Platforms Volume (K), by Country 2025 & 2033
- Figure 13: North America Stabilometry Platforms Revenue Share (%), by Country 2025 & 2033
- Figure 14: North America Stabilometry Platforms Volume Share (%), by Country 2025 & 2033
- Figure 15: South America Stabilometry Platforms Revenue (undefined), by Application 2025 & 2033
- Figure 16: South America Stabilometry Platforms Volume (K), by Application 2025 & 2033
- Figure 17: South America Stabilometry Platforms Revenue Share (%), by Application 2025 & 2033
- Figure 18: South America Stabilometry Platforms Volume Share (%), by Application 2025 & 2033
- Figure 19: South America Stabilometry Platforms Revenue (undefined), by Type 2025 & 2033
- Figure 20: South America Stabilometry Platforms Volume (K), by Type 2025 & 2033
- Figure 21: South America Stabilometry Platforms Revenue Share (%), by Type 2025 & 2033
- Figure 22: South America Stabilometry Platforms Volume Share (%), by Type 2025 & 2033
- Figure 23: South America Stabilometry Platforms Revenue (undefined), by Country 2025 & 2033
- Figure 24: South America Stabilometry Platforms Volume (K), by Country 2025 & 2033
- Figure 25: South America Stabilometry Platforms Revenue Share (%), by Country 2025 & 2033
- Figure 26: South America Stabilometry Platforms Volume Share (%), by Country 2025 & 2033
- Figure 27: Europe Stabilometry Platforms Revenue (undefined), by Application 2025 & 2033
- Figure 28: Europe Stabilometry Platforms Volume (K), by Application 2025 & 2033
- Figure 29: Europe Stabilometry Platforms Revenue Share (%), by Application 2025 & 2033
- Figure 30: Europe Stabilometry Platforms Volume Share (%), by Application 2025 & 2033
- Figure 31: Europe Stabilometry Platforms Revenue (undefined), by Type 2025 & 2033
- Figure 32: Europe Stabilometry Platforms Volume (K), by Type 2025 & 2033
- Figure 33: Europe Stabilometry Platforms Revenue Share (%), by Type 2025 & 2033
- Figure 34: Europe Stabilometry Platforms Volume Share (%), by Type 2025 & 2033
- Figure 35: Europe Stabilometry Platforms Revenue (undefined), by Country 2025 & 2033
- Figure 36: Europe Stabilometry Platforms Volume (K), by Country 2025 & 2033
- Figure 37: Europe Stabilometry Platforms Revenue Share (%), by Country 2025 & 2033
- Figure 38: Europe Stabilometry Platforms Volume Share (%), by Country 2025 & 2033
- Figure 39: Middle East & Africa Stabilometry Platforms Revenue (undefined), by Application 2025 & 2033
- Figure 40: Middle East & Africa Stabilometry Platforms Volume (K), by Application 2025 & 2033
- Figure 41: Middle East & Africa Stabilometry Platforms Revenue Share (%), by Application 2025 & 2033
- Figure 42: Middle East & Africa Stabilometry Platforms Volume Share (%), by Application 2025 & 2033
- Figure 43: Middle East & Africa Stabilometry Platforms Revenue (undefined), by Type 2025 & 2033
- Figure 44: Middle East & Africa Stabilometry Platforms Volume (K), by Type 2025 & 2033
- Figure 45: Middle East & Africa Stabilometry Platforms Revenue Share (%), by Type 2025 & 2033
- Figure 46: Middle East & Africa Stabilometry Platforms Volume Share (%), by Type 2025 & 2033
- Figure 47: Middle East & Africa Stabilometry Platforms Revenue (undefined), by Country 2025 & 2033
- Figure 48: Middle East & Africa Stabilometry Platforms Volume (K), by Country 2025 & 2033
- Figure 49: Middle East & Africa Stabilometry Platforms Revenue Share (%), by Country 2025 & 2033
- Figure 50: Middle East & Africa Stabilometry Platforms Volume Share (%), by Country 2025 & 2033
- Figure 51: Asia Pacific Stabilometry Platforms Revenue (undefined), by Application 2025 & 2033
- Figure 52: Asia Pacific Stabilometry Platforms Volume (K), by Application 2025 & 2033
- Figure 53: Asia Pacific Stabilometry Platforms Revenue Share (%), by Application 2025 & 2033
- Figure 54: Asia Pacific Stabilometry Platforms Volume Share (%), by Application 2025 & 2033
- Figure 55: Asia Pacific Stabilometry Platforms Revenue (undefined), by Type 2025 & 2033
- Figure 56: Asia Pacific Stabilometry Platforms Volume (K), by Type 2025 & 2033
- Figure 57: Asia Pacific Stabilometry Platforms Revenue Share (%), by Type 2025 & 2033
- Figure 58: Asia Pacific Stabilometry Platforms Volume Share (%), by Type 2025 & 2033
- Figure 59: Asia Pacific Stabilometry Platforms Revenue (undefined), by Country 2025 & 2033
- Figure 60: Asia Pacific Stabilometry Platforms Volume (K), by Country 2025 & 2033
- Figure 61: Asia Pacific Stabilometry Platforms Revenue Share (%), by Country 2025 & 2033
- Figure 62: Asia Pacific Stabilometry Platforms Volume Share (%), by Country 2025 & 2033
List of Tables
- Table 1: Global Stabilometry Platforms Revenue undefined Forecast, by Application 2020 & 2033
- Table 2: Global Stabilometry Platforms Volume K Forecast, by Application 2020 & 2033
- Table 3: Global Stabilometry Platforms Revenue undefined Forecast, by Type 2020 & 2033
- Table 4: Global Stabilometry Platforms Volume K Forecast, by Type 2020 & 2033
- Table 5: Global Stabilometry Platforms Revenue undefined Forecast, by Region 2020 & 2033
- Table 6: Global Stabilometry Platforms Volume K Forecast, by Region 2020 & 2033
- Table 7: Global Stabilometry Platforms Revenue undefined Forecast, by Application 2020 & 2033
- Table 8: Global Stabilometry Platforms Volume K Forecast, by Application 2020 & 2033
- Table 9: Global Stabilometry Platforms Revenue undefined Forecast, by Type 2020 & 2033
- Table 10: Global Stabilometry Platforms Volume K Forecast, by Type 2020 & 2033
- Table 11: Global Stabilometry Platforms Revenue undefined Forecast, by Country 2020 & 2033
- Table 12: Global Stabilometry Platforms Volume K Forecast, by Country 2020 & 2033
- Table 13: United States Stabilometry Platforms Revenue (undefined) Forecast, by Application 2020 & 2033
- Table 14: United States Stabilometry Platforms Volume (K) Forecast, by Application 2020 & 2033
- Table 15: Canada Stabilometry Platforms Revenue (undefined) Forecast, by Application 2020 & 2033
- Table 16: Canada Stabilometry Platforms Volume (K) Forecast, by Application 2020 & 2033
- Table 17: Mexico Stabilometry Platforms Revenue (undefined) Forecast, by Application 2020 & 2033
- Table 18: Mexico Stabilometry Platforms Volume (K) Forecast, by Application 2020 & 2033
- Table 19: Global Stabilometry Platforms Revenue undefined Forecast, by Application 2020 & 2033
- Table 20: Global Stabilometry Platforms Volume K Forecast, by Application 2020 & 2033
- Table 21: Global Stabilometry Platforms Revenue undefined Forecast, by Type 2020 & 2033
- Table 22: Global Stabilometry Platforms Volume K Forecast, by Type 2020 & 2033
- Table 23: Global Stabilometry Platforms Revenue undefined Forecast, by Country 2020 & 2033
- Table 24: Global Stabilometry Platforms Volume K Forecast, by Country 2020 & 2033
- Table 25: Brazil Stabilometry Platforms Revenue (undefined) Forecast, by Application 2020 & 2033
- Table 26: Brazil Stabilometry Platforms Volume (K) Forecast, by Application 2020 & 2033
- Table 27: Argentina Stabilometry Platforms Revenue (undefined) Forecast, by Application 2020 & 2033
- Table 28: Argentina Stabilometry Platforms Volume (K) Forecast, by Application 2020 & 2033
- Table 29: Rest of South America Stabilometry Platforms Revenue (undefined) Forecast, by Application 2020 & 2033
- Table 30: Rest of South America Stabilometry Platforms Volume (K) Forecast, by Application 2020 & 2033
- Table 31: Global Stabilometry Platforms Revenue undefined Forecast, by Application 2020 & 2033
- Table 32: Global Stabilometry Platforms Volume K Forecast, by Application 2020 & 2033
- Table 33: Global Stabilometry Platforms Revenue undefined Forecast, by Type 2020 & 2033
- Table 34: Global Stabilometry Platforms Volume K Forecast, by Type 2020 & 2033
- Table 35: Global Stabilometry Platforms Revenue undefined Forecast, by Country 2020 & 2033
- Table 36: Global Stabilometry Platforms Volume K Forecast, by Country 2020 & 2033
- Table 37: United Kingdom Stabilometry Platforms Revenue (undefined) Forecast, by Application 2020 & 2033
- Table 38: United Kingdom Stabilometry Platforms Volume (K) Forecast, by Application 2020 & 2033
- Table 39: Germany Stabilometry Platforms Revenue (undefined) Forecast, by Application 2020 & 2033
- Table 40: Germany Stabilometry Platforms Volume (K) Forecast, by Application 2020 & 2033
- Table 41: France Stabilometry Platforms Revenue (undefined) Forecast, by Application 2020 & 2033
- Table 42: France Stabilometry Platforms Volume (K) Forecast, by Application 2020 & 2033
- Table 43: Italy Stabilometry Platforms Revenue (undefined) Forecast, by Application 2020 & 2033
- Table 44: Italy Stabilometry Platforms Volume (K) Forecast, by Application 2020 & 2033
- Table 45: Spain Stabilometry Platforms Revenue (undefined) Forecast, by Application 2020 & 2033
- Table 46: Spain Stabilometry Platforms Volume (K) Forecast, by Application 2020 & 2033
- Table 47: Russia Stabilometry Platforms Revenue (undefined) Forecast, by Application 2020 & 2033
- Table 48: Russia Stabilometry Platforms Volume (K) Forecast, by Application 2020 & 2033
- Table 49: Benelux Stabilometry Platforms Revenue (undefined) Forecast, by Application 2020 & 2033
- Table 50: Benelux Stabilometry Platforms Volume (K) Forecast, by Application 2020 & 2033
- Table 51: Nordics Stabilometry Platforms Revenue (undefined) Forecast, by Application 2020 & 2033
- Table 52: Nordics Stabilometry Platforms Volume (K) Forecast, by Application 2020 & 2033
- Table 53: Rest of Europe Stabilometry Platforms Revenue (undefined) Forecast, by Application 2020 & 2033
- Table 54: Rest of Europe Stabilometry Platforms Volume (K) Forecast, by Application 2020 & 2033
- Table 55: Global Stabilometry Platforms Revenue undefined Forecast, by Application 2020 & 2033
- Table 56: Global Stabilometry Platforms Volume K Forecast, by Application 2020 & 2033
- Table 57: Global Stabilometry Platforms Revenue undefined Forecast, by Type 2020 & 2033
- Table 58: Global Stabilometry Platforms Volume K Forecast, by Type 2020 & 2033
- Table 59: Global Stabilometry Platforms Revenue undefined Forecast, by Country 2020 & 2033
- Table 60: Global Stabilometry Platforms Volume K Forecast, by Country 2020 & 2033
- Table 61: Turkey Stabilometry Platforms Revenue (undefined) Forecast, by Application 2020 & 2033
- Table 62: Turkey Stabilometry Platforms Volume (K) Forecast, by Application 2020 & 2033
- Table 63: Israel Stabilometry Platforms Revenue (undefined) Forecast, by Application 2020 & 2033
- Table 64: Israel Stabilometry Platforms Volume (K) Forecast, by Application 2020 & 2033
- Table 65: GCC Stabilometry Platforms Revenue (undefined) Forecast, by Application 2020 & 2033
- Table 66: GCC Stabilometry Platforms Volume (K) Forecast, by Application 2020 & 2033
- Table 67: North Africa Stabilometry Platforms Revenue (undefined) Forecast, by Application 2020 & 2033
- Table 68: North Africa Stabilometry Platforms Volume (K) Forecast, by Application 2020 & 2033
- Table 69: South Africa Stabilometry Platforms Revenue (undefined) Forecast, by Application 2020 & 2033
- Table 70: South Africa Stabilometry Platforms Volume (K) Forecast, by Application 2020 & 2033
- Table 71: Rest of Middle East & Africa Stabilometry Platforms Revenue (undefined) Forecast, by Application 2020 & 2033
- Table 72: Rest of Middle East & Africa Stabilometry Platforms Volume (K) Forecast, by Application 2020 & 2033
- Table 73: Global Stabilometry Platforms Revenue undefined Forecast, by Application 2020 & 2033
- Table 74: Global Stabilometry Platforms Volume K Forecast, by Application 2020 & 2033
- Table 75: Global Stabilometry Platforms Revenue undefined Forecast, by Type 2020 & 2033
- Table 76: Global Stabilometry Platforms Volume K Forecast, by Type 2020 & 2033
- Table 77: Global Stabilometry Platforms Revenue undefined Forecast, by Country 2020 & 2033
- Table 78: Global Stabilometry Platforms Volume K Forecast, by Country 2020 & 2033
- Table 79: China Stabilometry Platforms Revenue (undefined) Forecast, by Application 2020 & 2033
- Table 80: China Stabilometry Platforms Volume (K) Forecast, by Application 2020 & 2033
- Table 81: India Stabilometry Platforms Revenue (undefined) Forecast, by Application 2020 & 2033
- Table 82: India Stabilometry Platforms Volume (K) Forecast, by Application 2020 & 2033
- Table 83: Japan Stabilometry Platforms Revenue (undefined) Forecast, by Application 2020 & 2033
- Table 84: Japan Stabilometry Platforms Volume (K) Forecast, by Application 2020 & 2033
- Table 85: South Korea Stabilometry Platforms Revenue (undefined) Forecast, by Application 2020 & 2033
- Table 86: South Korea Stabilometry Platforms Volume (K) Forecast, by Application 2020 & 2033
- Table 87: ASEAN Stabilometry Platforms Revenue (undefined) Forecast, by Application 2020 & 2033
- Table 88: ASEAN Stabilometry Platforms Volume (K) Forecast, by Application 2020 & 2033
- Table 89: Oceania Stabilometry Platforms Revenue (undefined) Forecast, by Application 2020 & 2033
- Table 90: Oceania Stabilometry Platforms Volume (K) Forecast, by Application 2020 & 2033
- Table 91: Rest of Asia Pacific Stabilometry Platforms Revenue (undefined) Forecast, by Application 2020 & 2033
- Table 92: Rest of Asia Pacific Stabilometry Platforms Volume (K) Forecast, by Application 2020 & 2033
Frequently Asked Questions
1. What is the projected Compound Annual Growth Rate (CAGR) of the Stabilometry Platforms?
The projected CAGR is approximately 12.92%.
2. Which companies are prominent players in the Stabilometry Platforms?
Key companies in the market include ISAF Group, NAMROL, Sensor Medica, KINESIQ, Medicapteurs, Biodex Medical Systems, Synapsys, Sensing Future Technologies, BfMC, HUR, Bauerfeind, Fysiomed CS, Woodway.
3. What are the main segments of the Stabilometry Platforms?
The market segments include Application, Type.
4. Can you provide details about the market size?
The market size is estimated to be USD XXX N/A as of 2022.
5. What are some drivers contributing to market growth?
N/A
6. What are the notable trends driving market growth?
N/A
7. Are there any restraints impacting market growth?
N/A
8. Can you provide examples of recent developments in the market?
N/A
9. What pricing options are available for accessing the report?
Pricing options include single-user, multi-user, and enterprise licenses priced at USD 3950.00, USD 5925.00, and USD 7900.00 respectively.
10. Is the market size provided in terms of value or volume?
The market size is provided in terms of value, measured in N/A and volume, measured in K.
11. Are there any specific market keywords associated with the report?
Yes, the market keyword associated with the report is "Stabilometry Platforms," which aids in identifying and referencing the specific market segment covered.
12. How do I determine which pricing option suits my needs best?
The pricing options vary based on user requirements and access needs. Individual users may opt for single-user licenses, while businesses requiring broader access may choose multi-user or enterprise licenses for cost-effective access to the report.
13. Are there any additional resources or data provided in the Stabilometry Platforms report?
While the report offers comprehensive insights, it's advisable to review the specific contents or supplementary materials provided to ascertain if additional resources or data are available.
14. How can I stay updated on further developments or reports in the Stabilometry Platforms?
To stay informed about further developments, trends, and reports in the Stabilometry Platforms, consider subscribing to industry newsletters, following relevant companies and organizations, or regularly checking reputable industry news sources and publications.
Methodology
Step 1 - Identification of Relevant Samples Size from Population Database


Step 2 - Approaches for Defining Global Market Size (Value, Volume* & Price*)

Note*: In applicable scenarios
Step 3 - Data Sources
Primary Research
- Web Analytics
- Survey Reports
- Research Institute
- Latest Research Reports
- Opinion Leaders
Secondary Research
- Annual Reports
- White Paper
- Latest Press Release
- Industry Association
- Paid Database
- Investor Presentations

Step 4 - Data Triangulation
Involves using different sources of information in order to increase the validity of a study
These sources are likely to be stakeholders in a program - participants, other researchers, program staff, other community members, and so on.
Then we put all data in single framework & apply various statistical tools to find out the dynamic on the market.
During the analysis stage, feedback from the stakeholder groups would be compared to determine areas of agreement as well as areas of divergence