

Key Insights
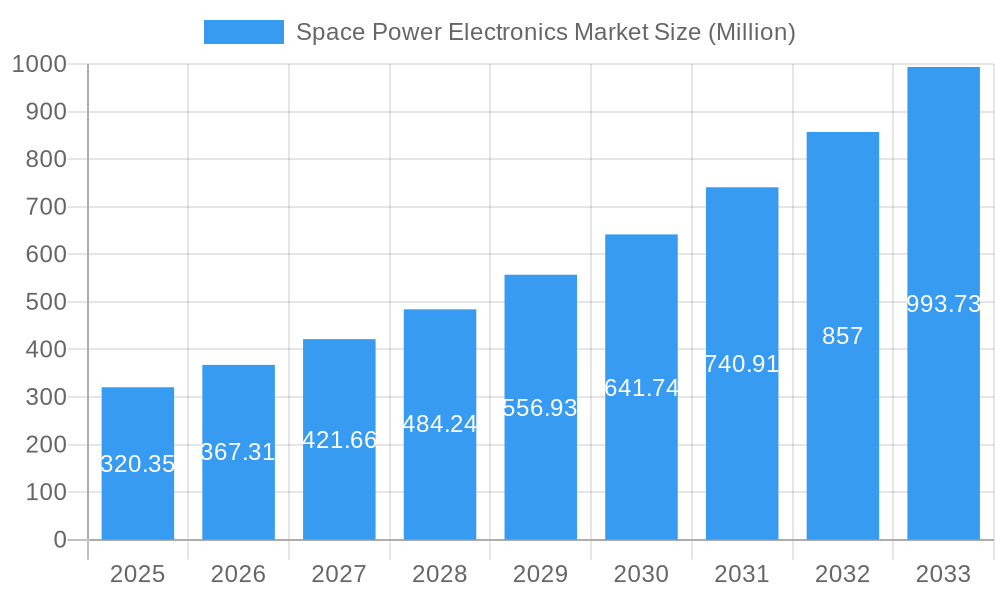
The Space Power Electronics market, valued at $320.35 million in 2025, is projected to experience robust growth, driven by the increasing demand for reliable and efficient power systems in space applications. A Compound Annual Growth Rate (CAGR) of 14.68% from 2025 to 2033 indicates a significant expansion of this market. This growth is fueled by several key factors. Firstly, the burgeoning space exploration activities, including satellite constellations for communication and Earth observation, necessitate advanced power electronics capable of withstanding harsh space environments. Secondly, the rising adoption of electric propulsion systems in spacecraft contributes to the demand for high-power, lightweight power electronics. Technological advancements in radiation-hardened and radiation-tolerant components are also contributing to the market's expansion. Furthermore, government initiatives and increased private investments in space technology are further driving this growth. The market is segmented by platform (satellites, spacecraft, launch vehicles, others), type (radiation-hardened, radiation-tolerant), and application (communication, earth observation, navigation, GPS and surveillance, technology development and education, others), offering diverse opportunities for players across the value chain. The major regional markets are North America, Europe, and Asia-Pacific, with North America currently holding a significant share due to substantial investment in space technology. However, the Asia-Pacific region is anticipated to exhibit strong growth due to increasing government support and private sector involvement in space programs. Competition is intense amongst established players like Honeywell, Microchip Technology, and others, prompting innovation and driving down costs.
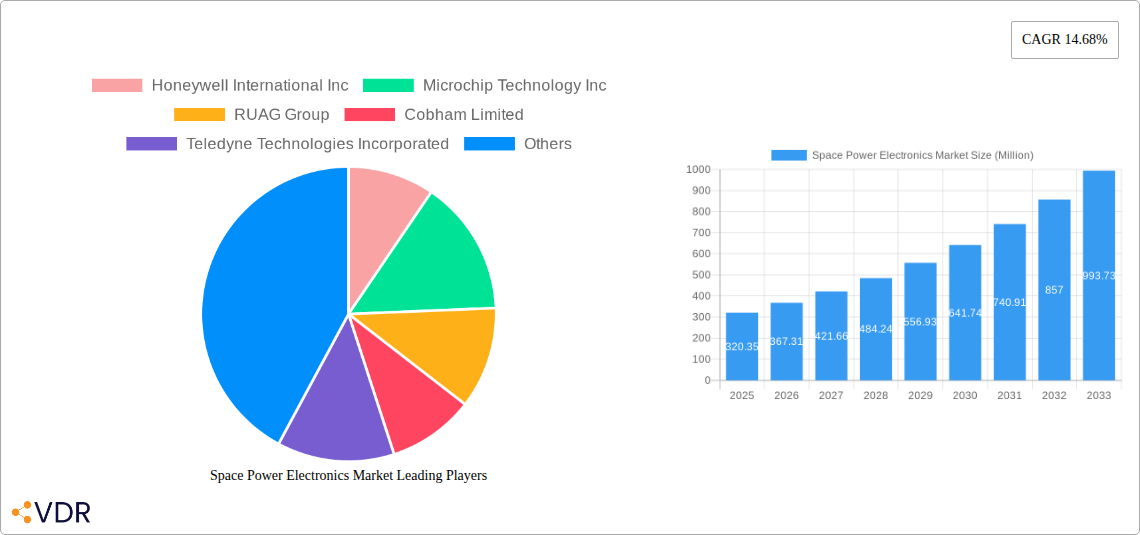
Space Power Electronics Market Market Size (In Million)
The market's growth trajectory is expected to remain positive throughout the forecast period, with continuous advancements in power electronics technology playing a pivotal role. Miniaturization, improved efficiency, and enhanced radiation hardness are key technological drivers that will shape future market trends. While challenges such as high initial investment costs and stringent regulatory requirements exist, the long-term prospects for the space power electronics market remain exceptionally strong, propelled by the ongoing expansion of the space industry and the increasing reliance on sophisticated power systems in various space applications. The increasing demand for reliable and efficient power sources in satellites, spacecraft and launch vehicles across various applications will lead to further market expansion.
Space Power Electronics Market Company Market Share
Space Power Electronics Market: A Comprehensive Report (2019-2033)
This comprehensive report provides an in-depth analysis of the Space Power Electronics Market, encompassing market dynamics, growth trends, regional dominance, product landscapes, and key players. The study period covers 2019-2033, with a base year of 2025 and a forecast period of 2025-2033. The report segments the market by platform (Satellites, Spacecraft and Launch Vehicles, Others), type (Radiation-Hardened, Radiation-Tolerant), and application (Communication, Earth Observation, Navigation, Global Positioning System (GPS) and Surveillance, Technology Development and Education, Others). The market is expected to reach xx Million units by 2033.
Space Power Electronics Market Dynamics & Structure
The Space Power Electronics Market is characterized by a moderately concentrated landscape, with key players like Honeywell International Inc, Microchip Technology Inc, and Texas Instruments Incorporated holding significant market share. Technological innovation, particularly in radiation-hardened technologies and miniaturization, is a primary driver. Stringent regulatory frameworks governing space-borne components influence market dynamics, while the high barrier to entry limits new entrants. The market also faces competition from alternative energy sources in niche applications. Mergers and acquisitions (M&A) activity has been relatively moderate in recent years, with xx deals recorded between 2019 and 2024.
- Market Concentration: Moderately concentrated, with top 5 players holding approximately xx% market share in 2025.
- Technological Innovation: Focus on higher efficiency, miniaturization, and improved radiation hardness.
- Regulatory Frameworks: Stringent safety and reliability standards governing aerospace components.
- Competitive Substitutes: Limited, but emerging technologies like advanced batteries pose potential threats.
- M&A Trends: Moderate activity, with xx deals completed between 2019 and 2024, primarily focused on technology acquisition and expansion.
- Innovation Barriers: High research and development costs, stringent testing requirements, and long lead times.
Space Power Electronics Market Growth Trends & Insights
The Space Power Electronics Market experienced significant growth during the historical period (2019-2024), with a CAGR of xx%. This growth is primarily driven by increasing demand for space-based services (communication, earth observation, navigation) and the rising adoption of miniaturized, high-efficiency power electronics in satellites and spacecraft. Technological advancements, such as the development of more radiation-tolerant components and improved power management systems, have further fueled market expansion. The market is expected to maintain a healthy growth trajectory during the forecast period (2025-2033), with a projected CAGR of xx%, driven by increased space exploration activities, growing investments in satellite constellations, and the emergence of new space applications. Market penetration of radiation-hardened components is expected to increase from xx% in 2025 to xx% by 2033.
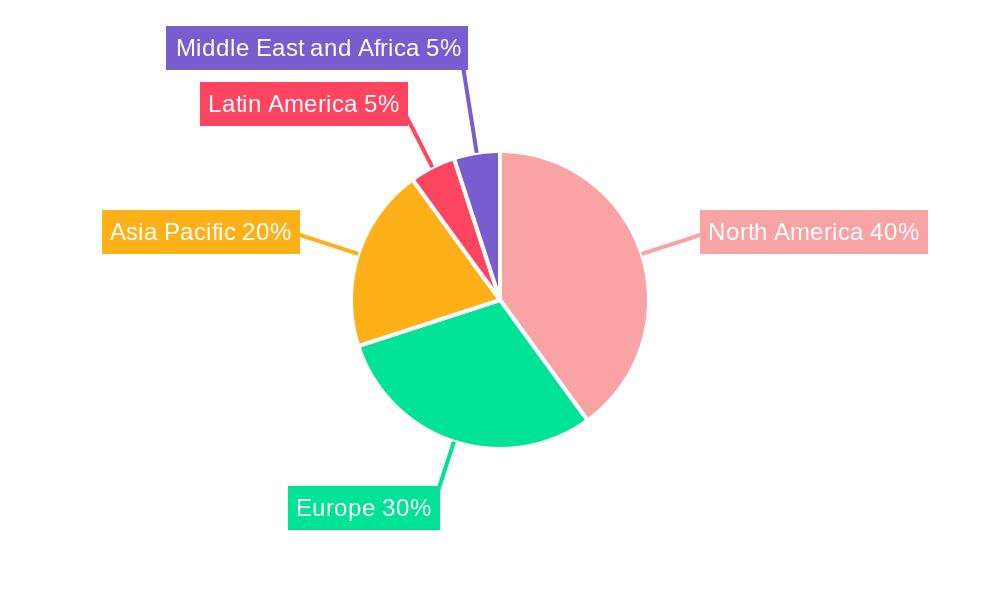
Dominant Regions, Countries, or Segments in Space Power Electronics Market
North America currently dominates the Space Power Electronics Market, accounting for approximately xx% of the global market share in 2025, driven by robust government funding for space programs, a well-established aerospace industry, and a strong presence of major players. Europe and Asia-Pacific are also significant markets, exhibiting substantial growth potential due to increasing space exploration initiatives and burgeoning commercial space sectors. Within the market segmentation, the Satellites segment holds the largest share, followed by Spacecraft and Launch Vehicles. Radiation-Hardened components command a larger market share than Radiation-Tolerant components due to their critical applications in harsh space environments.
- North America: Strong government investment in space exploration, large aerospace industry presence.
- Europe: Significant government and private sector investment in space technologies.
- Asia-Pacific: Rapid growth driven by increasing commercial space activities and government initiatives.
- Satellites Segment: Largest market share due to high component density and power requirements.
- Radiation-Hardened Components: Higher market share due to critical applications in harsh space environments.
Space Power Electronics Market Product Landscape
The Space Power Electronics Market offers a wide range of products, including power converters, power amplifiers, power supplies, and battery management systems. These components are designed to withstand the extreme conditions of space, such as radiation, extreme temperatures, and vacuum. Recent product innovations focus on increased efficiency, reduced size and weight, and improved radiation hardness. Unique selling propositions include enhanced reliability, longevity, and radiation tolerance, making them suitable for demanding space applications. Technological advancements involve the use of advanced materials, improved packaging techniques, and sophisticated control algorithms.
Key Drivers, Barriers & Challenges in Space Power Electronics Market
Key Drivers: Increased demand for space-based services, government investments in space exploration, technological advancements in miniaturization and radiation hardening, and the growing commercialization of space.
Key Barriers and Challenges: High manufacturing costs, stringent quality and reliability requirements, long lead times, supply chain disruptions (e.g., xx% of components sourced from a single region in 2024), and geopolitical factors affecting international collaborations. These challenges lead to approximately xx% increase in production time.
Emerging Opportunities in Space Power Electronics Market
Emerging trends include the miniaturization of components for CubeSats and nanosatellites, the development of more efficient power management systems for electric propulsion, and the increasing demand for high-power electronics for large constellations. Untapped markets include developing nations investing in space programs and emerging applications like space tourism and asteroid mining.
Growth Accelerators in the Space Power Electronics Market Industry
Technological breakthroughs in wide bandgap semiconductors, improved thermal management systems, and the development of advanced radiation-hardened materials are accelerating growth. Strategic partnerships between aerospace companies and semiconductor manufacturers are also fostering innovation. Market expansion strategies, including increased investments in R&D and exploration of new applications, are further fueling market growth.
Key Players Shaping the Space Power Electronics Market Market
Notable Milestones in Space Power Electronics Market Sector
- 2022: Launch of a new radiation-hardened power converter by Texas Instruments Incorporated.
- 2021: Acquisition of a power electronics company by Honeywell International Inc.
- 2020: Development of a highly efficient power amplifier by STMicroelectronics NV.
- 2019: Introduction of a new generation of radiation-tolerant power supplies by Microchip Technology Inc. (Specific details for other years would be included in the full report)
In-Depth Space Power Electronics Market Market Outlook
The Space Power Electronics Market is poised for continued growth, driven by sustained investments in space exploration and commercial space activities. The increasing adoption of advanced technologies, strategic partnerships, and expansion into new applications will create significant opportunities for market players. Focus on developing innovative solutions, improving supply chain resilience, and addressing sustainability concerns will be crucial for achieving long-term success in this dynamic market.
Space Power Electronics Market Segmentation
-
1. Platform
- 1.1. Satellites
- 1.2. Spacecraft and Launch Vehicles
- 1.3. Others
-
2. Type
- 2.1. Radiation-Hardened
- 2.2. Radiation-Tolerant
-
3. Application
- 3.1. Communication
- 3.2. Earth Observation
- 3.3. Navigati
- 3.4. Technology Development and Education
- 3.5. Others
Space Power Electronics Market Segmentation By Geography
-
1. North America
- 1.1. United States
- 1.2. Canada
-
2. Europe
- 2.1. United Kingdom
- 2.2. France
- 2.3. Germany
- 2.4. Russia
- 2.5. Rest of Europe
-
3. Asia Pacific
- 3.1. China
- 3.2. India
- 3.3. Japan
- 3.4. South Korea
- 3.5. Rest of Asia Pacific
-
4. Latin America
- 4.1. Brazil
- 4.2. Rest of Latin America
-
5. Middle East and Africa
- 5.1. Saudi Arabia
- 5.2. United Arab Emirates
- 5.3. Rest of Middle East and Africa
Space Power Electronics Market Regional Market Share
Geographic Coverage of Space Power Electronics Market
Space Power Electronics Market REPORT HIGHLIGHTS
| Aspects | Details |
|---|---|
| Study Period | 2020-2034 |
| Base Year | 2025 |
| Estimated Year | 2026 |
| Forecast Period | 2026-2034 |
| Historical Period | 2020-2025 |
| Growth Rate | CAGR of 14.68% from 2020-2034 |
| Segmentation |
|
Table of Contents
- 1. Introduction
- 1.1. Research Scope
- 1.2. Market Segmentation
- 1.3. Research Objective
- 1.4. Definitions and Assumptions
- 2. Executive Summary
- 2.1. Market Snapshot
- 3. Market Dynamics
- 3.1. Market Drivers
- 3.2. Market Restrains
- 3.3. Market Trends
- 3.4. Market Opportunities
- 4. Market Factor Analysis
- 4.1. Porters Five Forces
- 4.1.1. Bargaining Power of Suppliers
- 4.1.2. Bargaining Power of Buyers
- 4.1.3. Threat of New Entrants
- 4.1.4. Threat of Substitutes
- 4.1.5. Competitive Rivalry
- 4.2. PESTEL analysis
- 4.3. BCG Analysis
- 4.3.1. Stars (High Growth, High Market Share)
- 4.3.2. Cash Cows (Low Growth, High Market Share)
- 4.3.3. Question Mark (High Growth, Low Market Share)
- 4.3.4. Dogs (Low Growth, Low Market Share)
- 4.4. Ansoff Matrix Analysis
- 4.5. Supply Chain Analysis
- 4.6. Regulatory Landscape
- 4.7. Current Market Potential and Opportunity Assessment (TAM–SAM–SOM Framework)
- 4.8. VDR Analyst Note
- 4.1. Porters Five Forces
- 5. Market Analysis, Insights and Forecast 2021-2033
- 5.1. Market Analysis, Insights and Forecast - by Platform
- 5.1.1. Satellites
- 5.1.2. Spacecraft and Launch Vehicles
- 5.1.3. Others
- 5.2. Market Analysis, Insights and Forecast - by Type
- 5.2.1. Radiation-Hardened
- 5.2.2. Radiation-Tolerant
- 5.3. Market Analysis, Insights and Forecast - by Application
- 5.3.1. Communication
- 5.3.2. Earth Observation
- 5.3.3. Navigati
- 5.3.4. Technology Development and Education
- 5.3.5. Others
- 5.4. Market Analysis, Insights and Forecast - by Region
- 5.4.1. North America
- 5.4.2. Europe
- 5.4.3. Asia Pacific
- 5.4.4. Latin America
- 5.4.5. Middle East and Africa
- 5.1. Market Analysis, Insights and Forecast - by Platform
- 6. Global Space Power Electronics Market Analysis, Insights and Forecast, 2021-2033
- 6.1. Market Analysis, Insights and Forecast - by Platform
- 6.1.1. Satellites
- 6.1.2. Spacecraft and Launch Vehicles
- 6.1.3. Others
- 6.2. Market Analysis, Insights and Forecast - by Type
- 6.2.1. Radiation-Hardened
- 6.2.2. Radiation-Tolerant
- 6.3. Market Analysis, Insights and Forecast - by Application
- 6.3.1. Communication
- 6.3.2. Earth Observation
- 6.3.3. Navigati
- 6.3.4. Technology Development and Education
- 6.3.5. Others
- 6.1. Market Analysis, Insights and Forecast - by Platform
- 7. North America Space Power Electronics Market Analysis, Insights and Forecast, 2021-2033
- 7.1. Market Analysis, Insights and Forecast - by Platform
- 7.1.1. Satellites
- 7.1.2. Spacecraft and Launch Vehicles
- 7.1.3. Others
- 7.2. Market Analysis, Insights and Forecast - by Type
- 7.2.1. Radiation-Hardened
- 7.2.2. Radiation-Tolerant
- 7.3. Market Analysis, Insights and Forecast - by Application
- 7.3.1. Communication
- 7.3.2. Earth Observation
- 7.3.3. Navigati
- 7.3.4. Technology Development and Education
- 7.3.5. Others
- 7.1. Market Analysis, Insights and Forecast - by Platform
- 8. Europe Space Power Electronics Market Analysis, Insights and Forecast, 2021-2033
- 8.1. Market Analysis, Insights and Forecast - by Platform
- 8.1.1. Satellites
- 8.1.2. Spacecraft and Launch Vehicles
- 8.1.3. Others
- 8.2. Market Analysis, Insights and Forecast - by Type
- 8.2.1. Radiation-Hardened
- 8.2.2. Radiation-Tolerant
- 8.3. Market Analysis, Insights and Forecast - by Application
- 8.3.1. Communication
- 8.3.2. Earth Observation
- 8.3.3. Navigati
- 8.3.4. Technology Development and Education
- 8.3.5. Others
- 8.1. Market Analysis, Insights and Forecast - by Platform
- 9. Asia Pacific Space Power Electronics Market Analysis, Insights and Forecast, 2021-2033
- 9.1. Market Analysis, Insights and Forecast - by Platform
- 9.1.1. Satellites
- 9.1.2. Spacecraft and Launch Vehicles
- 9.1.3. Others
- 9.2. Market Analysis, Insights and Forecast - by Type
- 9.2.1. Radiation-Hardened
- 9.2.2. Radiation-Tolerant
- 9.3. Market Analysis, Insights and Forecast - by Application
- 9.3.1. Communication
- 9.3.2. Earth Observation
- 9.3.3. Navigati
- 9.3.4. Technology Development and Education
- 9.3.5. Others
- 9.1. Market Analysis, Insights and Forecast - by Platform
- 10. Latin America Space Power Electronics Market Analysis, Insights and Forecast, 2021-2033
- 10.1. Market Analysis, Insights and Forecast - by Platform
- 10.1.1. Satellites
- 10.1.2. Spacecraft and Launch Vehicles
- 10.1.3. Others
- 10.2. Market Analysis, Insights and Forecast - by Type
- 10.2.1. Radiation-Hardened
- 10.2.2. Radiation-Tolerant
- 10.3. Market Analysis, Insights and Forecast - by Application
- 10.3.1. Communication
- 10.3.2. Earth Observation
- 10.3.3. Navigati
- 10.3.4. Technology Development and Education
- 10.3.5. Others
- 10.1. Market Analysis, Insights and Forecast - by Platform
- 11. Middle East and Africa Space Power Electronics Market Analysis, Insights and Forecast, 2021-2033
- 11.1. Market Analysis, Insights and Forecast - by Platform
- 11.1.1. Satellites
- 11.1.2. Spacecraft and Launch Vehicles
- 11.1.3. Others
- 11.2. Market Analysis, Insights and Forecast - by Type
- 11.2.1. Radiation-Hardened
- 11.2.2. Radiation-Tolerant
- 11.3. Market Analysis, Insights and Forecast - by Application
- 11.3.1. Communication
- 11.3.2. Earth Observation
- 11.3.3. Navigati
- 11.3.4. Technology Development and Education
- 11.3.5. Others
- 11.1. Market Analysis, Insights and Forecast - by Platform
- 12. Competitive Analysis
- 12.1. Company Profiles
- 12.1.1 Honeywell International Inc
- 12.1.1.1. Company Overview
- 12.1.1.2. Products
- 12.1.1.3. Company Financials
- 12.1.1.4. SWOT Analysis
- 12.1.2 Microchip Technology Inc
- 12.1.2.1. Company Overview
- 12.1.2.2. Products
- 12.1.2.3. Company Financials
- 12.1.2.4. SWOT Analysis
- 12.1.3 RUAG Group
- 12.1.3.1. Company Overview
- 12.1.3.2. Products
- 12.1.3.3. Company Financials
- 12.1.3.4. SWOT Analysis
- 12.1.4 Cobham Limited
- 12.1.4.1. Company Overview
- 12.1.4.2. Products
- 12.1.4.3. Company Financials
- 12.1.4.4. SWOT Analysis
- 12.1.5 Teledyne Technologies Incorporated
- 12.1.5.1. Company Overview
- 12.1.5.2. Products
- 12.1.5.3. Company Financials
- 12.1.5.4. SWOT Analysis
- 12.1.6 BAE Systems PLC
- 12.1.6.1. Company Overview
- 12.1.6.2. Products
- 12.1.6.3. Company Financials
- 12.1.6.4. SWOT Analysis
- 12.1.7 STMicroelectronics NV
- 12.1.7.1. Company Overview
- 12.1.7.2. Products
- 12.1.7.3. Company Financials
- 12.1.7.4. SWOT Analysis
- 12.1.8 ON Semiconductor
- 12.1.8.1. Company Overview
- 12.1.8.2. Products
- 12.1.8.3. Company Financials
- 12.1.8.4. SWOT Analysis
- 12.1.9 Renesas Electronics Corporation
- 12.1.9.1. Company Overview
- 12.1.9.2. Products
- 12.1.9.3. Company Financials
- 12.1.9.4. SWOT Analysis
- 12.1.10 Infineon Technologies A
- 12.1.10.1. Company Overview
- 12.1.10.2. Products
- 12.1.10.3. Company Financials
- 12.1.10.4. SWOT Analysis
- 12.1.11 Texas Instruments Incorporated
- 12.1.11.1. Company Overview
- 12.1.11.2. Products
- 12.1.11.3. Company Financials
- 12.1.11.4. SWOT Analysis
- 12.1.12 Microsemi Conduction
- 12.1.12.1. Company Overview
- 12.1.12.2. Products
- 12.1.12.3. Company Financials
- 12.1.12.4. SWOT Analysis
- 12.1.13 Analog Devices Inc
- 12.1.13.1. Company Overview
- 12.1.13.2. Products
- 12.1.13.3. Company Financials
- 12.1.13.4. SWOT Analysis
- 12.1.1 Honeywell International Inc
- 12.2. Market Entropy
- 12.2.1 Company's Key Areas Served
- 12.2.2 Recent Developments
- 12.3. Company Market Share Analysis 2025
- 12.3.1 Top 5 Companies Market Share Analysis
- 12.3.2 Top 3 Companies Market Share Analysis
- 12.4. List of Potential Customers
- 13. Research Methodology
List of Figures
- Figure 1: Global Space Power Electronics Market Revenue Breakdown (Million, %) by Region 2025 & 2033
- Figure 2: North America Space Power Electronics Market Revenue (Million), by Platform 2025 & 2033
- Figure 3: North America Space Power Electronics Market Revenue Share (%), by Platform 2025 & 2033
- Figure 4: North America Space Power Electronics Market Revenue (Million), by Type 2025 & 2033
- Figure 5: North America Space Power Electronics Market Revenue Share (%), by Type 2025 & 2033
- Figure 6: North America Space Power Electronics Market Revenue (Million), by Application 2025 & 2033
- Figure 7: North America Space Power Electronics Market Revenue Share (%), by Application 2025 & 2033
- Figure 8: North America Space Power Electronics Market Revenue (Million), by Country 2025 & 2033
- Figure 9: North America Space Power Electronics Market Revenue Share (%), by Country 2025 & 2033
- Figure 10: Europe Space Power Electronics Market Revenue (Million), by Platform 2025 & 2033
- Figure 11: Europe Space Power Electronics Market Revenue Share (%), by Platform 2025 & 2033
- Figure 12: Europe Space Power Electronics Market Revenue (Million), by Type 2025 & 2033
- Figure 13: Europe Space Power Electronics Market Revenue Share (%), by Type 2025 & 2033
- Figure 14: Europe Space Power Electronics Market Revenue (Million), by Application 2025 & 2033
- Figure 15: Europe Space Power Electronics Market Revenue Share (%), by Application 2025 & 2033
- Figure 16: Europe Space Power Electronics Market Revenue (Million), by Country 2025 & 2033
- Figure 17: Europe Space Power Electronics Market Revenue Share (%), by Country 2025 & 2033
- Figure 18: Asia Pacific Space Power Electronics Market Revenue (Million), by Platform 2025 & 2033
- Figure 19: Asia Pacific Space Power Electronics Market Revenue Share (%), by Platform 2025 & 2033
- Figure 20: Asia Pacific Space Power Electronics Market Revenue (Million), by Type 2025 & 2033
- Figure 21: Asia Pacific Space Power Electronics Market Revenue Share (%), by Type 2025 & 2033
- Figure 22: Asia Pacific Space Power Electronics Market Revenue (Million), by Application 2025 & 2033
- Figure 23: Asia Pacific Space Power Electronics Market Revenue Share (%), by Application 2025 & 2033
- Figure 24: Asia Pacific Space Power Electronics Market Revenue (Million), by Country 2025 & 2033
- Figure 25: Asia Pacific Space Power Electronics Market Revenue Share (%), by Country 2025 & 2033
- Figure 26: Latin America Space Power Electronics Market Revenue (Million), by Platform 2025 & 2033
- Figure 27: Latin America Space Power Electronics Market Revenue Share (%), by Platform 2025 & 2033
- Figure 28: Latin America Space Power Electronics Market Revenue (Million), by Type 2025 & 2033
- Figure 29: Latin America Space Power Electronics Market Revenue Share (%), by Type 2025 & 2033
- Figure 30: Latin America Space Power Electronics Market Revenue (Million), by Application 2025 & 2033
- Figure 31: Latin America Space Power Electronics Market Revenue Share (%), by Application 2025 & 2033
- Figure 32: Latin America Space Power Electronics Market Revenue (Million), by Country 2025 & 2033
- Figure 33: Latin America Space Power Electronics Market Revenue Share (%), by Country 2025 & 2033
- Figure 34: Middle East and Africa Space Power Electronics Market Revenue (Million), by Platform 2025 & 2033
- Figure 35: Middle East and Africa Space Power Electronics Market Revenue Share (%), by Platform 2025 & 2033
- Figure 36: Middle East and Africa Space Power Electronics Market Revenue (Million), by Type 2025 & 2033
- Figure 37: Middle East and Africa Space Power Electronics Market Revenue Share (%), by Type 2025 & 2033
- Figure 38: Middle East and Africa Space Power Electronics Market Revenue (Million), by Application 2025 & 2033
- Figure 39: Middle East and Africa Space Power Electronics Market Revenue Share (%), by Application 2025 & 2033
- Figure 40: Middle East and Africa Space Power Electronics Market Revenue (Million), by Country 2025 & 2033
- Figure 41: Middle East and Africa Space Power Electronics Market Revenue Share (%), by Country 2025 & 2033
List of Tables
- Table 1: Global Space Power Electronics Market Revenue Million Forecast, by Platform 2020 & 2033
- Table 2: Global Space Power Electronics Market Revenue Million Forecast, by Type 2020 & 2033
- Table 3: Global Space Power Electronics Market Revenue Million Forecast, by Application 2020 & 2033
- Table 4: Global Space Power Electronics Market Revenue Million Forecast, by Region 2020 & 2033
- Table 5: Global Space Power Electronics Market Revenue Million Forecast, by Platform 2020 & 2033
- Table 6: Global Space Power Electronics Market Revenue Million Forecast, by Type 2020 & 2033
- Table 7: Global Space Power Electronics Market Revenue Million Forecast, by Application 2020 & 2033
- Table 8: Global Space Power Electronics Market Revenue Million Forecast, by Country 2020 & 2033
- Table 9: United States Space Power Electronics Market Revenue (Million) Forecast, by Application 2020 & 2033
- Table 10: Canada Space Power Electronics Market Revenue (Million) Forecast, by Application 2020 & 2033
- Table 11: Global Space Power Electronics Market Revenue Million Forecast, by Platform 2020 & 2033
- Table 12: Global Space Power Electronics Market Revenue Million Forecast, by Type 2020 & 2033
- Table 13: Global Space Power Electronics Market Revenue Million Forecast, by Application 2020 & 2033
- Table 14: Global Space Power Electronics Market Revenue Million Forecast, by Country 2020 & 2033
- Table 15: United Kingdom Space Power Electronics Market Revenue (Million) Forecast, by Application 2020 & 2033
- Table 16: France Space Power Electronics Market Revenue (Million) Forecast, by Application 2020 & 2033
- Table 17: Germany Space Power Electronics Market Revenue (Million) Forecast, by Application 2020 & 2033
- Table 18: Russia Space Power Electronics Market Revenue (Million) Forecast, by Application 2020 & 2033
- Table 19: Rest of Europe Space Power Electronics Market Revenue (Million) Forecast, by Application 2020 & 2033
- Table 20: Global Space Power Electronics Market Revenue Million Forecast, by Platform 2020 & 2033
- Table 21: Global Space Power Electronics Market Revenue Million Forecast, by Type 2020 & 2033
- Table 22: Global Space Power Electronics Market Revenue Million Forecast, by Application 2020 & 2033
- Table 23: Global Space Power Electronics Market Revenue Million Forecast, by Country 2020 & 2033
- Table 24: China Space Power Electronics Market Revenue (Million) Forecast, by Application 2020 & 2033
- Table 25: India Space Power Electronics Market Revenue (Million) Forecast, by Application 2020 & 2033
- Table 26: Japan Space Power Electronics Market Revenue (Million) Forecast, by Application 2020 & 2033
- Table 27: South Korea Space Power Electronics Market Revenue (Million) Forecast, by Application 2020 & 2033
- Table 28: Rest of Asia Pacific Space Power Electronics Market Revenue (Million) Forecast, by Application 2020 & 2033
- Table 29: Global Space Power Electronics Market Revenue Million Forecast, by Platform 2020 & 2033
- Table 30: Global Space Power Electronics Market Revenue Million Forecast, by Type 2020 & 2033
- Table 31: Global Space Power Electronics Market Revenue Million Forecast, by Application 2020 & 2033
- Table 32: Global Space Power Electronics Market Revenue Million Forecast, by Country 2020 & 2033
- Table 33: Brazil Space Power Electronics Market Revenue (Million) Forecast, by Application 2020 & 2033
- Table 34: Rest of Latin America Space Power Electronics Market Revenue (Million) Forecast, by Application 2020 & 2033
- Table 35: Global Space Power Electronics Market Revenue Million Forecast, by Platform 2020 & 2033
- Table 36: Global Space Power Electronics Market Revenue Million Forecast, by Type 2020 & 2033
- Table 37: Global Space Power Electronics Market Revenue Million Forecast, by Application 2020 & 2033
- Table 38: Global Space Power Electronics Market Revenue Million Forecast, by Country 2020 & 2033
- Table 39: Saudi Arabia Space Power Electronics Market Revenue (Million) Forecast, by Application 2020 & 2033
- Table 40: United Arab Emirates Space Power Electronics Market Revenue (Million) Forecast, by Application 2020 & 2033
- Table 41: Rest of Middle East and Africa Space Power Electronics Market Revenue (Million) Forecast, by Application 2020 & 2033
Frequently Asked Questions
1. What is the projected Compound Annual Growth Rate (CAGR) of the Space Power Electronics Market?
The projected CAGR is approximately 14.68%.
2. Which companies are prominent players in the Space Power Electronics Market?
Key companies in the market include Honeywell International Inc, Microchip Technology Inc, RUAG Group, Cobham Limited, Teledyne Technologies Incorporated, BAE Systems PLC, STMicroelectronics NV, ON Semiconductor, Renesas Electronics Corporation, Infineon Technologies A, Texas Instruments Incorporated, Microsemi Conduction, Analog Devices Inc.
3. What are the main segments of the Space Power Electronics Market?
The market segments include Platform, Type, Application.
4. Can you provide details about the market size?
The market size is estimated to be USD 320.35 Million as of 2022.
5. What are some drivers contributing to market growth?
N/A
6. What are the notable trends driving market growth?
Satellites are Expected to Dominate the Market During the Forecast Period.
7. Are there any restraints impacting market growth?
N/A
8. Can you provide examples of recent developments in the market?
N/A
9. What pricing options are available for accessing the report?
Pricing options include single-user, multi-user, and enterprise licenses priced at USD 4750, USD 5250, and USD 8750 respectively.
10. Is the market size provided in terms of value or volume?
The market size is provided in terms of value, measured in Million.
11. Are there any specific market keywords associated with the report?
Yes, the market keyword associated with the report is "Space Power Electronics Market," which aids in identifying and referencing the specific market segment covered.
12. How do I determine which pricing option suits my needs best?
The pricing options vary based on user requirements and access needs. Individual users may opt for single-user licenses, while businesses requiring broader access may choose multi-user or enterprise licenses for cost-effective access to the report.
13. Are there any additional resources or data provided in the Space Power Electronics Market report?
While the report offers comprehensive insights, it's advisable to review the specific contents or supplementary materials provided to ascertain if additional resources or data are available.
14. How can I stay updated on further developments or reports in the Space Power Electronics Market?
To stay informed about further developments, trends, and reports in the Space Power Electronics Market, consider subscribing to industry newsletters, following relevant companies and organizations, or regularly checking reputable industry news sources and publications.
Methodology
Step 1 - Identification of Relevant Samples Size from Population Database


Step 2 - Approaches for Defining Global Market Size (Value, Volume* & Price*)

Note*: In applicable scenarios
Step 3 - Data Sources
Primary Research
- Web Analytics
- Survey Reports
- Research Institute
- Latest Research Reports
- Opinion Leaders
Secondary Research
- Annual Reports
- White Paper
- Latest Press Release
- Industry Association
- Paid Database
- Investor Presentations

Step 4 - Data Triangulation
Involves using different sources of information in order to increase the validity of a study
These sources are likely to be stakeholders in a program - participants, other researchers, program staff, other community members, and so on.
Then we put all data in single framework & apply various statistical tools to find out the dynamic on the market.
During the analysis stage, feedback from the stakeholder groups would be compared to determine areas of agreement as well as areas of divergence